www.scielo.br/rbg
3D BATHYMETRY AND ACOUSTIC SEABED CLASSIFICATION OF PELOTAS BASIN, BRAZIL
Marcelo Peres de Pinho
1, Lauro Saint Pastous Madureira
2, Lauro J´ulio Calliari
3,
Stefan Cruz Weigert
4and Paloma Lumi Costa
1ABSTRACT.An acoustic seabed classification of the Pelotas Basin (PB, Brazil) was generated and overlaid on a 3D bathymetric representation, which was elaborated from acoustic and altimetry data. The map was validated with sedimentological charts in order to identify areas of morpho-sedimentary interest. The hydroacoustic data used were acquired with a SIMRAD EK500 scientific echo sounder operating at a frequency of 38 kHz, obtained over twenty cruises totalling 5,249,191 acoustic readings during 15,367 nautical miles in the PB. Bottom features such as the Rio Grande Valley, Rio Grande Cone, Rio Grande Terrace and Florian´opolis Terrace were identified. BSBS (Bottom Surface Backscattering Strength), expressed in decibels (dB), is a logarithmic ratio between the incident acoustic energy and the energy reflected by the seabed. In general, the PB showed intermediate BSBS values. Lower BSBS values, which are associated with finer sediments were found on the continental slope and the oceanic areas. On the other hand, higher values associated with coarse sediments did not occupy large areas. Good correspondence was found between high BSBS values and areas with coarse bottom sediment according to the sedimentological charts. The integration of bathymetry and BSBS data together with available sedimen-tological information and maps of non-renewable resources of the BP enabled the identification of potential areas for mineral exploitation at the region.
Keywords: bathymetry, underwater morphology, acoustic seabed backscatter, BSBS, 3D visualization.
RESUMO.Um mapa de classificac¸˜ao ac´ustica de fundo da Bacia de Pelotas (BP) foi gerado, sobreposto a uma representac¸˜ao batim´etrica 3D elaborada a partir de dados ac´usticos e altim´etricos e validado com cartas sedimentol´ogicas visando identificar ´areas de interesse morfo-sedimentar. Dados hidroac´usticos adquiridos com uma ecossonda cient´ıfica SIMRAD EK500 operando na frequˆencia de 38 kHz, obtidos ao longo de vinte cruzeiros que totalizam 5.249.191 leituras ac´usticas em 15.367 milhas n´auticas na BP foram utilizados. Feic¸˜oes de fundo como o Vale do Rio Grande, Cone do Rio Grande, Terrac¸o do Rio Grande e o terrac¸o ao largo de Florian´opolis foram identificadas. O BSBS (forc¸a de retroespalhamento da superf´ıcie do fundo), expresso em decib´eis (dB), representa uma relac¸˜ao logar´ıtmica entre a energia ac´ustica incidente e a refletida pelo fundo. De modo geral, a BP apresentou valores intermedi´arios de BSBS. Baixos valores de BSBS, associados a sedimentos finos, predominaram no talude e regi˜ao oceˆanica. Altos valores, associados a sedimentos grossos, n˜ao ocuparam grandes ´areas. Houve boa correspondˆencia entre as ocorrˆencias de altos valores de BSBS e ´areas com fundos constitu´ıdos por sedimentos grossos segundo as cartas sedimentol´ogicas. A integrac¸˜ao das informac¸˜oes batim´etricas e BSBS, confrontadas com informac¸ ˜oes sedimentol´ogicas previamente mapeadas, e tamb´em com mapas de recursos n˜ao renov´aveis da BP, permitiu a identificac¸˜ao de ´areas potenciais para a explotac¸˜ao mineral na regi˜ao.
Palavras-chave: batimetria, morfologia submarina, retroespalhamento ac´ustico de fundo, BSBS, visualizac¸˜ao 3D.
1Universidade Federal do Rio Grande (FURG), Institute of Oceanography, Fisheries Technology and Hydroacoustics Laboratory, Av. It´alia, km 8, Campus Carreiros, P.O. Box: 474, 96201-900 Rio Grande, RS, Brazil. Phone: +55(53) 3233-6528; Fax: +55(53) 3233-6601 – E-mails: [email protected];
2Universidade Federal do Rio Grande (FURG), Institute of Oceanography, Fisheries Technology and Hydroacoustics Laboratory, Av. It´alia, km 8, Campus Carreiros, P.O. Box: 474, 96201-900 Rio Grande, RS, Brazil. Phone: +55(53) 3233-6555; Fax: +55(53) 3233-6601 – E-mail: [email protected]
3Universidade Federal do Rio Grande (FURG), Institute of Oceanography, Geological Oceanography Laboratory, Av. It´alia, km 8, Campus Carreiros, P.O. Box: 474, 96201-900 Rio Grande, RS, Brazil. Phone: +55(53) 3233-6518; Fax: +55(53) 3233-6601 – E-mail: [email protected]
4Universidade Federal do Rio Grande (FURG), Institute of Oceanography, Fisheries Technology and Hydroacoustics Laboratory, Av. It´alia, km 8, Campus Carreiros, P.O. Box: 474, 96201-900 Rio Grande, RS, Brazil. Phone: +55(53) 3233-6740; Fax: +55(53) 3233-6601 – E-mail: [email protected]
INTRODUCTION
The knowledge of relief, bottom types and presence or absence of geomorphological features are of fundamental importance for several activities related to sectors such as oceanic engineering, environmental defense organizations and, especially, the oil in-dustry. The bathymetry and composition of marine substrate rep-resent fundamental information for several areas of human knowl-edge, whether scientific, economic, strategic, educational, man-agement, or even political (Sandwell et al., 2002). Regarding the hydrodynamic and biological aspects, bottom topography has a strong influence over the oceanic circulation (Gille et al., 2004), the mixing of water masses and global climate (Kunze & Llewellyn Smith, 2004; Munk & Wunsch, 1998), as well as over distribution and biological diversity (Koslow, 1997).
The knowledge of ocean bathymetry has progressed rapidly since the last century, with the progress of acoustic, optical and radar techniques. The ocean has been mapped at spatial scales ranging from centimetres to kilometres, although much work is still needed to map accurately the oceanographic environment (Dierssen Jr & Theberge, 2011; Hall, 2006). Because of the vast-ness of the oceans, bathymetric mapping measurements per-formed exclusively by vessels are extremely difficult due to opera-tional, financial and temporal issues (Vogt et al., 2000). This real-ity makes it hard to create global bathymetric data banks because of the heterogeneity of the surveys coverage (Hell et al., 2012). In this context, the indirect depth measurements from satellite altimetry emerge as an alternative to fulfil bathymetric grids with low readings coverage taken from vessels.
According to Anderson et al. (2008), acoustic methods are the most efficient remote tool to map and monitor large oceanic areas. Acoustic data can be used to create digital elevation mod-els, on scales ranging from meters to thousands of square kilome-tres, generating perspectives of marine landscapes as never seen before. Moreover, according to the authors, the bottom acoustic backscatter can be used for surface sediment classification and, in some cases, monitoring of biological communities.
Thus, the acoustic methods for bottom classification emerged as important tools for remote characterization of marine substrate. According to Tegowski (2005), due to its non-invasive nature, these methods have a lower operational cost, and in addition, they enable a rapid mapping of the seabed sediments, therefore being more versatile and effective, although less precise than traditional techniques of underwater investigation.
The application of acoustic methodology for seabed classifi-cation is a recent science (Anderson et al., 2008), largely driven by the development of commercial systems in the 1990’s for
classification of surface sediments and demersal species habitats (Costa et al., 2013).
Bottom Surface Backscatter Strength (BSBS) or, simply, Backscatter Strength (BS) is, basically, the acoustic energy re-flected by the seabed surface, i.e., it is the capacity that a particular substrate has of reflecting the energy that reaches it. This energy can be used to classify sediments (Collins et al., 1996; Anderson et al., 2002, 2008). The ratio of reflected energy is determined by the reflection coefficient, which in turn is a function of acous-tic impedance of the environment (water) and the reflector, in this case, the seabed (MacLennan & Simmonds, 1992). The acoustic frontwave that reaches the seabed and returns to the transducer represents the backscattered energy. Irregular and flat bottoms present different degrees of energy scattering, and the sediment physical properties also significantly affect the response. Sedi-mentary landforms such as ripple marks, rocks texture, lithologi-cal or mineralogilithologi-cal composition and benthonic organisms, also influence the signal (Collins et al., 1996). The BSBS is expressed in decibels (dB), which is a logarithmic relationship between the intensity of the signal that reaches the seafloor and is reflected by it.
Only a few studies have used acoustic methodology to map bottom features or sedimentary characteristics in BP. Figueiredo & Kowsmann (1976), Calliari & Abreu (1984) and Calliari et al. (1994) conducted side scan sonar surveys simultaneously with bottom surface sediment samples, relating sonographic and sedimentary patterns in different areas of the inner shelf in the state of Rio Grande do Sul (RS). Figueiredo & Madureira (2004) related BSBS, bathymetry and bottom surface samplings of southeast-ern and southsoutheast-ern Brazil, delimiting sedimentary provinces. Cooke et al. (2007) performed validation, analysis and interpretation of bottom echo sounding data of Continental Shelf (CS), slope and adjacent oceanic region between Fortaleza-CE and Chu´ı-RS with focus on morphology and bottom types. Campos et al. (2009) analyzed BSBS data from Albard˜ao-RS Paleochannel, identifying significant differences in measured values inside and outside of paleochannel region, indicating sediment differentiation. Pinho et al. (2011) identified potential areas of occurrence of phosphate deposits in the southeastern and southern Brazil, from relations between bathymetric, sedimentological and BSBS data in a 3D representation of region. In a recent study, Costa et al. (2013) used BSBS data from CS and upper slope from PB and mapped different substrates acoustically.
In this context, the aim of this work was to generate a new seabed acoustic classification map of the PB region, identify-ing areas of interest in terms of potential presence of mineral
resources. This identification was made by overlaying the BSBS map with a 3D bathymetric representation of the area, which was generated by acoustic and satellite altimetry data, and by compar-ison with sedimentological and mineral resources charts.
Study area
The study area of this work was the immersed Brazilian portion of PB, which covers an area of 210,000 km2, between 28◦40’S
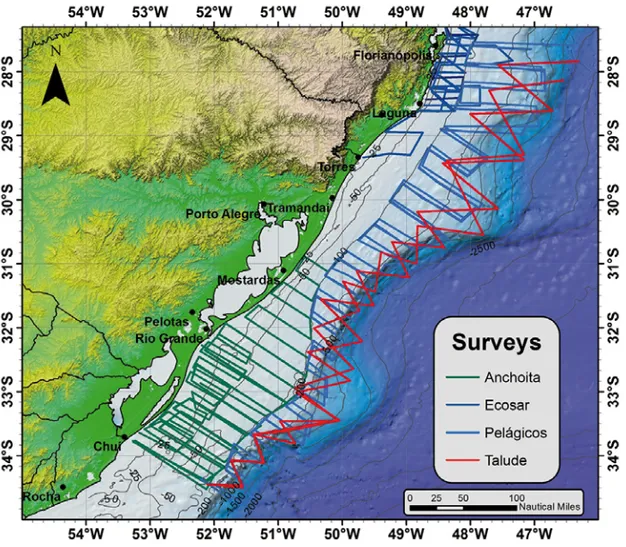
and 34◦S, limited in the south by the boundary with Uruguay, and in the north by the Santos Basin boundary, on the Florian´opolis High, to the 2,000 m isobath (Dias et al., 1994). Figure 1 illus-trates the study area together with survey designs used in the re-search cruises (Table 1).
The southern Brazilian CS, where PB is inserted, is relatively large compared to other regions of Brazil. The relief is smooth with low declivity and bathymetric contours following the coastal line. The average width of the southern Brazilian CS is 125 km, ranging from a minimum of 90 km in Mostardas-RS to a max-imum of 190 km, in front of the Mirim Lagoon, in the extreme south (Zembruscki, 1979). According to the author, the maximum
depth of the shelf break occurs in Torres-RS, on the 180 m iso-bath, and the minimum depth between Mirim Lagoon and the Chu´ı at 80 m deep. A highlighted of the region is the presence of secondary provinces associated with elevations and bottom irregularities, including the Elevation and Cone of Rio Grande and Rio Grande Valleys, located south of the cone.
The sedimentary cover of the continental shelf is predomi-nantly clastic terrigenous (Corrˆea, 1987) and, in general, except in the medium shelf along Patos Lagoon, where there is a predom-inance of sandy silt, the inner and medium shelf present muddy sediments (Figueiredo & Madureira, 2004). On the south of the city of Rio Grande, the predominance is of sand, while the conti-nental slope of the entire region shows a predominance of silt, with occurrences of sandy silt near shelf break (Figueiredo & Madureira, 2004).
Regarding the surface hydrodynamics of the PB, the outer shelf and continental slope are under the influence of tropical and subtropical waters carried by the Brazil Current. The convergence of the Brazil and the Malvinas Current, known as Brazil/Malvinas Confluence and located over Argentinian CS (Gordon, 1981; Piola et al., 2000), strongly influences the southern portion of
Table 1 – Oceanographic research cruises conducted in study area.
Cruises Period Year Region studied Depth limits Track extension (m) in PB (nm) Ecosar 2 08/06-03/07 1995 SC/PR/SP/RJ 100-500 260 Ecosar 3 13/11-05/12 1995 SC/PR/SP/RJ 100-500 166 Pelagicos 1 15/07-03/09 1996 RS/SC/PR/SP/RJ 100-2000 1749 Pelagicos 2 21/04-26/05 1997 RS/SC/PR/SP/RJ 100-2000 1749 Pelagicos 3 06/11-23/12 1997 RS/SC/PR/SP/RJ 100-2000 1793 Anchoita 1 10/08-17/08 2005 RS 20-100 767 Anchoita 2 19/09-26/08 2005 RS 20-100 360 Ecosar 4 17/01-05/02 2008 SC/PR/SP/RJ 20-100 263 Ecosar 5 06/11-29/11 2008 SC/PR/SP/RJ 20-100 255 Ecosar 6 21/09-09/10 2009 SC/PR/SP/RJ 20-100 252 Talude 1 21/10-06/11 2009 RS/SC/PR/SP/RJ 100-2000 894 Talude 2 22/04-14/05 2010 RS/SC/PR/SP/RJ 100-2000 1140 Ecosar 7 03/03-23-03 2010 SC/PR/SP/RJ 20-100 246 Anchoita 1 22/06-29/06 2010 RS 20-100 582 Anchoita 2 06/08-18/08 2010 RS 20-100 613 Anchoita 3 31/08-06/09 2010 RS 20-100 635 Anchoita 4 16/09-26/09 2010 RS 20-100 633 Anchoita 5 04/10-10/10 2010 RS 20-100 632 Talude 3 19/10-19/11 2010 RS/SC/PR/SP/RJ 100-2000 1189 Talude 4 09/04-10/05 2011 RS/SC/PR/SP/RJ 100-2000 1189
the Brazilian CS. On the inner shelf, the hydrodynamics and water masses are strongly influenced by freshwater discharge from Patos Lagoon and La Plata River and intrusion of waters from the Uruguayan and Argentinian CS (Soares & M¨oller, 2001). The North Atlantic Deep Water (NADW), formed in the northern hemisphere, and the Antarctic Bottom Water (ABW), formed in the Antarctic continent, determine deep and bottom circulation on the region.
METHODOLOGY Research cruises
This research used hydroacoustic data from twenty oceanographic research cruises, executed entirely or partially within the study area. Although the cruises have been conducted within research projects aiming at different goals, all were collecting hydroacous-tic data. The cruises were carried out between 1995 and 2011 by the Research Vessel Atlˆantico Sul, property of the Federal Uni-versity of Rio Grande, and covered an area from the inner shelf to continental slope and adjacent oceanic region, totalling 15,367 navigated nautical miles within the study area (Table 1).
Acoustic data
In this study, bathymetric and bottom backscatter strength acous-tic data were used. The acousacous-tic system used was the same for all the cruises: a SIMRAD EK500 scientific echo sounder (SIM-RAD, 1996), calibrated using Tungsten Carbide sphere, accord-ing to the methodology described by Foote (1982) and modified by MacLennan & Simmonds (1992). The echo sounder operated coupled with two Split-beam hull mounted transducers transmit-ting on frequencies of 38 and 120 kHz, this study employing only the data from frequency of 38 kHz. Although they have a lower resolution compared to higher frequencies, low frequencies are more suitable for bathymetric and bottom backscatter studies, once they have greater reach and capability to penetrate the sub-strate, besides suffering less intensely the effects of attenuation (Mitson, 1983).
The parameters configured in the echo sounder remained constant during the cruises and the effects of spherical spread-ing (20 log R) and absorption (2αR), which attenuate the acous-tic signal during its propagation in the water column, were com-pensated by TVG (Time Varied Gain) function, according to the distance from the transducer to the wave front (R).
The relevant information to this study was taken from the universe of data collected by a computational filter developed specifically for EK500 echo sounder data. This filter eliminated data outside of the study area, as well as inconsistent data, such as obvious GPS or depth errors. The filtered final data set total-ized 5,249,191 acoustic readings.
3D bathymetric grid
The acoustic data used in this study were taken from acoustic fisheries surveys and from cruises to evaluate the distribution and abundance of cetacea. The spacing between transects on cruises of this nature is on average 20 nm, either due to sampling method-ology, budget constraints or time available for sampling. Further-more, when observing spatial distribution of the complete data set, heterogeneity in data density distribution is noted due to higher survey coverage in some regions (Fig. 1). Thus, the acoustic bathymetric data available for PB (Table 1),per se, are insufficient to generate a bathymetric grid with high resolution. To overcome this difficulty, bathymetric data measured indirectly by satellite al-timetry were integrated to the acoustic data, in order to comple-ment those areas on the map with little or no sample coverage. These data are public and are available at http://topex.ucsd.edu/. The bathymetric grid generated for this study has resolution of 30x30 second degree and was created from a dataset of 6,247,111 bathymetric data, comprising 5,249,191 from acoustic data by research surveys (Table 1) and 997,920 by satellite altimetry. This dataset was processed using the blockmedian and nearneighbor functions of the GMT (Generic Mapping Tools) package (GMT, 2013). The interpolation algorithm Continuous Curvature Splines with tension factor of 0.32 (Smith & Wessel, 1990; Hell & Jakobsson, 2011) was applied.
BSBS grid
The BSBS data were filtered from acoustic dataset by a computa-tional routine developed specifically for this study using MatLab. Positioning failures and BSBS data lower than –30 dB and greater than –5 dB were eliminated, according to methodology described by Figueiredo & Madureira (2004). Erroneous data, which were deleted, represented approximately 1% of the total data universe. From time to time, there was more than one BSBS reading for the same geographic position, because of the difference between rates of georeferencing signal produced by the vessel’s GPS and data collection by echo sounder, which is faster than the GPS. This instrumental difficulty was overcome during data process-ing by usprocess-ing a computational routine which identified positionprocess-ing repetitions in the data files and generated new files considering the average, the highest and lowest BSBS values of each of the repeated positions.
Due to the higher visual correspondence between BSBS maps generated with lowest values and sedimentological charts ana-lyzed, it was decided to use the lowest BSBS value to create bot-tom backscatter maps.
The BSBS filtrated data set totalized 1,839,535 acoustic read-ings applied as input to a processing routine developed with GMT package. The data were filtered to blocks of 2×2 minutes degree and interpolated by an algorithm Continuous Curvature Splines in Tension. The interpolated data were then classified into four classes of BSBS, represented by different colours, according to the methodology described by Figueiredo & Madureira (2004) and adopted by Cooke et al. (2007), Pinho et al. (2011) and Costa el al. (2013). According to Figueiredo & Madureira (2004), these classes can be associated with 10 different sediment classes (Table 2), defined according to Shepard’s triangular diagram (Shepard, 1954) modified by those authors.
The BSBS map generated was compared to others gener-ated for the same area, and with studies that regarded the surface sediment distribution of PB. In addition, it was compared to the mineral resources map of the Brazilian Juridical Continental Shelf Atlas, available from CPRM (Companhia de Pesquisa de Recursos Minerais/ Brazilian Geological Survey).
Moreover, the 3D maps produced were displayed in IVS Fledermaus Professional Edition Version 7.2.2c software (Fle-dermaus, 2010).
RESULTS Bathymetric map
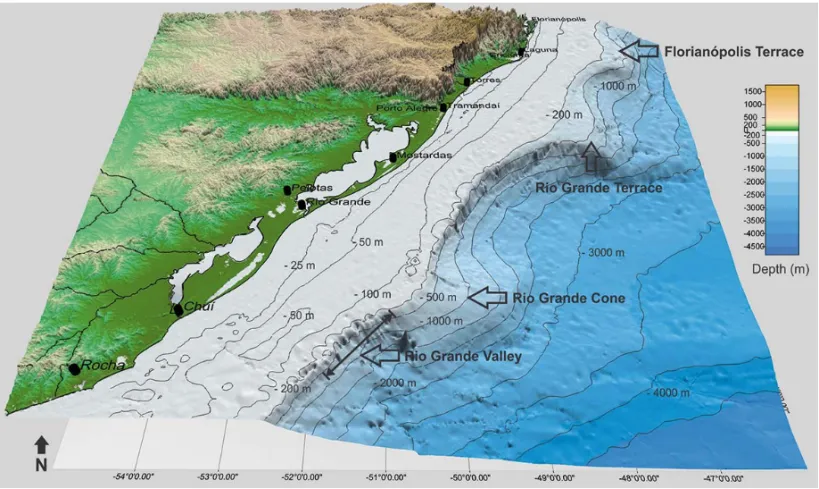
The bathymetric grid created includes regions of CS, slope and adjacent oceanic region of the PB and it was used as a basis to create an interactive 3D representation (Fig. 2). The bathymetric map illustrated has a resolution of 30×30 second degree (ap-proximately 926 m) and is represented by a thirty times vertical exaggeration to highlight main bottom features, which are: the Rio Grande Valleys and Rio Grande Cone at the southern end (Figs. 2 and 3), Rio Grande Terrace off Tramanda´ı-RS and the terrace off Florian´opolis (Figs. 2 and 4). The continent elevation data available with altimetry data were kept in this representation to facilitate the visual location of oceanic features.
BSBS map
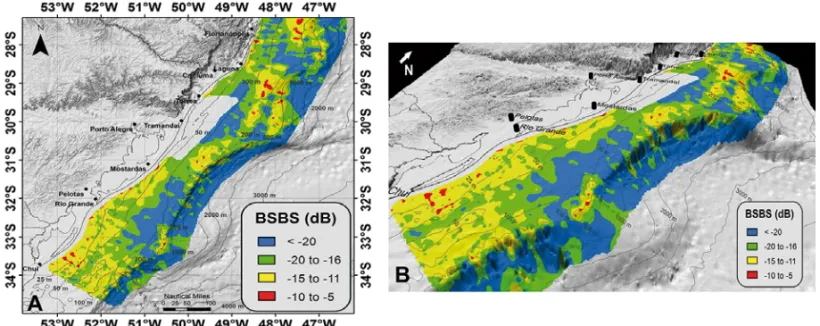
Figure 5A and 5B illustrate the BSBS map, overlaid on 3D bathy-metric map with thirty times vertical exaggeration. This map was generated from the interpolation of the acoustic data along the transects and was represented using the colour scale proposed by Figueiredo & Madureira (2004). The data in red represent high
Table 2 – BSBS classes defined by Figueiredo & Madureira (2004) and respective colours used on BSBS maps.
BSBS class Classification according to a modified Corresponding colors Sheppard’s Triangular Diagram on BSBS map –05 to –10 dB gravel, silt gravel, sandy gravel, Red
sand/silt/gravel, gravelly sand, sand
–10 to –15 dB gravelly silt, sandy silt, silty sand, sand Yellow –15 to –20 dB sandy silt, silt Green
<–20 dB silt Blue
Figure 2 – 3D bathymetric map overview, with thirty times vertical exaggeration, highlighting the main bottom features.
bottom acoustic backscatter, indicating hard bottoms, while data in blue represent low bottom acoustic backscatter, which on the other hand show soft bottoms. The yellow and green colours rep-resent bottoms with intermediate acoustic backscatter, according to Table 2.
DISCUSSION
The PB is an area of great economic and strategic importance due to its high mineral exploration potential and intense activ-ity of commercial fishery, historically established (Haimovici et al., 1989). It is known that sedimentary basins such as the PB possibly present petroleum and natural gas (USGS, 2001), and gas hydrate (Sad et al., 1998). However, this potential has not yet
been confirmed for the BP, in view of the scarceness of invest-ment on drilling in the area. In this context, the environinvest-mental assessment of this region is fundamental, not only for academic knowledge, but also for direct use by energy sector companies (oil and gas) and mining, which need supporting information for licensing steps and activity monitoring.
A bathymetric map of the PB was generated with resolu-tion of 30x30 second degree. From this map, it was possible to identify the main bottom features of the region, such as the Rio Grande Valley, the Rio Grande Cone, the Rio Grande Terrace off Tramanda´ı-RS and the terrace off Florian´opolis-SC. However, it should be noted that measurements with the gravimetric method, which originated altimetry data, exhibit considerable vertical un-certainty on the continental shelf and slope (Sandwell et al., 2002).
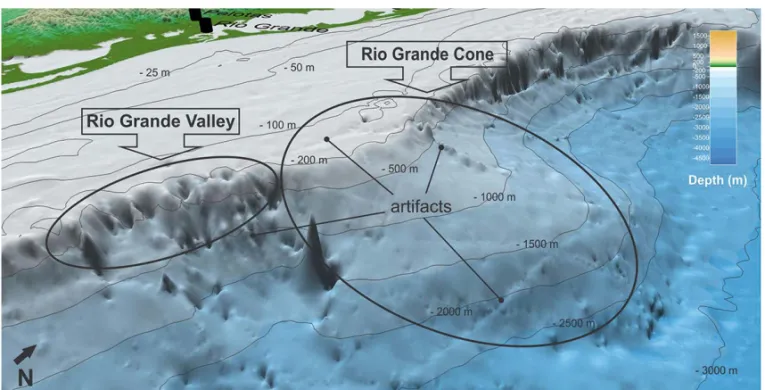
Figure 3 – Rio Grande Valley and Rio Grande Cone.
Figure 4 – Rio Grande Terrace and Florian´opolis Terrace.
According to the authors, this vertical uncertainty occurs due to the influence of coastal sediment and it has not yet been precisely quantified. In order to minimize this uncertainty, these authors incorporated bathymetric data obtained by occasional ships on the satellite altimetry. This correction eventually creates artifacts, which are minimized during the interpolation process, but they can persist, appearing on the maps in form of lines or cavities along ships tracks, as it can be seen in Figure 3, near the Rio Grande Valley and Rio Grande Cone region.
The seabed characterization is of fundamental importance for several activities related to offshore Oceanic Engineering, such as installation of platforms, equipment, ducts, etc. In this con-text, the bathymetric map generated in this study represents an increase in knowledge of bottom morphology at this region. Fur-thermore, the bathymetric grid produced represents also an im-portant contribution for environmental interpretation and dynam-ics modelling, since bathymetry has a strong influence over the displacement of water masses.
Figure 5 – Overview (A) and detail (B) of BSBS map generated for the PB.
Regarding the bottom acoustic backscattering, in general, as it can be noted in Figure 5, the PB region showed intermediate values of BSBS (between –10 dB and –20 dB), represented in yel-low and green in the map. Values yel-lower than –20 dB, indicative of unconsolidated bottoms, represented in blue in the map, pre-vailed in the slope and deep oceanic adjacent region. In shallower areas, unconsolidated bottoms were identified in three main re-gions: in CS off Rio Grande at a 50 m depth, between the latitudes of 28◦59’S 32◦54’S and at depths of 60 and 150 m, and south of the terrace off Florian´opolis, between 60 m and the shelf break (approximately 300 m). Some bottoms with BSBS values lower than –20 dB have also been identified in the area north of Santa Marta Cape (28◦35’S) between 50 and 100 m isobaths.
Bottoms with high BSBS (>–10 dB), represented in red in the maps, did not occupy large areas on the created BSBS map. From south to north (Fig. 5), there are some occurrences in the area around latitude 33◦30’S, on the inner shelf region and slope of the Chu´ı-RS region. The outer continental shelf presents other restricted occurrence of bottoms with higher BSBS, in the Rio Grande Cone region around the latitude of 33◦10’S. Northern areas with high values of BSBS were identified both around lat-itude 31◦S and near the Rio Grande Terrace, between 28◦53’S and 30◦05’S. At the northern end of the study area, at the San-tos Basin boundary, another area with high values of BSBS can be found between latitudes 27◦20’S and 28◦18’S, most evidently between 140 m and 200 m of depth, and less extensive in 500 m, in the terrace off Florian´opolis area. Some punctual occurrences have been verified in coastal areas, such as in the south of Flo-rian´opolis and in some points of the RS coast at depths ranging between 15 and 30 m.
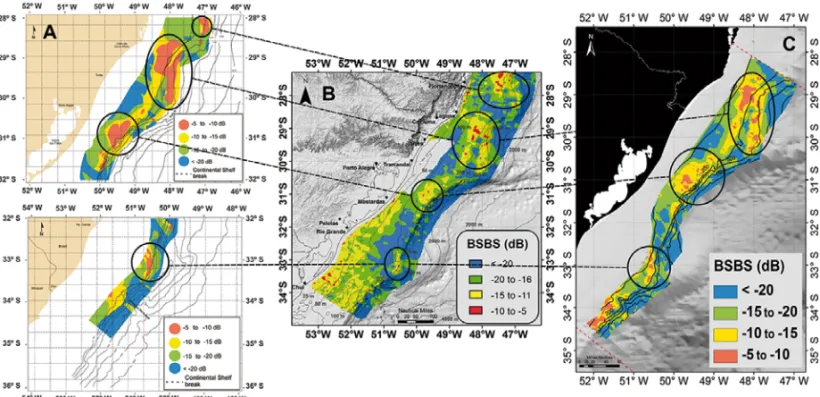
The BSBS map generated was compared with other studies carried out either wholly or partly in the PB. In Figure 6, the map of BSBS from this study (Fig. 6B) is compared with maps created by Figueiredo & Madureira (2004) (Fig. 6A) and Costa et al. (2013) (Fig. 6C). Figueiredo & Madureira (2004) used data from three cruises that covered the outer shelf and slope of the southeast and south region of Brazil, from Chu´ı-RS to Cabo Frio – RJ. In addition to these data, Costa et al. (2013) used other information from other three cruises carried out in slope of the same region, limited to PB area.
On the present study, the data used by Figueiredo & Madureira (2004) and Costa et al. (2013) were integrated with other data from a series of new cruises carried out wholly or partly on PB (Table 1). As it can be noted, the BSBS map presented on this work contains a significant increase in surveys quantity and, therefore, density of acoustic readings over regions already cov-ered by previous work. In addition, coverage was expanded to the internal CS of PB, except for the area between north of Mostardas-RS and Torres-Mostardas-RS (Fig. 1), for which there were no data available. On this study, unlike the previous ones when data were com-pletely used, it was decided to filter positioning repetitions (see Methodology item). This change, together with improved resolu-tion provided by higher data density in certain areas, imply in sig-nificantly different results of previous work, especially regarding the extension of areas with high BSBS identified in this work. How-ever, even with this methodological difference, this study iden-tified the same areas classified as high BSBS on the work of Figueiredo & Madureira (2004) and Costa et al. (2013) (Fig. 6), except for an area detected by Costa et al. (2013) in the south, near latitude 34◦S.
Figure 6 – BSBS map generated by Figueiredo & Madureira (2004) (A); BSBS map generated on this study (B); BSBS map generated by Costa et al. (2013) (C). Areas
with higher BSBS values are highlighted.
As it can be noted in Figure 6, areas with low values of BSBS identified in previous works in regions of slope and deep ocean are compatible with areas identified in this study.
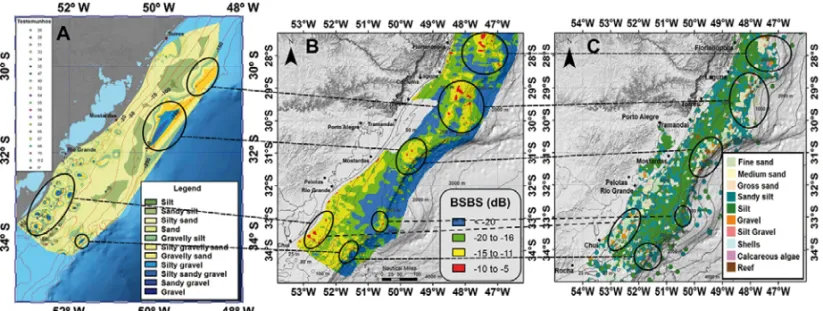
In Figure 7, the BSBS map generated in this study (Fig. 7B) is compared with the sedimentological chart of CS of RS supplied by the Laboratory of Geological Oceanography (LOG) of the In-stitute of Oceanography/FURG (Fig. 7A) and with the sedimen-tological chart generated by Dias et al. (2004) (Fig. 7C). Both studies counted with data generated from bottom sampling analy-sis carried out under the REVIZEE (Living Resources of Exclusive Economic Zone) and the REMPLAC (Mineral Resources of Con-tinental Shelf) projects. The LOG/FURG chart enhanced samples collected in most recent projects.
The sedimentological chart elaborated by LOG/FURG shows the predominance of sand in the CS of RS, with highest concentra-tions been found in the middle and inner shelf and from southern Mostardas-RS to Chu´ı-RS. However, it is also observed the pres-ence of considerable silt bodies in the middle and outer shelf.
This configuration of sedimentary distribution is consistent with the sedimentological chart generated by Dias et al. (2004). Although they have different methodologies to generate the inter-polated maps, the source of data used in the two studies is coin-cident (REVIZEE and REMPLAC).
At the southern end of the study area, near Chu´ı-RS, the sedi-mentological chart of LOG and also of Dias et al. (2004) indicates the presence of banks of coarse material, predominantly gravel,
which may be responsible for patches of BSBS higher values, identified in the bottom acoustic backscatter map. Even in the ex-treme south, near the slope, in the southern region of Rio Grande Valley, there is a little occurrence of higher BSBS values in the area with presence of coarser sediment, as shown in Figures 7A and 7C.
Both in the map produced by LOG-FURG and in Dias et al. (2004), the presence of coarse bottoms (gravel, sandy gravel, silt gravel and mollusc shells) is noted at height of latitude 31◦S. Figueiredo & Tessler (2004), who characterized seabed in terms of topography and seabed composition for effects in bottom fish-ing from Chu´ı-RS to Cabo Frio-RJ, classified that specific region as “an area not recommended for trawling” due to the presence of shell debris. In that area, the BSBS map generated for this work presents, in general, intermediate BSBS values (–10 dB to 15 dB) and some patches with highest BSBS (<10 dB). In previous works, Figueiredo & Madureira (2004) and Costa et al. (2013), that region presented higher bottom acoustic backscatter (Fig. 6). High BSBS values can also be observed in the area near the Rio Grande Terrace (∼29◦30’S), where there are bottoms made of gravel, silty gravel, gravelly sand and shells in the sedimentolog-ical charts analyzed. In the extreme north, off Florian´opolis, in an area not covered by the sedimentological chart of LOG-FURG, but with presence of coarse bottoms, according to Dias et al. (2004) chart, it was observed high BSBS values both in the results of this study and in the work by Figueiredo & Madureira (2004) and
Figure 7 – Sedimentological chart provided by LOG – IO/FURG (A); BSBS map generated on this study (B); Sedimentological chart generated by Dias et al. (2004)
(C). Areas with high BSBS, on regions with hard bottom are highlighted.
Costa et al. (2013) (Fig. 6). Figueiredo & Tessler (2004) classified that area as “Not recommended for trawling” due to the presence of shell debris.
In shallow areas on the RS coast, from Mostardas to the south of Rio Grande and also in Santa Catarina, in the south of Florian´opolis, where the sedimentological charts indicate muddy bottoms, the punctual occurrences of high BSBS values can be explained probably by the existence of a hard sub-bottom. It is possible that due to the narrow depth, the 38 kHz acoustic sig-nal has penetrated the surface layer of muddy sediments, there-fore detecting not the superficial layer, but a sub-surface layer on which this sediment might be seated. According to previous studies (Buchmann, 2002; Martins et al., 2004; Goulart, 2010), there is evidence of ancient substrates of beach rocks in the region south of Mostardas. In Figure 8, the BSBS map generated on this study (Fig. 8A) is compared with the map of mineral resources of APCJB (Fig. 8B) provided by CPRM.
In Figure 8, it is observed a considerable overlap between areas of high BSBS identified in the external CS and slope off Mostardas (∼31◦S), over the Rio Grande Terrace and off Florian´opolis and areas identified by CPRM containing calcare-ous deposits and phosphorite (P2O5).
Both phosphorite and calcareous are high economic value re-sources, mainly due to their importance as agricultural inputs. Klein et al. (1992) reported the occurrence of phosphatic nodules between depths of 100 and 500 m in the Rio Grande Terrace. In the same region, Silva & Mello (2005) indicated the presence of phosphate deposits with a concentration of 15-16% P2O5. Cooke
et al. (2007) and Pinho et al. (2011) suggested the presence of phosphatic deposits in the Rio Grande Terrace region based on
echograms and high BSBS values. Figure 9 illustrates an acous-tic profile carried out in the region of the Rio Grande Terrace in one of the analyzed surveys. The figure shows that this profile has high BSBS and was carried out over an area containing phospho-rite and calcareous according to the APCJB.
This study and the others described above illustrate the effec-tiveness of using the acoustic method for identification and map-ping of different bottom types. However, it is necessary to improve the use of acoustic method and processing methods in order to obtain maps generated with acoustic information associated with real bottom information.
CONCLUSION
From three-dimensional visualization of the bathymetric map generated in this work, it was possible to identify the main bot-tom features of the PB, such as the Rio Grande Valleys and Rio Grande Cone in the extreme south, the Rio Grande Terrace off Tramanda´ı-RS and the terrace off Florian´opolis. The bottom acoustic backscatter map enabled the identification of areas with high BSBS values, which confirmed previous works carried out in the same area. Although bottoms with high acoustic backscat-ter (>–10 dB) have not occupied broad sectors, the comparison between the BSBS map and the sedimentological charts of the re-gion enabled the identification of areas with a considerable rela-tion between acoustic signals and bottom type. It was possible to detect not only areas with high BSBS values over bottoms consid-ered hard, such as gravel, sandy gravel, silty gravel and shells but also areas with lower BSBS values over bottoms considered soft as silt and sandy silt. Moreover, the BSBS maps were compared with maps of mineral resources with high economic and strategic
Figure 8 – BSBS map generated on this study (A); Map of mineral resources of APCJB, provided by CPRM (B) Correspondence among areas
with high BSBS in regions containing interesting mineral resources are highlighted.
Figure 9 – On the left, the BSBS map (A) and mineral resources (B) highlighting transect (black arrow) carried out on the Rio Grande Terrace in the area with possible
presence of phosphorite and calcareous. The arrow indicates the vessel navigation direction; on the right, bathymetric and BSBS profile reconstructed from acoustic data. The sections I and II of the profile, are shown in detail (C).
importance, such as calcareous and phosphorite. These areas are significantly close or even coincident with areas of high acoustic backscatter identified on this work, such as the Rio Grande Terrace area and the terrace off Florian´opolis.
The availability of integrated bathymetric and BSBS informa-tion, together with the sedimentological information and the pres-ence of non-renewable resources of the PB, enabled the identifi-cation of areas that can be regarded as priority and which, after
deeper studies, may turn out to be potential areas for exploitation of non-renewable resources in this region.
The bottom morphological characterization carried out in this research, associated with other studies aiming at the environmen-tal and biological characterization of the PB, may subsidy future policies related to ecological and economic zoning of the area. The identification of areas of high strategic importance and eco-nomic relevance, in view of the mineral resources presence, is fundamental, not only because of the exploratory potential of those areas, but also because of possible conflicts of co-occurrence of activities which may exist in the future, since PB is a region of intense activity of commercial fisheries.
ACKNOWLEDGEMENTS
The authors thank Prof. Dr. Eduardo Secchi, coordinator of the Laboratory of Ecology of Marine Megafauna of Oceanography Institute of Universidade Federal do Rio Grande (IO/FURG) for providing data from the Slope Surveys; LOG IO/FURG for provid-ing the sedimentological charts used in this work; Capt. Homero Poujeaux Alvariza and the entire crew of the Atlˆantico Sul Re-search Vessel, for the promptness, efficiency and professional-ism during the research cruises; the entire team of the Labora-tory of Fisheries Technology and Hydroacoustics IO/FURG; Petro-bras and the Agˆencia Nacional do Petr´oleo, G´as Natural e Bio-combust´ıveis (ANP) and the Human Resources Program (PRH) 27 FURG for the PhD scholarship to the first author.
REFERENCES
ANDERSON JT, GREGORY RS & COLLINS WT. 2002. Acoustic classi-fication of marine habitats in coastal Newfoundland. ICES J. Mar. Sci., 59(1): 156–167.
ANDERSON JT, HOLLIDAY DV, KLOSER R, REID DG & SIMARD Y. 2008. Acoustic seabed classification: current practice and future direc-tions. ICES J. Mar. Sci., 65: 1004–1011.
BUCHMANN FSC. 2002. Bioclastos de organismos terrestres e mari-nhos na praia e plataforma interna do Rio Grande do Sul: natureza, distribuic¸˜ao, origem e significado geol´ogico. Doctorate Thesis – P´os-Graduac¸˜ao em Geociˆencias, Universidade Federal do Rio Grande do Sul, Brazil, 2002. 108 pp.
CALLIARI LJ & ABREU JGN. 1984. Litologia da plataforma continental interna adjacente `a cidade de Rio Grande (RS), atrav´es da interpretac¸˜ao de registros de sonar de varredura lateral e amostragem superficial. In: XXXIII Congresso Brasileiro de Geologia, Rio de Janeiro. Anais: 1553– 1564.
CALLIARI LJ, ESTEVES LS, OLIVEIRA CPL, TOZZI HAM, SILVA RP & CARDOSO JN. 1994. Padr˜oes sonogr´aficos e sedimentol´ogicos de um
afloramento de beach rock na plataforma interna do Rio Grande do Sul (COMEMIR/OSNLR). Notas T´ecnicas, Porto Alegre, CECO/UFRGS, 7: 27–32.
CAMPOS PC, WEIGERT SC & MADUREIRA LSP. 2009. Mapeamento hidroac´ustico do leito oceˆanico na regi˜ao do canal do Albard˜ao, RS, Brasil. Atlˆantica, Rio Grande, 31(1): 5–23.
COLLINS W, GREGORY RE & ANDERSON J. 1996. A Digital Approach to Seabed Classification. Sea Technol., 37(8): 83–87.
COOKE CV, MADUREIRA LSP, GRIEP GH & PINHO MP. 2007. An´alise de dados de ecossondagemde fundo oriundos de cruzeiros realizados entre Fortaleza (CE) e Chu´ı (RS) com enfoque na morfologia e tipos de fundo. Brazilian Journal of Geophysics, 25(4): 443–457.
CORRˆEA ICS. 1987. Sedimentos superficiais da plataforma e talude continental do Rio Grande do Sul. Pesquisas, Instituto de Geociˆencias, UFRGS, 19: 95–104.
COSTA PL, MADUREIRA LASP & PINHO MP. 2013. Seabed acous-tic classification in the Pelotas basin, Brazil. Braz. J. Oceanogr., 61(1): 13–22.
DIAS JL, SILVEIRA DP, SAD ARE & LATG´E MAL. 1994. Bacia de Pelotas: Est´agio atual do conhecimento geol´ogico. Bol. Geociˆenc. Petrobras, 8(1): 235–245.
DIAS GTM, ROBRINI EL, FREIRE GSF & FIGUEIREDO JR AG. 2004. Cartas de Sedimento de Fundo. ´Areas da Oceanografia Geol´ogica (Sul, Central, Nordeste e Norte) – Programa de Avaliac¸˜ao do Potencial Sus-tent´avel dos recursos vivos na Zona Econˆomica Exclusiva. S´erie Docu-mentos T´ecnicos do Programa REVIZEE Score-Sul. S˜ao Paulo, Instituto Oceanogr´afico – USP, Brazil, 2004.
DIERSSEN HM & THEBERGE JR AE. 2011. Bathymetry: Assessing Meth-ods. Encyclopedia of Natural Resources, 25 pp.
FIGUEIREDO JR AG & KOWSMANN RO. 1976. Interpretac¸˜ao dos regis-tros de sonar de varredura lateral obtidos na plataforma sul-riogranden-se durante a Operac¸˜ao GEOMAR VII. In: CPRM, Relat´orio Interno da CPRM. Projeto REMAC. Rio de Janeiro, Brazil. 9 pp.
FIGUEIREDO JR AG & MADUREIRA LSP. 2004. Topografia, composic¸˜ao, refletividade do substrato marinho e identificac¸˜ao de prov´ıncias sedi-mentares na Regi˜ao Sudeste-Sul do Brasil. S´erie Documentos T´ecnicos do Programa REVIZEE Score-Sul, S˜ao Paulo, Instituto Oceanogr´afico-USP, Brazil, 2004. 64 pp.
FIGUEIREDO JR AG & TESSLER MG. 2004. Topografia e composic¸˜ao do substrato marinho da regi˜ao Sudeste-Sul do Brasil. S´erie Documen-tos T´ecnicos do Programa REVIZEE Score-Sul, S˜ao Paulo: Instituto Oceanogr´afico-USP, Brazil, 2004. 64 pp.
FLEDERMAUS, 2010. Reference Manual. Fredericton, New Brunswick, Canada, 387 pp.
FOOTE KG. 1982. Optimizing copper spheres for precision calibration of hydroacoustic equipment. J. Acoust. Soc. Am., 22(44): 151–156.
GILLE ST, METZGER EJ & TOKMAKIAN R. 2004. Seafloor Topogra-phy and Ocean Circulation. In: Special Issue – Bathymetry from space. Oceanography, 17(1): 47–54.
GMT – The Generic Mapping Tools. 2013. Available on: <http://gmt. soest.hawaii.edu/home>. Access on: May 2013.
GORDON A. 1981. South Atlantic thermohaline ventilation. Deep Sea Res., 28A(11): 1238–1264.
GOULART ES. 2010. Morfodinˆamica da antepraia adjacente ao Farol da Conceic¸˜ao: litoral m´edio do RS. Master Dissertation, Programa de P´os-Graduac¸˜ao em Oceanografia Qu´ımica, F´ısica e Geol´ogica da Universi-dade Federal do Rio Grande, Brazil, 2010. 89 pp.
HALL J. 2006. GEBCO centennial special issue charting the secret world of the ocean floor: the GEBCO project 19032003. Mar. Geophys. Res., 27(1): 1–5.
HAIMOVICI M, PEREIRA SD & VIEIRA PC. 1989. La pesca demersal en el sur del Brasil en el periodo 1975-1985. Frente Maritimo, 5(A): 151–163. HELL B & JAKOBSSON M. 2011. Gridding heterogeneous bathymetric data sets with stacked continuous curvature splines in tension. Mar. Geo-phys. Res., 32: 493–501.
HELL B, BROMAN B, JAKOBSSON L, JAKOBSSON M, MAGNUSSON A & WIBERG P. 2012. The Use of Bathymetric Data in Society and Science: A Review from the Baltic Sea. Ambio, 41: 138–150.
KLEIN AHF, GRIEP GH, CALLIARI JL & VILLWOCK JA. 1992. Ocorrˆencias de Concrec¸˜oes Fosf´aticas no Terrac¸o de Rio Grande. In: Congresso Brasileiro de Geologia, 37., 1992, Cambori´u/SC, Brazil, Resumos Ex-pandidos: 202–203.
KOSLOW JA. 1997. Seamounts and the ecology of deep-sea fisheries. Am. Sci., 85(2): 168–176.
KUNZE E & LLEWELLYN SMITH SG. 2004. The role of small-scale to-pography in turbulent mixing of the global ocean. Oceanography, 17: 55.
MacLENNAN DN & SIMMONDS EJ. 1992. Fisheries Acoustics. Fish and Fisheries. Series 5., Chapman & Hall, London, 325 pp.
MARTINS LR & MARTINS IR. 2004. Presenc¸a de Turfa na Plataforma Continental do Rio Grande do Sul. Gravel, 1(2): 77–85.
MITSON RB. 1983. Fisheries sonar. Fishing News Books, Farnham, England, 287 pp.
MUNK W & WUNSCH C. 1998. Abyssal recipes II: Energetics of tidal and wind mixing. Deep-Sea Res. Pt I, 45: 1977–2010.
PINHO MP, MADUREIRA LASP, CALLIARI LJ, GRIEP GH & COOKE CV. 2011. Dep´ositos fosf´aticos marinhos na costa sudeste e sul do Brasil: potenciais ´areas de ocorrˆencia identificadas com dados de retroespa-lhamento ac´ustico do fundo e sedimentol´ogicos analisados sobre mapa batim´etrico 3D. Brazilian Journal of Geophysics, 29(1): 113–126. PIOLA AR, CAMPOS EJD, M ¨OLLER JR OO, CHARO M & MARTINEZ CM. 2000. Subtropical shelf front off eastern South America. J. Geo-phys. Res., 105 (C3): 6566–6578.
SAD ARE, SILVEIRA DP, SILVA SRP, MACIEL R & MACHADO MA. 1998. Marine gas hydrates along the Brazilian margin. In: AAPG International Conference and Exhibition, Rio Janeiro, Brazil, 146–147.
SANDWELL DT, GILLE, ST & SMITH WHF. 2002. Bathymetry from Space: Oceanography, Geophysics, and Climate, Geoscience Profes-sional Services. In: Bathymetry from Space Workshop, Bethesda, Mary-land, 2002, 24 pp.
SHEPARD FP. 1954. Nomenclature based on sand-silt-clayratios. J. Sediment. Petrol., 24(3): 151–158.
SILVA CG & MELLO SLM. 2005. Nossasriquezas no mar: Recursos n˜ao-vivos. In: O mar no espac¸o geogr´afico brasileiro. Explorando o ensino. Minist´erio da Educac¸˜ao, Secretaria da Educac¸˜ao B´asica. vol. 8, cap. 5, 160–178.
SIMRAD. 1996. Simrad EK500: Fishery research echo sounder. Instruc-tion Manual (Operator manual). 232 pp.
SMITH WHF & WESSEL P. 1990. Gridding with continuous curvature splines in tension. Geophys., 55(3): 293–305.
SOARES I & M ¨OLLER JO. 2001. Low-frequency currents and water mass spatial distribution on the southern Brazilian shelf. Cont. Shelf Res., 21: 1785–1814.
TEGOWSKI J. 2005. Acoustical classification of bottom sediments in southern Baltic Sea. Quatern. Int., 130: 153–161.
USGS. 2001. Estimativas de Poss´ıveis Recursos de Petr´oleo e G´as na Am´erica Central e na Am´erica do Sul. U.S. Department of the Interior, U.S. Geological Survey, USGS Fact Sheet FS-039-01.
VOGT PR, JUNG WY & NAGEL DJ. 2000. GOMaP: a matchless resolution to start the new millennium. EOS Trans., 81(23): 254–258.
ZEMBRUSCKI, SG. 1979. Geomorfologia da Margem Continental Sul Brasileira e das Bacias Oceˆanicas Adjacentes. In: Geomorfologia da margem continental brasileira e das ´areas oceˆanicas adjacentes. Rela-t´orio final, Projeto REMAC, 177 pp.
Recebido em 21 janeiro, 2015 / Aceito em 17 setembro, 2015 Received on January 21, 2015 / Accepted on September 17, 2015