ADVANCES IN
FOOD TECHNOLOGY AND NUTRITIONAL SCIENCES
PUBLISHERS Open Journal
Lipid Oxidation Inhibition by Natural Tocopherols
Increases the Nutritional Value of Tuna Salami
Rita Sousa, MSc; Rui Pedrosa, PhD; Maria M. Gil, PhD*
MARE - Marine and Environmental Sciences Centre, ESTM, Instituto Politécnico de Leiria, Campus 4, Santuário Nossa Senhora dos Remédios, Apartado 126, 2520-641 Peniche, Portugal
Original Research
*Corresponding author Maria M. Gil, PhD
MARE – Marine and Environmental Sciences Centre, ESTM, Instituto Politécnico de Leiria Campus 4, Santuário Nossa Senhora dos Remédios, Apartado 126, 2520-641, Peniche, Portugal; E-mail: [email protected]
Article information
Received: February 18th, 2018; Revised: March 23rd, 2018; Accepted: March 26th, 2018; Published: March 27th, 2018
Cite this article
Sousa R, Pedrosa R, Gil MM. Lipid oxidation inhibition by natural tocopherols increases the nutritional value of tuna salami. Adv Food Technol Nutr Sci Open J. 2018; 4(1): 4-9. doi: 10.17140/AFTNSOJ-4-146
ABSTRACT
Copyright 2018 by Gil MM. This is an open-access article distributed under Creative Commons Attribution 4.0 International License (CC BY 4.0), which allows to copy, redistribute, remix, transform, and reproduce in any medium or format, even commercially, provided the original work is properly cited.
cc
Introduction
The quality attributes of fish products deteriorate due to the lipid oxidation during processing and storage. Tuna salami is highly susceptible to oxidation, which can precipitate health hazards and economic losses in terms of inferior product quality.
Methods
The effect of adding different natural antioxidants on the lipid oxidation, colour and fatty acid profile of tuna salami after nine days of storage at 4 ºC was assessed. Three different commercial mixes of tocopherols were added during the production of the tuna salami and samples were sliced and refrigerated for 9 days.
Results
The lipid oxidation increased from 0.98 to 4.03 mg of malondialdehyde/kg. The oxidation process was inhibited by DLT-100 and VIT-100; however, RNX10 did not blunt the oxidative process. VIT and dose-limiting toxicity (DLT) reduced the total
unsatu-rated fatty acid reduction. The RNX did not prevent the reduction of the a* value.
Conclusion
It was concluded that tocopherols supplementation kept the nutritional value of tuna salami mainly by lipid oxidation inhibition. Keywords
Tuna salami; Fatty acids profile; Thiobarbituric acid-reactive substances (TBARS); Antioxidants; Colour changes. Abbreviations
DLT: Dose-Limiting Toxicity; TBARS: Thiobarbituric Acid-Reactive Substances; PUFA: Polyunsaturated Fatty Acids; MDA: Malondialdehyde; ROS: Reactive Oxygen Species; FAME: Fatty Acid Methyl Esters; GC: Gas Chromatography; HPLC: High-Performance Liquid Chromatography; ANOVA: One-Way Analysis of Variance.
INTRODUCTION
T
una salami is a new food product developed by a smallPortu-guese food producer “Conservas Dâmaso” (Vila Real de Santo
António, Algarve). This product is a type of dry sausage made from tuna meat that is ground up and mixed with oil and spices. Tuna salami is normally sliced thinly when served and often used for sandwich filling (salami sandwich), for pizza toppings and for viand as well. Nowadays, there is a growing interest in tuna
prod-ucts due to the beneficial effects on human health, because of its high polyunsaturated fatty acids (PUFA) content. However, food products with high content of PUFA are highly susceptible to lipid
oxidation and therefore the shelf-life of these products are short.1,2
Therefore, the reduction of lipid oxidation during storage has been of major importance to the food process industries.
Lipid oxidation encompasses a series of reactions be-tween oxygen and unsaturated lipids to form lipid peroxides, often
readily identified by sensory changes, such as generation of
off-fla-vour and off-odours.2-4 This oxidative spoilage releases secondary
products. Malondialdehyde (MDA) is one of the most important products of oxidation that can be followed as a marker of lipid
oxidation.1,5 Simultaneously, heme-pigments (myoglobin and
hae-moglobin) also oxidize in a coupled lipid-pigment reaction.6 The
myoglobin is a globular heme protein localised in red muscle fibres
and the major giver to the colour of muscle.7-11 Changes in fish
co-lour are usually influenced by intrinsic factors such as muscle pH, redox potential, metmyoglobin reductase activity, oxygen-consum-ing reactions, and susceptibility to lipid oxidation. However, as ex-trinsic factors such as light exposure and storage temperature also produce changes in the fish colour. Therefore, colour changes are also an important factor that influences quality and acceptability by the consumers of tuna products (colour quality attribute strongly influences consumers’ preferences). In order to quantify colour changes objectively, the visual observing components needed to
be taken into account are the object, light, and the observer.12
Co-lour can be measured by a tristimulus colorimeter, represented by three coordinates in the colour scale. The L parameter represents
lightness (L=0 black; L=100 white), a* (red to green) and b* (blue
to yellow).12-14
Vacuum packages are normally used in this type of fish food products in order to prevent lipid oxidation and colour changes and consequently increase the products’ shelf-life. How-ever, once the package is opened, the contact with the oxygen trig-gers immediately the lipid oxidation process. The lipid oxidation of fatty acids like omega-3 can be reduced by adding natural or synthetic antioxidants. This process extends the products’ shelf-life
and moreover enhancing the health benefits of food products.2
Vi-tamin E can be found naturally in some foods, which can be added to others and is available as a dietary supplement. Vitamin E is the collective name for a group of fat-soluble compounds with distinc-tive antioxidant activities, the tocopherols, that stops the produc-tion of reactive oxygen species (ROS) formed when fat undergoes
oxidation.15
The aim of this work was to study the effect of adding different natural antioxidants (tocopherols mix with and without rosemary extract) on the lipid oxidation and colour changes of tuna salamis during nine days at 4 ºC exposure to the air (real situation at consumers home).
MATERIALS AND METHODS Antioxidants and Tuna Salami
Tuna salami was supplied by Conservas Dâmaso. Three different
commercial mixes of tocopherols were added during the produc-tion of the tuna salami: DLT-100 (100 mg of tocopherols/100 g of sample) and VIT-100 (100 mg of tocopherols/100 g of sam-ple), from different suppliers (not identified) and RNX 10 (10 mg of tocopherols+3.89 rosemary extract/100 g of sample). The supplier provided one lot of each DLT, VIT and RNX samples. Tuna salami samples were sliced (thickness=2 mm) and stored in a refrigerator (4 °C) and unpacked (forcing the oxidation process and simulating the consumer’s utilization) and analysed. Tuna
sa-lami without antioxidant was used as a control sample. Chemical Composition
Tuna salami samples were analysed for fatty acid composition, thiobarbituric acid-reactive substances (TBARS) and colour. All measurements were performed in triplicate and samples were ob-tained from cross sections of full-size salami.
Fatty acid composition determination: Fatty acid methyl esters (FAME) of tuna salami were performed according to Lepage &
Roy.16 300 mg tuna salami were homogenised with 5 mL acetyl
chloride-methanol mix (98% acetyl chloride, Acros; methanol,
Pan-reac) for 30 seconds and placed in a water bath at 80 ºC for 1 h and
cooled to room temperature. Then, 1 mL of water for
high-perfor-mance liquid chromatography (HPLC) (Fisher Scientific) and 2 mL
of n-heptane (Fluka) were added and samples were homogenised
for 1 minute and centrifuged at 1500 g for 5 minutes. All samples were analysed in gas chromatography (GC) (Finnigan Trace GC Ultra, Thermo Electron Corporation, Waltham, MA, USA). TBARS determination: The TBARS values in tuna salami were
determined according to the procedure described by Vyncke,17
Lemon,18 Robles-Martinez19 with slight modifications. Fifteen
grams of tuna salami were mixed with 30 mL of 75% trichloro-acetic acid solution (TCA with propyl 3,4,5-trihydroxybenzoate,
Merck), trichloroacetic acid (Schlarlau), ethylenediaminetetraacetic
acid (EDTA, Panreac) for 2 minutes in homogeniser; sample was
then transferred to an Erlenmeyer by filter (Whatman n.º1) and
cen-trifuged at 2000 rpm for 5 min. The extract of this solution was re-moved into 1-5 mL and fixed volume until 5 mL of the 75% TCA solution; adding 5 mL of TBA reagent (4,6-dihydroxy-2-mercapto
pyrimidine, Acros) and maintained in boiling water bath for 40
min. The calibration curve was determined by same proportions and reagents. The sample was replaced by the standard
1,1,3,3-tet-raethoxypropane (TEP, Acros). Finally, absorbance was read at
530 nm in a spectrophotometer (Heλios α, Thermo Electron Cor-poration, Waltham, MA, USA). The results were expressed as mil-ligrams of MDA per kg of product. For each assay were used three different samples of tuna salami with triplicate measures.
Colour measurement: Colour was evaluated in terms
of L*, a* and b* values using a tristimulus colorimeter (Chroma Met
er CR-400, Konica Minolta, Inc., Ramsey, NJ, USA). Measurements were performed in the Commission Internationale de l݃clairage
(CIE) L*, a*, b* system, using illuminant D65 and 2º observer. The
colorimeter was calibrated against standard white tile (L* 95.37;
a* 13.10 and b* 7.94). The colour behaviour of tuna salami was
described for L*, a* and b* values. Measurements were taken in
triplicates with ten readings each (ten slices of each salami were measured at three distinct positions on each slice).
Statistical Analysis
One-way analysis of variance (ANOVA) was used to analyse data among samples, followed by Dunnett test (when applicable) to discriminate significant differences between samples and controls. These analyses were performed using GraphPad Prism 5 for
Win-dows. Results are presented as mean±standard error of the mean
(SEM). The significance level was inferred at p<0.05 for all
statisti-cal tests.
RESULTS AND DISCUSSION
Secondary oxidation products are a suitable index of lipid oxida-tion due to the fact that they are odour-active and stable compou-nds, in comparison with primary products (hydroperoxides) which
are colourless, flavourless, and usually labile compounds.20 One of
the most extensively employed methods to detect oxidative dete-rioration in foodstuffs is the TBA test. This procedure is based on the formation of MDA), during the autoxidation of PUFAs, followed by reaction with TBA to form a pink complex that is
measured spectrophotometrically.21,22 The extent of oxidation is
stated as the TBA value and is reported as milligrams of MDA equivalents per kilogram of sample or as micromoles of MDA equivalents per gram of sample. Nevertheless, TBA is not selective to MDA and can also react with many other compounds such as aldehydes, carbohydrates, amino acids and nucleic acids leading to overestimation and variability in the results attained by the TBA
method.23 For this reason, this method is also known as
thiobarbi-turic acid reactive substances (TBARS) test. The oxidative stability of vacuum packaged tuna salamis was evaluated during 60 days at room temperature and exposure to artificial light. Non-significant
differences (p>0.05) in TBARS levels were found during the
stor-age time of samples, showing an oxidative stability of packstor-aged tuna salami (data not shown). This all agree with the view that the vacuum packages prevent the lipid oxidation of this type of food product. Moreover, no significant differences were obtained for pH and moisture content of the samples during the storage time (data not shown).
To study the effect of adding different natural antioxi-dants on the lipid oxidation mimicking the consumer’s use, tuna salami samples were sliced and refrigerated unpacked (4 ºC)
dur-ing those 9 days.
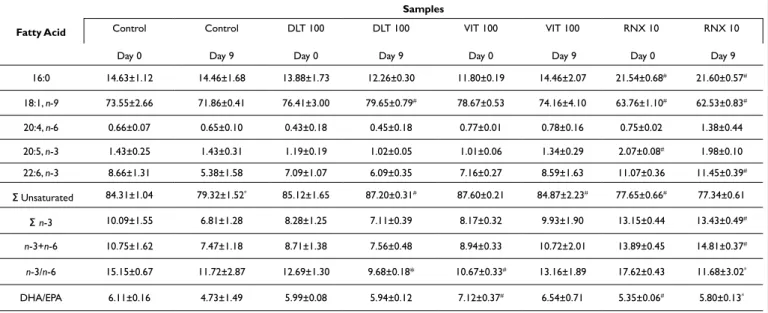
The fatty acid composition of tuna salami slices for days 0 and 9 is shown in Table 1. Fatty acids composition is strongly influ-enced by the fat quality used during the food processing and may vary during products storage. Additionally, adding antioxidants can also influence the initial fatty acid composition. In this study, supplementation of tuna salami with DTL-100 and VIT-100, gen-erally did not affect the fatty acid composition, when compared
to control for day 0 (p>0.05). Interestingly, RNX10 characteristics
resulted in a low C18:1, n-9 fatty acid content for both days 0 and 9, when compared to control, DLT-100 and VIT-100 (Table 1).
The fatty acid profile is also highly marked by the pres-ence of monounsaturated fatty acid (MUFA). Oleic acid (18:1) is one of the most abundant MUFA and frequently abundant in this type of product. Comparatively to the control, DTL-100 showed an increase in oleic acid content, from 71.86% to 79.65% with the
statistically significant difference (p<0.05) for day 9, meaning that
DLT-100 can prevent lipid oxidation. Similarly, C22:6, n-3 pre-sented higher values for day 9 for samples treated with DLT-100 (6.09%) but also for RNX10 (11.45%). Furthermore, control sam-ples showed the highest unsaturated fatty acids content variation
(p<0.05) when compared with the samples supplemented,
reveal-ing the importance of the addition of antioxidants to prevent their oxidation. Besides this, no significant differences were found for lipid content between days 0 and 9. Nevertheless, one can be con-cluded differently that commercial mixes of tocopherols, can lead to different antioxidant activity.
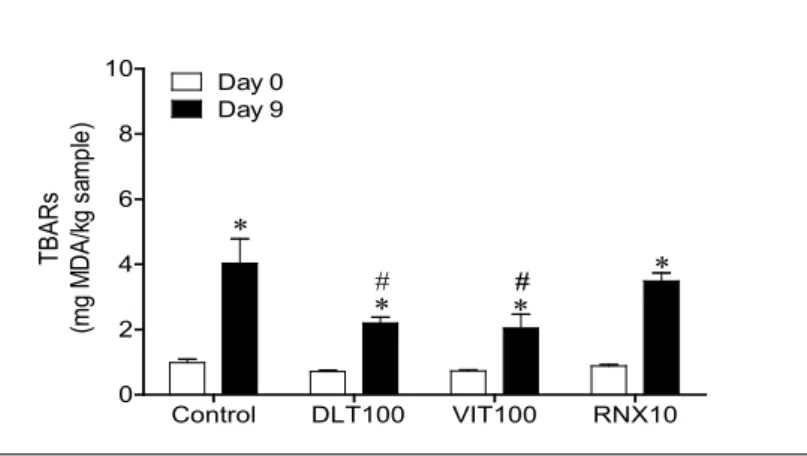
As mentioned before, TBARS assay is one of the most widely used indices of food quality as a critical index in lipid oxida-tion. Figure 1 presents the TBARS values of sliced tuna salami in the absence or in the presence of three different commercial mixes of tocopherols. Results showed clearly that lipid oxidation occurs during the storage time in tuna sausages products as observed in Table 1. Fatty Acid Composition (% of Total Fat) of Slices of Tuna Salami (Day 0 and Day 9; Stored at 4 ºC) in the Absence or in the Presence of Three Different Commercial Mixes of
Tocopherols, DLT-100 (100 mg of Tocopherols/100 g Sample), VIT-100 (100 mg of Tocopherols/100 g of Sample), RNX10 (10 mg of Tocopherols+3.89 Rosemary Extract/100 g of Sample)
Fatty Acid Samples Control Day 0 Control Day 9 DLT 100 Day 0 DLT 100 Day 9 VIT 100 Day 0 VIT 100 Day 9 RNX 10 Day 0 RNX 10 Day 9 16:0 14.63±1.12 14.46±1.68 13.88±1.73 12.26±0.30 11.80±0.19 14.46±2.07 21.54±0.68# 21.60±0.57# 18:1, n-9 73.55±2.66 71.86±0.41 76.41±3.00 79.65±0.79# 78.67±0.53 74.16±4.10 63.76±1.10# 62.53±0.83# 20:4, n-6 0.66±0.07 0.65±0.10 0.43±0.18 0.45±0.18 0.77±0.01 0.78±0.16 0.75±0.02 1.38±0.44 20:5, n-3 1.43±0.25 1.43±0.31 1.19±0.19 1.02±0.05 1.01±0.06 1.34±0.29 2.07±0.08# 1.98±0.10 22:6, n-3 8.66±1.31 5.38±1.58 7.09±1.07 6.09±0.35 7.16±0.27 8.59±1.63 11.07±0.36 11.45±0.39# � Unsaturated 84.31±1.04 79.32±1.52* 85.12±1.65 87.20±0.31# 87.60±0.21 84.87±2.23# 77.65±0.66# 77.34±0.61 � n-3 10.09±1.55 6.81±1.28 8.28±1.25 7.11±0.39 8.17±0.32 9.93±1.90 13.15±0.44 13.43±0.49# n-3+n-6 10.75±1.62 7.47±1.18 8.71±1.38 7.56±0.48 8.94±0.33 10.72±2.01 13.89±0.45 14.81±0.37# n-3/n-6 15.15±0.67 11.72±2.87 12.69±1.30 9.68±0.18* 10.67±0.33# 13.16±1.89 17.62±0.43 11.68±3.02* DHA/EPA 6.11±0.16 4.73±1.49 5.99±0.08 5.94±0.12 7.12±0.37# 6.54±0.71 5.35±0.06# 5.80±0.13*
control. In this study, all samples (at time zero) showed lower values of TBA than the proposed limits (5 mg of malonaldehyde equivalents kg-1 of tissue). The level of lipid oxidation of freshly caught fish is typically between 3 and 5 mg of MDA equivalents
per kilogram flesh.2 However, according to Fernández &
Rodrí-guez,24 these values are insufficient for the sensorial detection of
rancidity.21 It was also observed that, TBA greatly increased
dur-ing the 9 days of storage in all samples (p< 0.05) (Figure 1). These
results indicated that, although the tocopherols should reduce lipid oxidation supplementation was not enough. Nevertheless, samples treated with VIT-100 and DLT-100 antioxidants present lower level of lipid oxidation than control on day 9 (lower level of TBARS – 2.1969 and 2.0441 for DLT-100 and VIT-100, respec-tively). Previous studies have found that Rosemary extracts present efficient antioxidant activity. Besides this, in the present work, for tuna salami supplemented it seemed that the prevention of lipid oxidation was not increased by the presence of rosemary extract. This can be explained due to a number of active compounds that can act as antioxidants and are present in VIT-100 and DLT-100; therefore, it is possible that synergism occurs. Additionally, it can be also explained by the higher content of tocopherols compared to RNX10 (100 mg of tocopherols/100 g of sample and 10 mg of tocopherols/100 g of sample, respectively).
The most important indices by which consumers evalu-ate the freshness and quality of foods are colour and flavour. The colour is commonly used by the consumer as an indication of the freshness of the product. In general, food colour should remain unaltered upon the addition of additives and during storage. Colour parameters are presented in Figure 2. In Figure 2A small changes
on L* value can be observed for samples treated with DLT-100
and RNX10 at day 0 and day 9, respectively, showing that samples became darker. The dark colour formation in tuna salamis can be explained by the browning and the exposure to the light. Papadima
& Bloukas26also referred that high-levels of fat resulted in higher
L* values in Greek sausages.22 Furthermore, sample darkening
co-incides with higher oxidation values; whereas, low TBARS are
nor-Control DLT100 VIT100 RNX10 0 2 4 6 8 10 Day 0 Day 9 # * * # * * TBAR s (m g M DA /kg s am pl e)
Figure 1. TBARs Values (mg of MDA/kg of sample) of Slices of Tuna Salami (Day 0 and Day 9;
Stored at 4 ºC) in the Absence or in the Presence of Three Different Commercial Mixes of Tocoph-erols, DLT-100 (100 mg of Tocopherols/100 g Sample), VIT-100 (100 mg of Tocopherols/100 g of Sample), RNX10 (10 mg of Tocopherols+3.89 Rosemary Extract/100 g of Sample). Each Column is the Mean of 6 to 14 Separate Experiments; Vertical Lines Indicate SEM. Significantly Different from Control Values (#p<0.05) or from Day 0 (*p<0.05)
Control DLT 100 VIT 100 RNX10 20 22 24 26 28 30 32 34 36 Day 0 Day 9 A L* * * # # # Control DLT 100 VIT 100 RNX10 0 2 4 6 8 10 12 14 16 Day 0 Day 9 B a* * * * # # Control DLT 100 VIT 100 RNX10 0 2 4 6 8 10 12 14 16 Day 0 Day 9 C b* * * # # # # Figure 2. Colour Parameters L (A), a* (B) and b* (C) of Slices of Tuna Sa-lami (Day 0 and Day 9; Stored at 4 ºC) in the Absence or in the Presence of Three Different Commercial Mixes of Tocopherols, DLT-100 (100 mg of Tocopherols/100 g Sample), VIT-100 (100 mg of Tocopherols/100 g of Sample), RNX10 (10 mg of Tocopherols+3.89 Rosemary Extract/100 g of Sample). Each Column is the Mean of 30 Separate Experiments; Vertical Lines Indicate SEM. Significantly Different from Control Values (#p<0.05) or from Day 0 (*p<0.05)
mally associated with higher L* values.6 However, in this study, this
correlation was not observed. The VIT treatment was the only that
did not change the L* colour at day 0. After 9 days the L* value was
similar in all the samples. However, the DLT and RNX presented the same darkening parameter at day 0 and day 9 (Figure 2A).
The occurrence of lipid oxidation in tuna salami-like
products can be shown by the decrease of a* value (product less
red). The difference of red tint over the time occurs due to oxida-tive process of transfer of myoglobin to metmyoglobin, which is
associated with the reduction of reddish pigmentation.6 The
nega-tive change of this parameter influences the acceptability of the product by the consumer, which is of major concern to food
pro-ducers. Figure 2 presents the a* values at days 0 and 9, for samples
treated with and without antioxidants. The a* value showed a
sig-nificant (p<0.05) decreasing trend with time (Figure 2B), except
for samples treated with DLT, that non-significant differences (p>0.05) were observed after the 9 days period. However, the a*
value reduction was also lower on the VIT samples. These results confirm the occurrence of lipid oxidation in control samples and are well correlated with TBARS values. During the dry processing of tuna muscle, changes in colour, from bright red to dark red, are the result of the conversion of myoglobin and oxymyoglobin
oxi-dation to brown metmyoglobin1.2,6 The view that VIT and DLT
supplementation partial and total the decrease on reddish colour, respectively, are in line with the TBARS observation and the sta-bility of unsaturated fatty acids levels. Moreover, the results are in
agreement with those reported by Sánchez et al27 who reported
that myoglobin and oxymyoglobin oxidation to brown
metmyo-globin is associated with reduction in reddish colour and lower a*.
Dark fish, like tuna, contain considerable amounts of myoglobin and haem, which makes them susceptible to discoloration and lipid
oxidation.28 In respect to day 0, non-significant differences were
observed among samples which mean that no colour change is de-veloped by the addition of antioxidants. Moreover, non-significant differences were observed among samples treated with RNX and control.
The b* value showed changes between days 0 and 9, for
samples treated with RNX and for the control i.e. samples became
more blue as time increased. According to Bozkurt,29 browning
re-actions explained those results. Pérez-Alvarez et al30 who reported
a decrease in b* value for Spanish sausages, refers that it is
correlat-ed with oxygen consumption by microorganisms. Samples treatcorrelat-ed
with DLT and VIT present stability over time in respect to b* value
CONCLUSION
The antioxidants added to tuna salami demonstrated effects in de-laying both lipid oxidation and darkness of the samples. Moreover, the reduction of the unsaturated fatty acids levels observed in the control samples was by the presence of VIT and DLT antioxidants. During 60 days, the tuna salami preserved on a vacuum package did not show significant changes in lipid oxidation levels, pH, and colour. However, the experiment with slices of tuna salami (mim-icking the consumer experience) evidenced a significant increase in the lipid oxidation after 9 days at 4 ºC. This evidence was accompa-nied by decrease in unsaturated fatty acids and decreases on the red
colour of the tuna salami. The supplementation with DLT (100 mg of tocopherols/100 g sample) and VIT-100 (100 mg of tocopher-ols/100 g of sample) inhibited the lipid oxidation, the reduction of the reddish colour and also the unsaturated fatty acids reduction. On the other hand, the 10 fold reduction of tocopherols on the RNX antioxidant samples, which is constituted by rosemary, being the factor of differentiation to the others, showed higher values of darkness in slices during the period of storage. Moreover, the prevention of the oxidation process and the reduction of the red-dish colour were not observed with the RNX supplementation.It is concluded that tocopherols supplementation (100 mg/100g of sample) enhance the nutritional value of tuna salami mainly by lipid oxidation inhibition.
ACKNOWLEDGMENTS
This study had the support of Fundação para a Ciência e Tecnolo-gia (FCT), through the strategic project UID/MAR/04292/2013 granted to MARE and the support of National Strategic Reference Framework (QREN), through the project ALG-01-0402-FED-ER-006567. The authors are grateful to DSM Nutritional Products and VitaeCaps that kindly provide DLT and RNX, and VIT to-copherols, respectively.
CONFLICTS OF INTEREST
The authors declare that they have no conflicts of interest. REFERENCES
1. Mendes R, Cardoso C, Pestana C. Measurement of malondialde-hyde in fish: A comparison study between HPLC methods and the
traditional spectrophotometric test. Food Chemistry. 2009; 112(4):
1038-1045. doi: 10.1016/j.foodchem.2008.06.052
2. Ozogul Y, Ayas D, Yazgan H, Ozogul F, Boga EK, Ozyurt G. The capability of rosemary extract in preventing oxidation of fish
lipid. Int J Food Sci. 2010; 45(8): 1717-1723. doi:
10.1111/j.1365-2621.2010.02326.x
3. Sarkardei S, Howell NK. Effect of natural antioxidants on stored
freeze-dried food product formulated using horse mackerel (
Tra-churus traTra-churus). Int J Food Sci. 43(2): 309-315. doi: 10.1111/j.1365-2621.2006.01435.x
4. Sun Q, Faustman C, Senecal A, Wilkinson AL, Furr H. Aldehyde reactivity with 2-thiobarbituric acid and TBARS in freeze-dried
beef during accelerated storage. Meat Science. 2001; 57(1): 55-60.
doi: 10.1016/S0309-1740(00)00076-0
5. Bergamo P, Fedele E, Balestrieri M, Abrescia P, Ferrara L. Mea-surement of malondialdehyde levels in food by high-performance
liquid chromatography with fluorometric detection. J Agric Food
Chem. 46(6): 2171-2176.
6. Hernández-Hernández E, Ponce-Alquicira E, Jaramillo-Flores
ME, Guerrero Legarreta I. Antioxidant effect rosemary (Rosmarinus
Submit your article to this journal | https://openventio.org/submit-manuscript/
and colour of model raw pork batters. Meat Sci. 2009; 81(2):
410-417. doi: 10.1016/j.meatsci.2008.09.004
7. Chaijan M. Review: Lipid and myoglobin oxidations in muscle
foods. Songklanakarin J Sci Technol. 2008; 30(1): 47-53.
8. Chaijan M, Benjakul S, Visessanguan W, Faustman C. Changes of pigments and color in sardine (Sardinella gibbosa) and
mack-erel (Rastrelliger kanagurta) muscle during iced storage. Food Chem.
93(4): 607-617. doi: 10.1016/j.foodchem.2004.10.035
9. Chaijan M, Benjakul S, Visessanguan W, Faustman C. Charac-terisation of myoglobin from sardine (Sardinella gibbosa) dark
muscle. Food Chem. 2007; 100(1): 156-164. doi:
10.1016/j.food-chem.2005.09.030
10. Faustman C, Yin MC, Nadeau DB. Color stability, lipid stability, and nutrient composition of red and white Veal. Journal of Food
Science. 1992; 57(2): 302-304. doi: 10.1111/j.1365-2621.1992.
tb05481.x
11. Postnikova GB, Tselikova SV, Kolaeva SG, Solomonov NG. Myoglobin content in skeletal muscles of hibernating ground
squir-rels rises in autumn and winter. Comp Biochem Physiol A Mol Integr
Physiol. 1999; 124(1): 35-37. doi:
10.1016/S1095-6433(99)00085-9
12. Cruz RMS, Vieira MC, Silva CLM. Modelling kinetics of water-cress (Nasturtium officinale) colour changes due to heat and
ther-mosonication treatments. Innovative Food Science & Emerging
Technolo-gies. 2007; 8(2): 244-252. doi: 10.1016/j.ifset.2007.01.003
13. Nisha P, Singhal RS, Pandit AB. A study on the degradation kinetics of visual green colour in spinach (Spinacea oleracea L.)
and the effect of salt therein. J Food Eng. 2004; 64(1): 135-142. doi:
10.1016/j.jfoodeng.2003.09.021
14. Tijskens LMM, Schijvens EPHM, Biekman ESA. Modelling the change in colour of broccoli and green beans during blanching.
Innovative Food Science & Emerging Technologies. 2001; 2(4): 303-313.
doi: 10.1016/S1466-8564(01)00045-5
15. Ohene-Adjei S, Bertol T, Hyun Y, Ellis M, McKeith FK, Brew-er MS. Effect of vitamin E, low dose irradiation, and display time
on the quality of pork. Meat Sci. 2004; 68(1): 19-26. doi: 10.1016/j.
meatsci.2003.08.016
16. Lepage G, Roy CC. Direct transesterification of all classes of
lipids in a one-step reaction. J Lipid Res. 1986; 27: 114-120.
17. Vyncke W. Direct determination of the thiobarbituric acid value in trichloracetic acid extrats of fish as a measure of
oxida-tive rancidity. Fette Seifen Austrichmitte. 1970; 72: 1084-1087. doi:
10.1002/lipi.19700721218
18. Lemon DW. An Improved TBA Test for Rancidity. Fisheries and
Oceans Canada, Halifax Laboratory, New Series Circular; 1975; 51.
19. Robles-Martinez C, Cervantes E, Ke PJ. Recommended Method
for Testing the Objective Rancidity Development in Fish based on TBARS Formation. Canada: Government of Canada, Fisheries and Oceans;
1982: 1089.
20. Shahidi F, Wanasundara PKJPD. Extraction and analysis of
lip-ids. In: Akoh CC, Min DB. eds. Food Lipids Chemistry, Nutrition, and
Biotechnology. Boca Raton, USA: CRC Press; 2008: 125-149.
21. Shahidi F, Zhong Y. Lipid oxidation: measurement methods.
In: Shahidi, F, ed. Bailey’s Industrial Oil and Fat Products. New Jersey,
USA: John Wiley & Sons, Inc.; 2005: 357-385.
22. Barriuso B, Astiasarán I, Ansorena D. A review of analytical methods measuring lipid oxidation status in foods: A challenging
task. Eur Food Res Technol. 2013; 236: 1-15. doi:
10.1007/s00217-012-1866-9
23. Salih A, Smith D, Price J, Dawson L. Modified extraction 2-thiobarbituric acid method for measuring lipid oxidation in
poul-try. Poult Sci. 1987; 66: 1483-1488. doi: 10.3382/ps.0661483
24. Fernández MCD, Rodríguez JMZ. Lipolytic and oxidative
changes in ‘Chorizo’ during ripening. Meat Sci. 1991; 29(2): 99-107.
doi: 10.1016/0309-1740(91)90057-W
25. Lorenzo JM, Temperán S, Bermúdez R, Cobas N, Purriños L. Changes in physico-chemical, microbiological, textural and sensory
attributes during ripening of dry-cured foal salchichón. Meat Sci.
2012; 90(1): 194-198. doi: 10.1016/j.meatsci.2011.06.025
26. Papadima SN, Bloukas JG. Effect of fat level and storage
condi-tions on quality characteristics of traditional Greek sausages. Meat
Sci. 1999; 51(2): 103-113. doi: 10.1016/S0309-1740(98)00103-X
27. Sánchez-Escalante A, Djenane D, Torrescano G, Beltrán JA, Roncalés P. The effects of ascorbic acid, taurine, carnosine and rosemary powder on colour and lipid stability of beef patties
pack-aged in modified atmosphere. Meat Sci. 2001; 58(4): 421-429. doi:
10.1016/S0309-1740(01)00045-6
28. Thiansilakul Y, Benjakul S, Park SY, Richards MP. Charac-teristics of myoglobin and haemoglobin-mediated lipid oxida-tion in washed mince from bighead carp (Hypophthalmichthys
nobilis). Food Chem. 2012; 132(2): 892-900. doi:
10.1016/j.food-chem.2011.11.060
29. Bozkurt H. Comparison of the effects of sesame and Thym-bra spicata oil during the manufacturing of Turkish dry-fermented
sausage. Food Control. 2007; 18(2): 149-156. doi:
10.1016/j.food-cont.2005.09.009
30. Pérez-Alvarez JA, Sayas-Barberá MaE, Fernández-López J, Aranda-Catalá V. Physicochemical characteristics of Spanish-type
dry-cured sausage. Food Research International. 1999; 32(9), 599-607.