1.Universidade Federal de Santa Catarina – Departamento de Engenharia Mecânica – Florianópolis/SC – Brazil. 2.Universidade Federal de Santa Catarina – Programa de Pós-graduação em Engenharia de Produção – Departamento de Engenharia de Produção e Sistemas – Florianópolis/SC – Brazil.
Correspondence author: Enzo Frazzon | Universidade Federal de Santa Catarina – Programa de Pós-Graduação em Engenharia de Produção – Departamento de Engenharia de Produção e Sistemas | Campus Reitor João David Ferreira Lima s/n | 88.040-001 – Florianópolis/SC – Brazil | E-mail: [email protected] Received: Aug. 24, 2017 | Accepted: Jan. 7, 2018
Section Editor: Adiel Almeida
ABSTRACT: Additive manufacturing technologies have the potential to revolutionize manufacturing, allowing for the production of ever more complex products and supporting the creation of strategic competitive advantages to certain industries. Recent investments in additive manufacturing systems show that operational plants are close to become reality. In this context, the demand for knowledge regarding the behavior of such systems is expected to increase. This research aims to analyze additive manufacturing systems – based on powder bed fusion technologies – applied to aerospace fuel nozzles by modeling and simulating different scenarios regarding the allocation of resources. The amount of time required by the additive step is a key aspect of the plants behavior and, still, there is a limit to the increase in productivity attained by adding more parts per batch. Different combinations of productive resources showed that the optimization of resources utilization is bounded by the number of additive manufacturing machines. Furthermore, total unit costs are mostly driven by the equipment costs as the need for human resources is significantly reduced.
KEYWORDS: Additive manufacturing, Simulation, Production management, Optimization.
INTRODUCTION
Additive manufacturing (AM) has progressively gained relevance as a viable manufacturing process for a series of industries. The advantages provided by these technologies have shown the potential to greatly impact supply chains, manufacturing systems and products, allowing more complex parts to be made (Guo and Leu 2013) with a reduced lead time and in a more cost-effective manner (Waterman and Dickens 1994).
Despite its limitations, additive manufacturing systems have consistently grown in the number of applications, ranging from dental implants (Stratasys 2017) to injection molding matrices (LBC Engineering 2016) (Linear AMS 2016), being implemented also in helicopter engine components (Safran Helicopter Engines 2015).
Some industries have begun investing in AM as a solution for the large scale manufacturing of products. This is specially the case for the aerospace sector, which stands to profit greatly from many of the process’ advantages (Lyons 2014). GE, one of the best known players in the aerospace sector, has invested in the development of additive manufacturing based plants expecting to supply one of its new engines with parts fabricated through additive methods (LaMonica 2013). Airbus also represents an example of the increasing interest in this technology in the aerospace sector. The company has been working, since 2014, to expand the use of additively manufactured parts in its aircrafts and has recently included the first 3D-printed titanium bracket in its airplane structure. This part of the aircraft pylon is currently in serial production and is being tested in selected aircrafts (Airbus 2017).
Simulation-Based Analysis of Additive
Manufacturing Systems for Fuel Nozzles
João Pedro Grobberio Trancoso1, Vicente Piazza1, Enzo Frazzon2
Trancoso JPG; Piazza V; Frazzon E (2018) Simulation-Based Analysis of Additive Manufacturing Systems for Fuel Nozzles. J Aerosp Technol Manag, 10:e4118. doi: 10.5028/jatm. v10.963.
How to cite
Trancoso JPG http://orcid.org/0000-0003-4243-7465
Piazza V http://orcid.org/0000-0003-0699-4336
Another example is Textron, an aircraft manufacturer that is incorporating additive manufacturing parts in its products. The company is using the first air-air heat exchanger additively manufactured by Unison Industries in the new Cessna Denali single engine turboprop, which is expected to fly in 2018 (Unison 2017).
It becomes clear that there will be a need for solid understanding of the behavior of such plants in the near future, covering a still largely untouched field of manufacturing research. The present research aims to analyze the impact of employing additive manufacturing technology in production key performance indicators, i.e., resource utilization, throughput time and unit costs. The results were obtained through modeling and simulation of alternative scenarios for an aerospace fuel nozzles manufacturing plant.
RESEARCH AND PRAXIS PANORAMA
Additive manufacturing is the term designated to represent a process of manufacturing based on material addition, differing itself from today’s conventional, and most known, methods of extraction. As ASTM (2015) supports, additive manufacturing is the process of joining materials to make parts from 3D model data, usually layer upon layer.
One of the main steps to reach the definition of smart factory, as is called the result of virtual data and real production equipment sum, is the development of additive manufacturing in this environment (McKinsey Digital 2015), which could bring more flexibility, quickness and accuracy into manufacturing (Klose 2016).
However, these advantages of AM cannot be fully exploited yet since this technology is still in an early stage of development, compared to conventional technologies. The present immaturity of additive manufacturing in its main fields – material, process and machines – is what defines the boundary between a widespread utilization, expected to the future, and its usage in some restricted areas, where the current knowledge can support AM utilization (Bandyopadhyay and Susmita 2015; Roland Berger 2013).
Besides the limited applications of these technologies and the existence of implementation barriers, there is already a clear understanding of the advantages that AM can bring in the future to the production sector.
Table 1. Advantages and disadvantages of AM. Adapted from Mellor et al. (2014) and Ford and Despeisse (2016).
Advantages Disadvantages
Freedom of design Slow build rates
Increase in demand flexibility High production cost
Decrease in lead time Limited component size
Decrease in material waste Poor mechanical properties
Reduction in skilled labor requirement
As Gibson et al. (2010) argued, the whole process of additive manufacturing could be described in a few generic steps that go from the virtual conception to the final body produced. To simplify these steps, they could be ordered as virtual modeling, machine setup, building and post-processing.
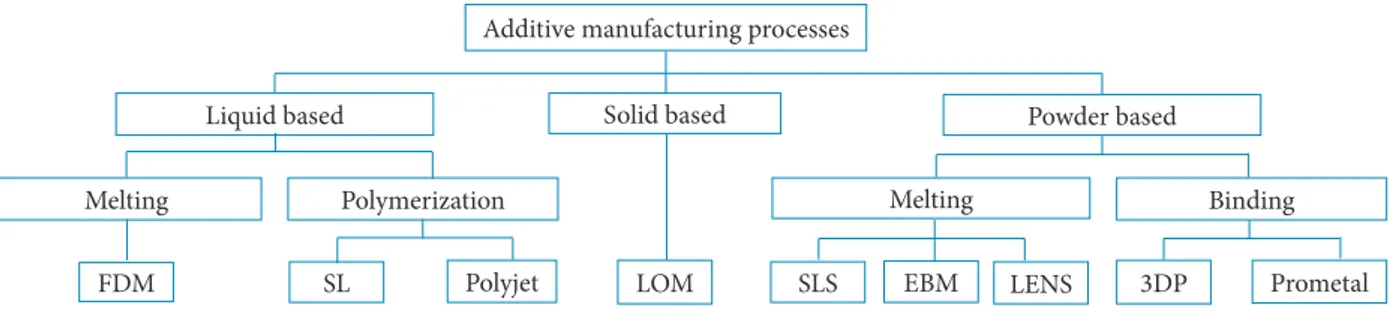
In general, each step represents a group of activities that varies according to the additive technology used (since the layer adding process changes considerably for each technology) and the product’s features. To distinguish the technology used in each method, it could be classified according to state of material applied, which is divided into processes based on solids, liquids and powders (Fig. 1).
six institutes are involved in each researched field for PBF’s development, considering 43 different areas of study (Gausemeier
et al. 2013). Following this trend, in 2016 the metal powder market for additive manufacturing was evaluated as US$310.6 million and expected to grow at a pace of 22.4% CAGR in the period of 2017–2025, reaching a valuation of US$1,783.9 million by 2025 (Transparency Market Research 2017). Furthermore, of the whole metal powder market, the leading market share in 2016 was held by powder bed technology (Transparency Market Research 2017).
Besides a significant increase in relevance, the study of the application of PBF in additive manufacturing production systems for large scale operations is still in its infancy. In this context, the present paper intends to analyze the effects of adopting AM as the main fabrication technique in a specific product for the aerospace sector.
The results obtained in this study should help guide the future decisions in manufacturing plant sizing and support management systems decision processes by mapping the behaviors of different plant configurations. The findings of this research could be used in association with appropriate decision making methodologies and criteria weights models, such as analyzed by (Almeida et al.
2016), and sustain strategic actions by players in the market.
SIMULATION-BASED ANALYSIS
This research employed a discrete-event modeling and simulation approach, which was developed using the software Anylogic® (version PLE 8.1.0) and supported by the procedure described by Robinson (2004). The aim of using a simulation-based approach was allowing for the analysis of employing additive manufacturing technology in production key performance indicators, i.e. resource utilization, throughput time and unit costs. This research intends to evaluate manufacturing performance by varying different production parameters, such as the number of workers and machines, the characteristics of the additive process and the number of parts per batch in each machine.
The model was developed with the hypothesis that the additive techniques will be fully established and controlled, overcoming current deficiencies such as lack of precision, repeatability and consistency of the parts produced.
The simulation developed in this study represents the idealization of a future production line for a gas turbine fuel nozzle. Major players in the aerospace industry, such as General Electric, have shown a tremendous effort towards the implementation of additive manufactured components in its products. Besides General Electric, Turbomeca, a helicopter engine manufacturer, has also worked to include additive manufactured parts in its engines (Safran Helicopter Engines 2015).
With these initiatives taking place around the world, the present study focuses on analyzing the actual implications and characteristics regarding the development of additive manufacturing based processes to fabricate gas turbine fuel nozzles. Taking into account the major factors relevant to the behavior of the expected future manufacturing plants in comparison to the current methods.
PART CHARACTERISTICS
The part used to develop the manufacturing process is the new GE fuel nozzle, which is intended to work in the new CFM International LEAP engine (GE Additive 2016). According to estimates, there should be a demand of 25000 fuel nozzles annually
Figure 1. Processes classification. Adapted from Kruth (1991) and Wong and Hernandez (2012).
Additive manufacturing processes
Solid based
Polymerization Binding
Liquid based
Melting Melting
SL
FDM Polyjet LOM SLS EBM LENS 3DP Prometal
within in a few years. The parts are expected to be manufactured using cobalt-chrome powders in layers of approximately 20 micrometers of thickness (LaMonica 2013). According to the company, the new design should be about 25% lighter than its predecessor, require less parts and employ more complex cooling mechanisms and support structures, enabling higher durability (GE Additive 2016; GE Global Research 2016).
Beyond product complexity and quality, it is also expected that the overall productivity can be increased since the machines can run around the clock (LaMonica 2013).
The part for which the manufacturing plant was developed in this study was approximated as a parallelepiped without cavities to facilitate the estimates regarding the additive process.
The manufacturing technology considered to apply these study was powder bed fusion, since, as said before, it is one of the most researched and used principally for metals. Given that, the machine used was the EOS M 400, whose characteristics were obtained from the machine’s data sheet (EOS 2015).
According to the specifications of the machine chosen to fabricate the fuel nozzle and the defined part’s dimensions, a model was developed to estimate the time required to produce each fuel nozzle and establish a range of values for the additive manufacturing time.
The model employs the available data for the equipment’s performance and assumes a square cross section for the part. Defining a series of characteristics such as laser speed, laser diameter, surface area, layer thickness, part dimensions and time to refill powder bed, the calculations shown on the appendix are able to estimate the total time to manufacture the product.
SYSTEM DESCRIPTION AND SIMULATION MODEL
According to Levy et al. (2003), additive manufacturing is not expected to become fully capable of substituting established manufacturing processes, so it is reasonable to assume that it will still require post-processing steps. As previously mentioned, Gibson et al. (2010) establish the general processes involved in manufacturing parts through additive methods. These processes could be organized more specifically as the following:
• Conceptualization and CAD
• Conversion to STL/AMF
• Transfer and manipulation of STL/AMF file on AM machine
• Machine setup
• Build
• Part removal and cleanup
• Post-processing of part
• Application
In order to restrict the scope of the study, the preliminary steps involving the manipulation of files and information exchange were removed from the analysis. The study focuses on the physical activities necessary to create the parts and evaluates the effects of different parameters on the behavior of the process. The simulation starts at the Machine setup step and follows the suggested steps until the Post-processing of part, stopping when the final product reaches the finished products inventory.
To better estimate the future layout of additive manufacturing plants used for gas turbine fuel nozzles production, the product was analyzed to define the key aspects of its performance and general requirements for the application in marketable engines.
According to studies, one of the major factors involved in assuring part effectiveness and quality was the fuel spray quality, being highly relevant to the turbines overall efficiency and power (Elkotb 1982). In order to better represent the future manufacturing process of fuel nozzles, the simulations were developed with post processing steps that should be able to bring the part to its final form despite the additive manufacturing process limitations.
Although quality assurance is an essential part of fuel nozzle’s current production process, the steps involved in examining the product conformity were not implemented in this study. As the verification steps don’t play a major role in the making time of the parts, and involve highly specific activities such as geometry evaluation for some additive manufactured parts and spray quality assessments for fuel nozzles specifically, these processes were overly complex to predict and estimate with the present knowledge of the subject.
The conceptual plant idealized for the future demands and processes characteristics is shown in Fig. 2.
Figure 2. Simplified plant layout.
Cleaning Station
Resource waiting station
Powder stock
CNC Machining
Intermediary stock
Intermediary stock #2
Final parts stock EOS M 400
Thermal treatment
The simplified layout takes into account the major processes for the production of fuel nozzles, which were defined in this research as being:
• Additive manufacturing of parts
• Powder removal/part cleansing
• CNC Machining
• Heat treatment
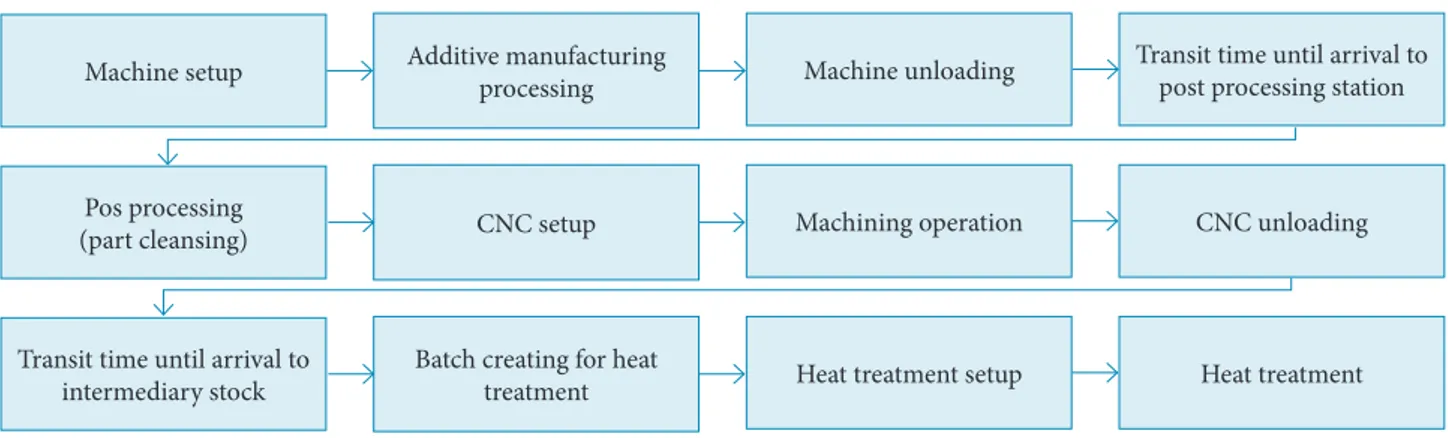
A detailed description of the processes was developed to allow the creation of the model. It can be seen in the schematic representation (Fig. 3).
Figure 3. Breakdown of processes required to manufacturing fuel nozzles in a simplified plant.
Machine setup
Pos processing (part cleansing)
Transit time until arrival to intermediary stock
Additive manufacturing processing
CNC setup
Batch creating for heat treatment
Machine unloading
Machining operation
Heat treatment setup
Transit time until arrival to post processing station
CNC unloading
These main processes will establish the basis of the model, each of them having a task in the simulation that will define the period of time and the set of resources required to perform it. A process is only considered finished when its required resources spent the necessary amount of time to complete the operation, which will allow the part to reach the next step.
In addition, the model is configured to have tasks to simulate two intermediary stocks, where the WIP (Work-in-Process) can be stored until the latter processes are capable of operating. The modeled facility is also designed to prioritize the ending activities in the labor allocation in order to guarantee the production flow.
PROCESS PARAMETERS AND ADDITIVE MANUFACTURING REQUIRED TIME
The additive manufacturing processing time is highly dependent on a series of factors, mainly related to the part dimensions and the equipment’s performance. A simplified model was developed in appendix to better estimate the time required to manufacture the chosen part. The model takes into account the main steps that occur during the additive manufacturing process, which are the powder refill time (Trefill) and laser scan speed (Vlaser).
Combined with the part’s dimensions and other parameters, such as layer thickness and laser diameter, it was possible to predict the time needed to complete a full cycle, comprising the laser scanning and powder refill, and in turn estimate the time for a full part.
For the CNC process, the time required to machine each part had to be estimated. The lack of precise information, regarding the requirements for the finished product and the current methods used, prevented the further analysis of a more precise value. A value of 120 min was defined as reasonable estimate considering the parts dimensions, and the surface area expected to need intervention.
As the focus of the study is on the additive aspect of the plant, this approximation is not of great impact on the results. The most relevant effect will emerge on the time necessary for machine setup, since it requires human intervention and captures resources from the pool, preventing them from performing other activities.
The thermal treatment time was evaluated inspired on the study by Thöne et al. (2012), considering the importance of such process to the material properties (Frazier 2014). A value of 2 h was established for the process. The machines were not specified since an approximate value should be constant to simplify the analysis. The batch sizes were adapted to emulate larger equipment according to increases in productivity.
The time distribution between the manufacturing steps – machine setup, additive process, part and machine cleansing, CNC machine setup, CNC machine process, part transportation, heat treatment setup and heat treatment – is illustrated in the graphic presented in Fig. 4. It can be noted that the process depends heavily on the additive step performance, as it represents more than 80% of the total time necessary to manufacture a single part. For situations where the batch size is greater, the additive processing time is even stronger in relevance.
Figure 4. Time required for each process considering just a production of a single part.
1
0 200 400 600 800 1000 1200 1400 1600 800
Process time (min)
EOS M 400 setup
Part and machine cleansing
CNC Machine setup
Part transportation intermediary stock #2
Heat treatment
Additive process
Part transportarion to intermediary stock
CNC machining process
SCENARIOS ANALYZED
The model was adjusted to recreate a range of different plant setups. The variables changed were the number of machines and workers, which vary simultaneously in a range of 1 to 100. With this approach, it was possible to study the plant’s throughput, resource utilization and overall costs for each different scenario.
To isolate the additive manufacturing process performance from the influence of other processes on the plant the latter were defined as being more capable than necessary, avoiding bottlenecks and queues.
The Post-processing step CNC machining was adapted to vary along with the changes in the plant throughput as to avoid the creation of a bottleneck and its effects on the production time. The heat treatment also automatically corrects its batch size according to the number of machines in order to avoid the formation of queues.
The method for dealing with the initialization bias relies on determining the warm-up period based on Welch’s method, for which a period of 4 months was adopted for the simulation to reach the steady state. The software is also expected to run multiple replications per simulation. To improve results reliability, replications will stop when a 99.9% of confidence level is achieved, with a maximum number of 20 replications.
An infinite supply of raw materials was established in order to eliminate events that impact productivity and that were not relevant to this study. The demand was set as infinite to evaluate the systems maximum capacity.
This configuration is similar to the one analyzed by Pergher and Almeida (2017), adopting a production regimen on the basis of MTS (Make To Stock) objectives. This reflects a specific situation for the plant where it could be producing more parts than necessary in order to avoid problems with demand seasonality in the sector and have products ready to ship.
As the basis of the study is to predict the behavior of future production systems, the validation method performed was based on the white-box approach studied by Robinson (2004). The method allowed the validation of the model without a direct comparison with real systems, since it was not feasible for this case.
RESULTS AND DISCUSSION
The total time needed to create a part is dependent on two main times, the time to create the layer, mostly related to the laser speed, and the time to refill powder in the bed for the next layer. Since the refill time is the most important limiting factor of the process and depends only on the number of layers produced (which is the same since the products made are positioned side-by-side, considered in this study), one way to reduce the processing time and increase manufacturing efficiency is to increase the batch size.
As a result, the time to refill will remain the same and the number of parts produced will increase, eliminating redundant time required to refill the powder bed with individual parts, consequently improving productivity.
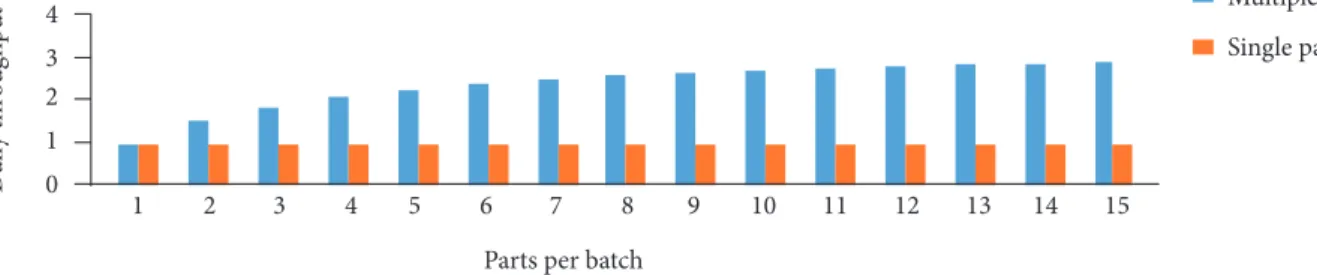
Despite of the variation between the total time required to build the fuel nozzle’s batch in a single machine and the number of parts built being directly proportional, the efficiency of the additive process can be highly increased as the number of parts made per batch rises.
The graph in Fig. 5 shows that the increase in the number of parts produced at once induces a variation in daily throughput that follows the shape of a logarithmic function. In other words, the function’s rate of change reduces as more parts are added to the batch.
Figure 5. Additive manufacturing throughput in a single machine.
D
ai
ly t
hr
oug
h
p
u
t 4
3 2 1
1 2 3 4 5 6
Parts per batch
Multiple parts
Single parts
7 8 9 10 11 12 13 14 15
In the present study, the physical limitations of the EOS M 400’s powder bed is the limiting factor of nozzles made in one batch. Assuming that the powder bed’s dimensions are 400 × 400 × 400 mm, the number of parts chosen to evaluate in this study was 15. Although the machine’s powder bed allows it to produce more than this quantity, there is a safety factor considered in the distance between nozzles that reduces the amount of products made.
RESOURCES UTILIZATION
As presented before, the time required to manufacture a nozzle is mainly dependent on the additive process and minimally on the human effort and complementary processes (Fig. 4). Comparing the shifts of human labor with additive machines operation, it is seen that the worker’s shift allows them to interact with the machine during only 20% of machines’ total operating time, since it runs 24 hours a day and 7 days a week. Moreover, humans’ tasks, except for the post processing, are mostly secondary, rarely taking a large period of time, and mainly performed for backing machines’ work.
As a result, the utilization of human resources is extremely dependent on the number of machines operating in facility, having generally a low value. Yet, if in one hand operating with a high machine-to-employee ratio will decrease the idleness of employees, on the other, it will affect the utilization of machines, rising the waiting time to begin the additive process and intensifying the bottleneck effect in production as shown in Fig. 4.
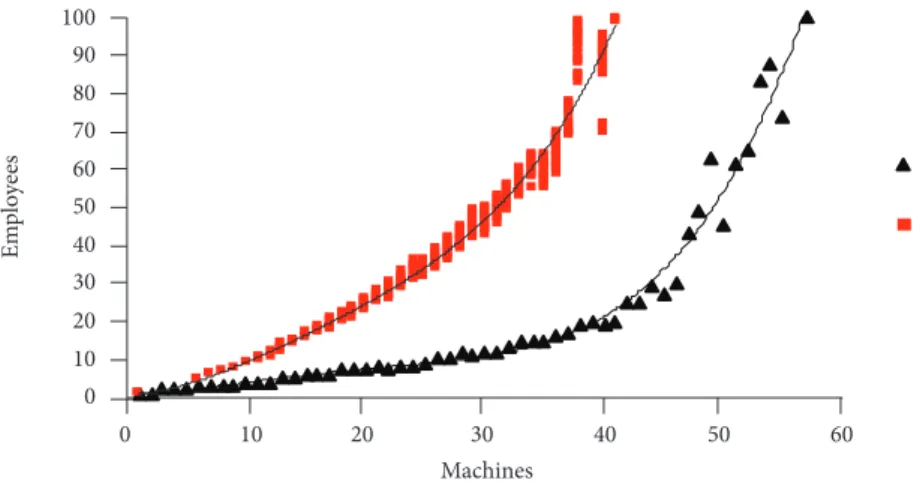
Although the correlation between the usage of both principal resources, additive machines and employees, is negative, it can be optimized for this particular scenario by assuming acceptable ranges for these values. Therefore, assuming a minimum tolerable utilization of 70% for additive machines and of 30% to 35% for employees, it can be seen that the suitable resources arrangements follow a function that can be determined through polynomial regression.
Figure 6 shows the employee-machine ratio required to meet the criteria established. The graphic also reveals a particularity in the behavior of the 70% machine utilization curve, which starts linearly and changes to an exponential behavior. This shift occurs when the increases in heat treatment’s batch size cease to be enough to guarantee the necessary productivity in this step. As a result, the additive step overflows the system, requiring extra work from the employees to make sure all parts go through heat treatment since it’s done more times with batches that are not sufficiently big.
This behavior was seen because the correction factor applied to the batch size was defined arbitrarily.
Consequently, the optimal region to operate the facility for the presented scenario can be defined within the curves, where the utilization for machines and employees are both greater than the minimum acceptable.
Restricting the analysis to the optimal area where utilization of resources is above the minimums established, the performance of this particular additive manufacturing based plant could be described in terms of some key aspects such as unit costs, lead time and productivity.
Figure 6. Arrangements of resources that meet the criteria established.
100
Em
p
lo
ye
es
90 80 70 60 50 40 30 20 10 0
0 10 20
Machines
30 40 50 60
PRODUCTIVITY
The total plant production through four months shows a strong growth as the quantity of machines and employees in operation increases, describing an expected behavior. Moreover, it could be seen that the number of employees does not have a great effect in productivity when compared to the number of machines in operation (Fig. 7). In other words, the influence of human labor is relatively low in total production especially because of the secondary work associated.
Figure 7. Productivity for the region of interest.
TIME
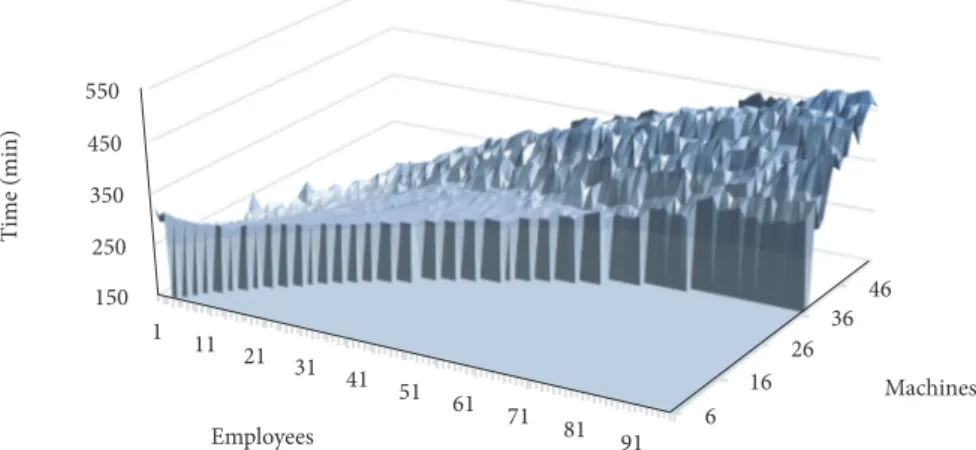
The plant modeled as seen before is capable of adjusting itself in terms of heat treatment and batch size. Therefore, even though the productivity shows an ascension as the total number of machines is increased, the entire time to fabricate a fuel nozzle is higher when operating with a greater number of machines, considering that the batch size is larger (Fig. 8).
For this reason, the plant’s capability to respond quickly to different types of demand, which is one of the main advantages of additive manufacturing, could be consequently affected.
91 16
26 36 46 0
20 40 60 80 100
0 1
11 21
31 41
51 61
71
81 Machines
Employees
U
ni
ts/d
ay
Machines
Employees
T
im
e (min)
6 16
26 36
46 150
250 350 450 550
1 11 21 31
41 51
61 71
81 91
Figure 8. Throughput time for the region of interest.
COST
The cost of machine operating is based on typical power consumption stated on the EOS M 400 technical datasheet, considering the number of machines used and the total machine operating time calculated through simulation. The complete method used to estimate the cost can be seen in appendix.
6 16 26 36 46
$ 1,300 $ 1,500 $ 1,700 $ 1,900 $ 2,100
1 11 21 31 41 51 61 71 81 91
M
ac
hin
es
U
ni
t cos
t
Employees
As Fig. 9 shows, the unit cost ascension is almost exclusively driven by the number of employees in production and has its minimum value for the smallest number of workers operating. The critical reason for this trend is related with the low improvement in production even with an elevated number of workers as “productivity graph” illustrates.
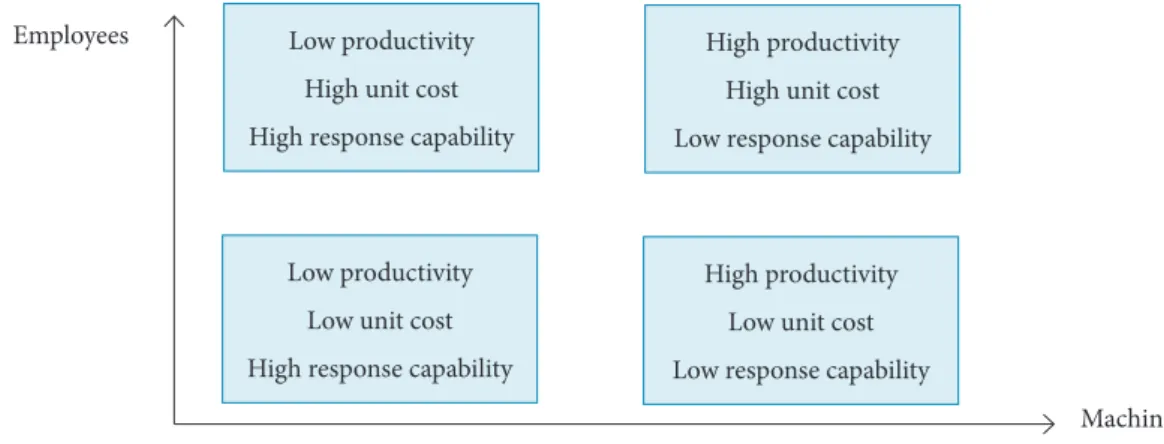
These three main analyses for the plant designed can qualitatively describe different scenarios where the additive manufacturing based production could employed (Fig. 10).
Figure 9. Unit cost for the region of interest.
Figure 10. Scenarios where an additive manufacturing based plant can operate.
Low productivity
High unit cost
High response capability
High productivity
High unit cost
Low response capability
Low productivity
Low unit cost
High response capability
High productivity
Low unit cost
Low response capability
Since the quantity of resources operating could increase or decrease some key aspect of the particular facility, the market environment in which the production is running is what will define the production scenario and the required resources needed to operate.
CONCLUSIONS
Although the main advantages of additive manufacturing, such as high capacity to produce complex geometries or even to meet mass customization demand, are well studied, its behavior in a real production environment has not been
broadly acknowledged yet. This study, in such context, had the purpose of investigating the implications of this technology in a modeled facility considering the impact of production parameters such as quantity of machines and human labor. Using simulation analysis, the study revealed that the production line could be optimized in terms of utilization of its main resources, which appear to display a well-defined curve. The findings, in terms of production performance, i.e. time, productivity and cost, also led to the conclusion that additive manufacturing based plants could operate in four different scenarios regarding its resources quantities that will enhance different production characteristics: Productivity, Unit cost and Response capability. Finally, the research also clarified the role of human labor in additive manufacturing-based production, exposing that although the sector is dealing with a highly complex product, the human labor, despite its necessary function, had not showed to be critical to production regarding the productivity of the plant and lead time. Future research could focus on developing of pilot additive manufacturing plants, so that the relation between productive parameters and resulting performance is better substantiated for real-world situations. Furthermore, the analysis of more detailed process parameters could support a better understanding of forthcoming challenges for additive manufacturing.
AUTHOR’S CONTRBUTION
Conceptualization, Trancoso JPG, Piazza V and Frazzon E; Methodology, Trancoso JPG, Piazza V and Frazzon E; Supervision, Frazzon E; Formal analysis, Trancoso JPG, Piazza V; Visualization, Trancoso JPG, Piazza V; Writing – Original draft, Trancoso JPG and Piazza V; Writing – Review and editing, Frazzon E.
REFERENCES
Airbus (2017) First titanium 3D-printed part installed into serial production aircraft. Airbus; [accessed 2017 November 9]. http://www.airbus.com/newsroom/press-releases/en/2017/09/first-titanium-3d-printed-part-installed-into-serial-production-. html
Almeida AT, Almeida JA, Costa APCS, Almeida-Filho AT (2016) A new method for elicitation of criteria weights in additive models: flexible and interactive tradeoff. European Journal of Operational Research 250(1):179-191. doi: 10.1016/j.ejor.2015.08.058
ASTM (2015) ISO/ASTM52900-15 Standard terminology for additive manufacturing – general principles – terminology. West Conshohocken: ASTM International. doi: 10.1520/ISOASTM52900-15
Bandyopadhyay A, Susmita B (2015) Additive manufacturing. Boca Raton: CRC Press.
Elkotb MM (1982) Fuel atomization for spray modelling. Progress in Energy and Combustion Science 1(8):61-91. doi: 10.1016/0360-1285(82)90009-0
EOS (2015) System data sheet EOS M 400. Krailling: EOS; [accessed 2016 June 10]. https://www.eos.info/systems_solutions/ metal/systems_equipment/eos_m_400
Ford S, Despeisse M (2016) Additive manufacturing and sustainability: an exploratory study of the advantages and challenges. Journal of Cleaner Production 137:1573-1587. doi: 10.1016/j.jclepro.2016.04.150
Frazier WE (2014) Metal additive manufacturing: a review. Journal of Materials Engineering and Performance 23(6):1917-1928. doi: 10.1007/s11665-014-0958-z
Gausemeier J, Wall M, Peter S (2013) Thinking ahead the future of additive manufacturing: exploring the research landscape. Paderborn: Heinz Nixdorf Institute.
GE Additive (2016) GE additive manufacturing in Alabama: the future is now. GE Additive; [accessed 2017 April 7]. http://www. geadditive.com/press-releases/ge-additive-manufacturing-in-alabama-future-is-now
GE Global Research (2016) 3D printing creates new parts for aircraft engines: General Electric; [accessed 2016 June 20]. http://www.geglobalresearch.com/blog/3d-printing-creates-new-parts-aircraft-engines
Guo N, Leu MC (2013) Additive manufacturing: technology, applications and research needs. Frontiers of Mechanical Engineering 8(3):215-243. doi: 10.1007/s11465-013-0248-8
Klose R (2016) Industry 4.0 and additive manufacturing. Empa; [accessed 2016 July 20]. https://www.empa.ch/web/s604/wef-industry-4.0
Kruth JP (1991) Material incress manufacturing by rapid prototyping techniques. CIRP Annals 40(2):603-614. doi: 10.1016/s0007-8506(07)61136-6
LaMonica M (2013) Additive Manufacturing. MIT Technology Review; [accessed 2016 July 16]. https://www.technologyreview. com/s/513716/additive-manufacturing/
LBC Engineering (2016) Laser generating, innovative and unconventional manufacturing: LBC Engineering; [accessed 2016 July 16]. http://www.lbc-engineering.de/en/services.php
Levy GN, Schindel R, Kruth JP (2003) Rapid manufacturing and rapid tooling with layer manufacturing (Lm) technologies, state of the art and future perspectives. CIRP Annals - Manufacturing Technology 52(2):589-609. doi: 10.1016/s0007-8506(07)60206-6
Linear AMS (2016) Additive manufacturing; [accessed 2016 July 16]. http://www.linearmold.com/additive-manufacturing/
Lyons B (2014) Additive manufacturing in aerospace: examples and research outlook. The Bridge 42(1):13-19.
McKinsey Digital (2015) Industry 4.0 how to navigate digitization of the manufacturing sector: McKinsey & Company; [acessed 20 September 2016]. https://www.mckinsey.com/business-functions/operations/our-insights/industry-four-point-o-how-to-navigae-the-digitization-of-the-manufacturing-sector
Mellor S, Hao L, Zhang D (2014) Additive manufacturing: a framework for implementation. International Journal of production Economics 149:194-201. doi: 10.1016/j.ijpe.2013.07.008
Pergher I, Almeida AT (2017) A multi-attribute decision model for setting production planning parameters. Journal of Manufacturing Systems 42:224-232. doi: 10.1016/j.jmsy.2016.12.012
Roland Berger (2013) Additive manufacturing: a game changer for the manufacturing industry? Munich: Roland Berger; [accessed 2016 July 25]. https://www.rolandberger.com/en/Publications/pub_additive_manufacturing_2013.html
Robinson S (2004) Simulation: the practice of model development and use. Chichester: Wiley.
Safran Helicopter Engines (2015) Turbomeca introduces additive manufacturing capability for engine components. Bordes: Safran Helicopter Engines; [accessed 2016 July 29]. https://www.safran-helicopter-engines.com/media/turbomeca-introduces-additive-manufacturing-capability-engine-components-20150109
Stratasys (2017) Implementing a seamless digital dentistry workflow; [accessed 2016 Jul 29]. http://usglobalimages.stratasys. com/Case%20Studies/Dental/CS_PJD_Allure.pdf?v=635987289871907586
Thöne M, Leuders S, Riemer A, Tröster T, Richard HA (2012) Influence of heat-treatment on selective laser melting products – e.g. Ti6Al4V. Presented at: International Solid Freeform Fabrication Symposium; Austin, USA.
Transparency Market Research (2017) Metal powders for additive manufacturing market to grow at stellar 22.4% CAGR. Transparency Market Research; [accessed 2017 November 15]. https://www.transparencymarketresearch.com/pressrelease/ metal-powders-additive-manufacturing-market.htm
Unison (2017) Unison to provide additive manufactured air-air heat exchangers for the new Cessna Denali aircraft. Dayton: Unison; [accessed 2017 Nov 10]. https://www.unisonindustries.com/content/unison-provide-additive-manufactured-air-air-heat-exchangers-new-cessna-denali-aircraft
Waterman NA, Dickens P (1994) Rapid product development in the USA, Europe and Japan. World Class Design to Manufacture 1(3): 27-36. doi: 10.1108/09642369210056629
Wohlers Associates (2014) Metal additive manufacturing grows by nearly 76% according to Wohlers report 2014. Fort Collings: Wohlers Associates; [accessed 2016 May 15]. https://wohlersassociates.com/press64.html
APPENDIX – ADDITIVE MANUFACTURING PROCESS TIME MODEL
A model was developed to predict the time necessary to manufacture the parts through additive manufacturing.
Two sets of information were required to create the model, the parts dimensions and the equipment capacity. The data used on the calculations was based on the EOS M 400 data sheet.
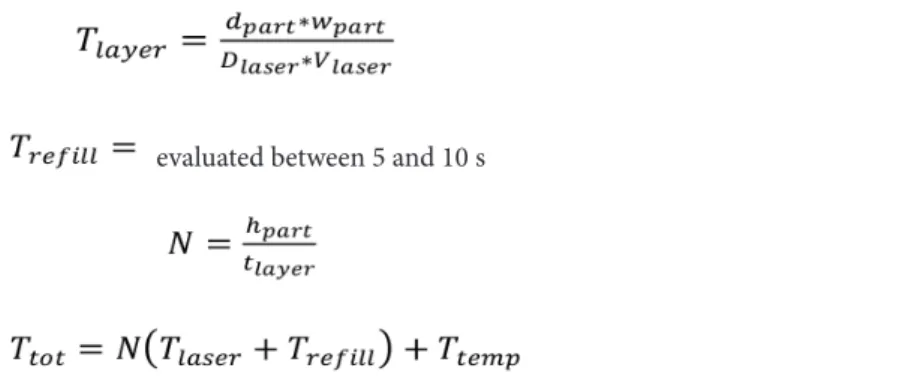
The part was represented by a parallelepiped because of the simple geometry, which helped simplify the calculations. A cycle time was calculated with the parts cross-section area, powder refill time, and the laser speed and diameter. The total (Ttot) (Eq. 4) time required per cycle is the sum of the time for the laser to scan the surface (Tlayer) (Eq. 1), which considers there is no overlap in the laser path, and the refill time (Trefill) (Eq. 2).
To calculate the time for the entire part, the cycle time is multiplied by the number of layers needed to produce the part (Eq. 3), which depends on the parts height and layer thickness.
The powder refill time was evaluated between 5 and 10 seconds per cycle, establishing a pessimistic estimative of 10 seconds for the case studied.
The time required for pre-heating the equipment before the process and the cooling time were added later to the total processing time as Ttemp. A value of 4 hours was estimated as an approximation, representing 1 hour for the heating time and 3 hours for the cooling time.
where: hpart = part height; wpart = part width; dpart = part depth; tlayer = layer thickness; Vlaser = laser speed; Dlaser = laser diameter;
N = number of layers required; Tlayer = time to create a layer; Trefill = time to refill power; Ttemp = time to adjust temperatures. The modeled situations are shown in Table 1.
Table 1. Scenarios comparison
Parameters 1 Fuel Nozz. 2 Fuel Nozz. 3 Fuel Nozz. 4 Fuel Nozz.
Part Data
height (cm) 13 13 13 13
width (cm) 5 10 15 20
depth (cm) 5 5 5 5
Machine setup
layer thick (μm) 20 20 20 20
laser diameter (μm) 90 90 90 90
laser speed (m/s) 7 7 7 7
Calc.
N of layers 6500 6500 6500 6500
deltaT to create layer (s) 4,0 7,9 11,9 15,9
deltaT to refill powder (s) 10 10 10 10
Results Total time required (s) 90794 116587 142381 168175
Total time required (h) 25,22 32,39 39,55 46,72
Comparison Expected time to make n individual parts 25,22 50,44 75,66 100,88
Reduction in time relative to individual parts 0% 56% 91% 116%
(1)
(2)
(3)
The Unitary cost analysis is shown in Table 2.
Table 2. Cost Analysis
Unitary cost (US$ per part) UC = (Clabor + Cequip. + Cmaterial)/N Values
Total labor costs (US$) Clabor = W × S × t
-Number of workers - W
-Hourly wage (US$/h) S 15.00
Total plant operating time on experiment (h) t 2857
Total equipment costs (US$) Cequip = Cenergy + Cacq
-Total energy cost (US$) Cenergy = Avgpower × M × Mu × Ecost × t
-Average power consumption (kW) Avgpower 16.2
Number of additive manufacturing machines - M
-Additive manufacturing equipment utilization (%) Mu
-Electricity costs (US$/kWh) Ecost 0.0663
Depreciation costs (US$) Cacq = (Acq/Ls) × t × M × Mu
-Acquisition and installation costs (US$) Acq 5 M
Expected life span of the equipment (hours) Ls 87600
Material costs (US$) Cmaterial = volpart × ρ × Cpowder
-Part volume (cm³) volpart 325
Material density (g/cm³) ρ 4.4
Cost of powder (US$/g) Cpowder 0.617