The Transcriptional Landscape
of the Photosynthetic Model
Cyanobacterium Synechocystis sp.
PCC6803
Miguel A. Hernández-Prieto
†, Trudi Ann Semeniuk, Joaquín Giner-Lamia & Matthias E. Futschik
Cyanobacteria exhibit a great capacity to adapt to different environmental conditions through changes in gene expression. Although this plasticity has been extensively studied in the model cyanobacterium Synechocystis sp. PCC 6803, a detailed analysis of the coordinated transcriptional adaption across varying conditions is lacking. Here, we report a meta-analysis of 756 individual microarray measurements conducted in 37 independent studies-the most comprehensive study of the Synechocystis transcriptome to date. Using stringent statistical evaluation, we characterized the coordinated adaptation of Synechocystis’ gene expression on systems level. Evaluation of the data revealed that the photosynthetic apparatus is subjected to greater changes in expression than other cellular components. Nevertheless, network analyses indicated a significant degree of transcriptional coordination of photosynthesis and various metabolic processes, and revealed the tight co-regulation of components of photosystems I, II and phycobilisomes. Detailed inspection of the integrated data led to the discovery a variety of regulatory patterns and novel putative photosynthetic genes. Intriguingly, global clustering analyses suggested contrasting transcriptional response of metabolic and regulatory genes stress to conditions. The integrated Synechocystis transcriptome can be accessed and interactively analyzed via the CyanoEXpress website (http://cyanoexpress.sysbiolab.eu).
The ability to adapt to an ever-changing environment is fundamental to successful life forms. Photosynthetic organisms, in particular, need to adjust various processes to daily changes in light intensity and nutrient availa-bility. Thus, the capacity for adaption is a prominent feature of cyanobacteria—one of the most ancient life forms, and the only prokaryotes capable of performing oxygenic photosynthesis1. Cyanobacteria have successfully
con-quered most environments on earth, showing an amazing resilience to extreme conditions. In addition to their ecological importance as primary producers, cyanobacteria have attracted considerable interest as a potential source of natural products with high commercial value, including biofuels2.
Central to the adaptation process in cyanobacteria are stimulus perception, signal transduction, and con-sequent regulation of gene expression. Much insight into the mechanisms of gene regulation in cyanobacteria has been gained through the study of Synechocystis sp. PCC 6803 (hereafter Synechocystis). Synechocystis was the first photosynthetic organism, for which the genome was completely sequenced3. The early availability of
its genome together with other advantages, such as easy genetic manipulation, fast growth, and ability to grow photo-heterotrophically, made Synechocystis a popular photosynthetic model organism. The sequencing of its genome also enabled the development of comprehensive cDNA and oligonucleotide microarrays4. As a result,
numerous genome-wide expression studies have been performed for a variety of environmental conditions. However, these studies, accessible in major public repositories5, only gave insight into how cells react to single or
a small number of related perturbations.
Integration of multiple transcriptome datasets permits a deeper understanding of how the cell regulates and coordinates the expression of genes involved in different metabolic pathways, triggered by divergent conditions. Compared to analyses performed on individual datasets, meta-analyses provide various advantages because they
Systems Biology and Bioinformatics Laboratory, Centre of Marine Sciences, University of Algarve, 8005-139 Faro, Portugal. †Present address: ARC Centre of Excellence for Translational Photosynthesis and School of Biological
Sciences, University of Sydney, NSW 2006, Australia. Correspondence and requests for materials should be addressed to M.E.F. (email: mfutschik@ualg.pt)
Received: 20 November 2015 Accepted: 09 February 2016 Published: 29 February 2016
OPEN
www.nature.com/scientificreports/
have: i) increased statistical power to detect co-expression; ii) robust in silico validation of expression profiles across studies; and, most importantly, iii) a rational basis to generate new hypotheses and to guide future exper-iments6. The first meta-analysis of transcriptomic data for Synechocystis included 163 microarray datasets on
different environmental and genetic perturbations, and identified a set of genes commonly regulated under most perturbations, referred to as the Core Transcriptional Response7. However, a more thorough meta-analysis of
expression of functionally related genes, in particular those associated with the photosynthesis, had not been carried out.
To exploit the existing wealth of Synechocystis transcriptomic data for the study of regulation of photosyn-thetic genes, we collected and integrated 756 available microarray-based transcriptome profiles from three public repositories, as the basis for the most integrative transcriptional study to date for Synechocystis. We took special care in the curation and pre-processing of these microarray data to minimize potential artifacts that might arise from the use of different microarray platforms by different laboratories. The integrated dataset composed of 722 microarrays (after curation) was clustered and examined for co-expression patterns to determine the activation and suppression of biological processes under various conditions. The global clustering of these expression data revealed significant enrichment in four functional gene clusters along the environmental perturbations analyzed: (i) Photosynthesis and respiration; (ii) General metabolism; (iii) Regulatory functions, transport and binding proteins; and (iv) Hypothetical proteins. A more focused analysis of these integrated expression data provided an unprecedented view of how the photosynthetic apparatus adapts to environmental changes in this cyanobac-terium, and how photosynthesis is co-regulated with other processes on a system level. In particular, functional categories linked with light-dependent photosynthetic reactions were examined in detail, under a variety of envi-ronmental perturbations. In addition, we inspected the co-expression patterns of components of light-dependent
versus light-independent reactions of photosynthesis with the aim to evaluate their transcriptional regulation.
Finally, we extended and enhanced CyanoEXpress (http://cyanoexpress.sysbiolab.eu)-a web-based resource for
Synechocystis transcriptomic data8-to facilitate independent analysis of the integrated expression data.
Results
Compilation and integration of gene expression datasets for Synechocystis.
The meta-analysis of microarray data generated by different research groups, using different platforms and under multiple environ-mental conditions requires a set of standardized steps to assure reliability of the derived results (Fig. 1A). TheFigure 1. Data acquisition workflow and composition of integrated gene expression data used in this study. (A) Workflow of meta-analysis from data acquisition to biological interpretation. (B) Distribution of
microarray measurements included in the integrated dataset derived from different platforms, (C) Number of expression contrasts obtained from WT (environmental) and mutant (genetic) Synechocystis, (D) Distribution of expression contrasts for different environmental conditions obtained from WT Synechocystis. WT = wild type.
compiled public data consist of 756 microarray measurements carried out on seven different microarray plat-forms (Fig. 1B). The most commonly used platform was the CyanoCHIP from Takara Institute (467 microarrays), followed by those described by Georg (78), Singh (72), von Wobeser (35), Postier (28), Zang (27), Tu (20), and Dickson (16). The vast majority of microarray measurements (ca. 86%) cover genes encoded in the Synechocystis chromosome, neglecting genes in the seven mega plasmids. Altogether, probes against 3064 common genes were present within the different platforms (see Supplementary file 1 online for a more detailed description). We only included microarray experiments for which raw data were available; this requirement permitted us to establish a standardized procedure for quality assessment and normalization (Supplementary file 1; Fig. S1–S6). Measurements that displayed persistent artifacts were excluded (see Supplementary file 1 for details). In total, 722 of the initial 756 microarray measurements were retained for meta-analysis.
The collated microarray data can be broadly divided into two types of perturbations: environmental and genetic, depending on whether the experiments were carried out with Wild Type (WT) or genetically modi-fied strains (Fig. 1C). Statistical evaluation of all collated experiments, in which transcriptional changes were measured after environmental perturbations, enabled us to define 115 different contrasts. These contrasts orig-inated either from experiments with a single time point (19) or from time series experiments (15). To facilitate interpretation, environmental contrasts were categorized based on the type of perturbation (Fig. 1D). An addi-tional 73 contrasts were defined by evaluating experiments, comparing the gene expression between deletion mutants and WT Synechocystis under different environmental conditions (Fig. 1C). Most of the included deletion mutants were defective in a member of their two-component systems, which play important roles in perception and transduction of environmental cues in prokaryotes9 or in Serine/Threonine kinases regulating functions such
as cellular motility and salt acclimation10. Table S1 provides information on different mutants represented in the
integrated dataset.
Cluster analysis of meta-data set reveals the transcriptome landscape of Synechocystis.
To study the coordinated regulation of gene expression due to different perturbations, we carried out hierarchical two-way clustering of the integrated expression data. To avoid effects related to the genomic background of the strain used in the studies, we excluded all experiments carried out using non-WT strains as these showed a dis-tinct expression pattern (Supplementary Fig. S7). This observation corroborates previous reports that suggest disruption of the two-component system, involving either the sensor histidine kinase or the response regulator, can affect the expression of a large range of genes11,12, resulting in strong phenotypes. For readers interested onthose genes, clustering of the full dataset can be explored using the CyanoEXpress website.
To facilitate exploration of clusters, we represented the variations in gene expression as a heat map (Fig. 2), which can be explored through the CyanoEXpress website by selecting only environmental perturbations. The emergence of various large swatches of the same color indicated that numerous groups of genes shared similar expression patterns over multiple contrasts (or environmental perturbations). Inspection of their correspond-ing dendrogram revealed a separation of genes into two main branches. To investigate whether this separation reflected gene function, we examined the statistical enrichment of genes with common function within these different branches, using their functional classification in Cyanobase (Table S2). Indeed, we found that the main two branches (I and II) in the dendrogram were significantly enriched in genes encoding proteins assigned to the
Figure 2. Global view of clustered differential gene expression data. Hierarchical clustering was applied to
3064 Synechocystis genes based on expression data obtained for perturbations in environmental conditions. The dendrogram at the top displays the structure of clusters produced, while the molecular functions enriched among the genes of these clusters are shown below. Positive or negative expression contrasts with the respect to the corresponding reference samples are indicted by shades of red or green, respectively.
www.nature.com/scientificreports/
categories: (I) ‘Transport and binding proteins’ and ‘Regulatory functions’; and, (II) genes linked to metabolic cat-egories (Table S3). Further division of both branches, hereafter “regulatory” and “metabolic” branches, revealed that genes belonging to the same functional sub-category tended to group together (Fig. 2).
The “regulatory” branch formed by 1715 genes is subdivided in two main clusters: A and B. Cluster A splits into three further sub-clusters: A1 (442 genes), A2 (850 genes), and A3 (423 genes). A1 is the only sub-cluster not statistically enriched in any specific functional category, although it contains genes that are part of the regulon of the Ferric uptake regulator (FurA), as described in previous work13. In contrast, sub-clusters A2 and A3 are both
significantly enriched in several categories, i.e., ‘Regulatory functions’, ‘Transport and binding proteins’, and the subcategory ‘NDH-I complex’ (denoted ‘NADH dehydrogenase’ in Cyanobase). Meanwhile, cluster B contains a large number of hypothetical proteins, with a sub-cluster enriched in genes of the subcategory ‘Hydrogenase’.
The “metabolic” branch contains 1323 genes, divided into two main clusters: C and D. Cluster C with 890 genes is enriched in genes encoding enzymes involved in general cell metabolism, including transcription, trans-lation, and amino acid synthesis. Finally, cluster D with 433 genes is significantly enriched in genes encoding subunits of the two photosystems (PSI, PSII), the cytochrome b6 f complex, the phycobilisomes (PBS), respiratory
terminal oxidases, and enzymes involved in the synthesis of tetrapyrrole compounds that are prosthetic groups in these complexes. This cluster constitutes the most important cluster for the study of the regulation of photosyn-thesis as discussed in detail below. Overall, clustering showed that the integrated data provide a powerful basis to distinguish between a variety of gene expression profiles, and that genes encoding functionally related proteins tend to group together (despite the heterogeneous origin of the datasets).
Coordinated adjustment of molecular processes under different environmental effects.
Environmental perturbations lead to activation, modulation or repression of molecular processes. Although such behavior has been extensively studied for specific conditions, how cellular processes are orchestrated under a wider range of perturbations has not been systematically addressed in Synechocystis. To assess whether there is a coordinated transcriptional response to such perturbations, we grouped the expression contrasts into 12 different classes of environmental perturbations (Table S1): high-intensity light, red-blue light, dark, copper lim-itation, iron limlim-itation, cadmium presence, carbon (C) limlim-itation, sulfate starvation, heat, cold, oxidative stress (H2O2, DCMU, DBMIB, methyl viologen), and osmotic stress (NaCl, sorbitol). Subsequently, we calculated the
Figure 3. Graphical representation of the adaptive response of molecular processes to different environmental stimuli. The heat map shows activation (as shades of red) and repression (as shades of blue)
for Synechocystis genes grouped within cellular functional categories under different types of environmental perturbations. The color intensities are defined by the calculated significance expressed as False Discovery Rates (FDR), as outlined in the Materials and Methods. Darker shades indicate a higher significance of transcriptional change. An equivalent graphical representation of the adaptive response, including all functional subcategories is provided in Supplementary Fig. S8.
significance of gene expression changes within the functional gene categories (Table S2) for each of these 12 classes. For this purpose, we ranked all contrasts, with respect to their average value within a functional category, and determined whether contrasts associated with a certain type of perturbation showed a tendency towards upper or lower ranks. To facilitate assessment of the impact of environmental perturbations on molecular pro-cesses, we performed a two-way clustering of functional categories and perturbations based on the calculated significance for activation or repression changes summarized in the Fig. 3. Inspection of the transcriptional response to these stresses at system-level revealed that osmotic, oxidative stress and blue/red light negatively affected gene expression in most categories. In contrast, heat, or iron limitation tended to increase transcription of most functional categories. An interesting effect was observed for dark conditions, where most functional categories were either highly repressed or induced in Synechocystis. This observation highlights how oscillation from photosynthetic to respiratory metabolism leads to a dramatic change in global expression, affecting almost all cellular processes.
Our results suggest that the impacts of different environmental perturbations differ in magnitude among functional categories. For example, environmental perturbations that severely affect membrane integrity, i.e., S or Fe limitation, and heat, result in the accumulation of genes encoding proteins functionally linked with the cell envelope, fatty acid and phospholipid synthesis, as well as transport and binding. Another notable adaptive pattern was observed for hydrogenase-related genes that were highly repressed under osmotic stress and induced under low C and dark conditions. A similar regulation has been previously reported for Anabaena sp. PCC 712014,
indicating conserved regulation of hydrogenase genes among different cyanobacteria groups. As expected, genes encoding enzymes associated with respiration tend to be up-regulated in cells grown in the dark, while genes encoding photosynthetic proteins are down-regulated. Transcription of genes within the functional category ‘respiratory and photosynthesis’ was induced under perturbations leading to increased levels of reactive oxygen species (Fe limitation, high light and oxidative stress; Fig. 3).
In general, genes encoding PSII subunits showed similar fluctuations to genes encoding subunits of the cytochrome b6 f complex, while adenosine triphosphate (ATP) synthase genes behaved similarly to genes
encod-ing subunits of the NDH-1 complex. Intriguencod-ingly, the functional subcategory ‘CO2 fixation’ placed closer to the
category ‘respiratory terminal oxidases’ than to the subcategories for photosynthetic complexes in the dendro-gram. Their co-regulation might be explained by the fact that both processes function as electron sinks in the electron transport chain15.
Differential regulation of photosynthetic genes upon environmental changes.
In general, we observed that transcripts of functional sub-categories related to light harvesting, electron transfer, and conversion of light into chemical energy (via ATP and NAD(P)H) undergo significantly larger quantitative changes than other functions (Table 1). Similar magnitude changes were also observed for genes in sub-categories crucial to the response to stress conditions, including the sub-categories ‘Adaptation and atypical conditions’, ‘Chaperones’, ‘Transcription’ and ‘Translation’. In contrast, some functional categories such as ‘DNA replication, restriction, modification, recombination, and repair’; ‘Regulatory functions’, and ‘Metabolism of aromatic amino acids’ showed more constitutive expression, with expression changes that were significantly smaller than expected by chance (Table 1).Given the importance of Synechocystis as a photosynthetic model organism, we investigated the regulation of photosynthetic sub-categories in response to environmental perturbations in more detail. Our approach iden-tified environmental conditions that promoted expression trends in part or in all of the genes within selected functional sub-categories. To do this, we generated ranked expression matrices and represented their results as heat maps, using the perturbations as a barcode. Using these maps, we could identify coordinated regulation across genes within a functional category, as well as the environmental perturbations that lead to their uniform transcriptional changes.
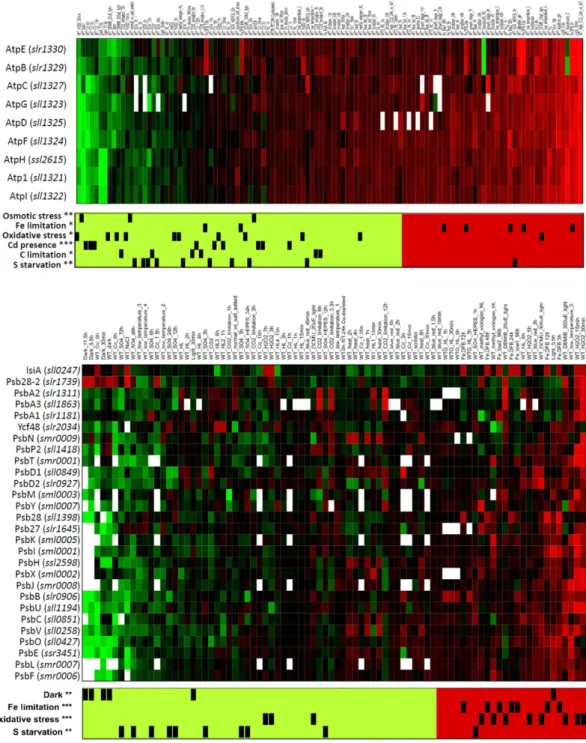
Typically, functions performed by multimeric complexes had consistent expression changes across their asso-ciated genes, indicating a strong co-regulation. This was especially the case for genes encoding subunits of the ATP synthase and PSII (Fig. 4). The gene encoding subunits of the ATP synthase were significantly repressed upon addition of cadmium, as well as under osmotic stress and sulfate limitation, consistent with previous reports16,17 (Fig. 4A). Interestingly, under Fe limitation, expression of genes associated with ATP synthase tended
to be up-regulated. In PSII, the genes encoding its subunits were up-regulated during Fe limitation or oxidative stress, and down-regulated in the dark or upon sulfate starvation. Nevertheless, two genes included in Cyanobase within the PSII subcategory had very distinct activations: the gene sll0247 encoding the Fe stress induced (IsiA) protein, and slr1739 encoding psb28-2. Both genes showed increased expression, whenever overall expression of PSII genes decreased (Fig. 4B).
In addition to the more typical homogenous expression profiles observed within functional sub-categories, we also detected categories that displayed heterogeneous profiles. In some cases, the reason for such heterogene-ity was evident, especially when chaperones or proteases involved in the assembly or degradation of functional complexes were included in a subcategory. Likely, expression of these genes is transient and is not required, once the cell has successfully adapted to new conditions. This is illustrated by the functional subcategory PBS, which includes genes, nblA1 and nblA2, encoding the subunits of a heterodimeric protease involved in its degradation, as well as cpcE, cpcF and nblB1 that code for lyases linked with both the assembly of the chromophore into the apoprotein and its degradation18 (Fig. 5). These five genes were strongly induced by high-intensity light, the
pres-ence of cadmium or sulfur starvation, when genes coding structural components of the PBS were repressed. This observation suggests that an extra subdivision might be required to de-convolute co-regulation patterns. It also might explain why the subcategory PBS did not cluster together with the photosystem complexes, the cytochrome
www.nature.com/scientificreports/
responses not included here could use the search tool in CyanoEXpress to query the expression of multiple genes at once.
Predicting genes linked to photosynthesis through co-expression analysis.
Despite being the most studied cyanobacterium, the embedding of photosynthesis in the complete cellular network to guarantee the cellular homeostasis in Synechocystis is not well understood. We expect that genes playing an important role in the coordination of photosynthesis with other cellular processes will show similarity in their expression pat-terns to photosynthetic genes indicating coordinated regulation. Thus, we identified genes whose expression is highly correlated with at least one of the eight functional sub-categories of ‘Photosynthesis and respiration’ asTable 1. Variability of gene expression in different functional categories. This table lists the average standard
deviation (Mean SD) of expression for genes associated with a particular functional category and its statistical significance (FDR) based on the comparison with the average standard deviation (Mean SDr) for random gene samples of the same size. Categories whose genes show significantly more variable expression than expected by chance are marked by shades of red (FDR < 0.01).; categories whose genes are significantly less variable than expected by chance are marked in shades of blue. Bold font indicates main functional categories, which were ordered, so that categories with significantly larger variability were placed higher in the table, while categories with significantly smaller variability were located at the bottom. While all main categories are displayed, sub-categories were only shown if they were statistically significant. The results for the entire list of 70 sub-sub-categories can be found in Supplementary Table S5, available online.
annotated in Cyanobase, but which were not associated with the same sub-category. Such genes might constitute nodal points connecting different processes in the cellular network of Synechocystis. Since the eight categories show different strength of internal co-expression, individual thresholds were set for association of genes with these categories. For instance, genes associated with the PBS tend to be tightly co-expressed, so a higher threshold was set for the ‘PBS’ sub-category than e.g. for genes associated with ‘CO2 fixation’, which tend to display weaker
co-expression (see Methods section). In total, 401 connections of genes to sub-categories of ‘Photosynthesis and respiration’ (including those between sub-categories) were found (Supplementary Table S5). Notably, we identi-fied 96 connections for PSI, PSII and PBS based on strong correlation. The corresponding genes might provide interesting starting points for future investigations, how the photosynthetic machinery is internally coordinated and linked to other processes.
Figure 4. Functional subcategories corresponding to the adenosine triphosphate (ATP) synthase (top panel) and photosystem II (PSII) complexes (bottom panel). Contrasts are sorted such that their average
value increases from left to right. Associations between contrasts and perturbation types are indicated in the barcode below the heat maps. Only perturbations for which the associated contrasts show significant deviation from a random distribution are displayed. The significance is indicated by stars: *** for p-value < 0.001, ** for p-value < 0.01, and *for p-value < 0.05.
www.nature.com/scientificreports/
Figure 5. Heat map of the genes grouped under the functional subcategory ‘Phycobilisome’. Contrasts
are sorted, such that their average value increases from left to right. Associations between contrasts and perturbation types are indicated in the barcode below the heat map. Only perturbations, for which the associated contrasts showed significant derivation from the distribution expected by chance, are displayed. Significance is indicated by stars: ** for p-value < 0.01, and * for p-value < 0.05.
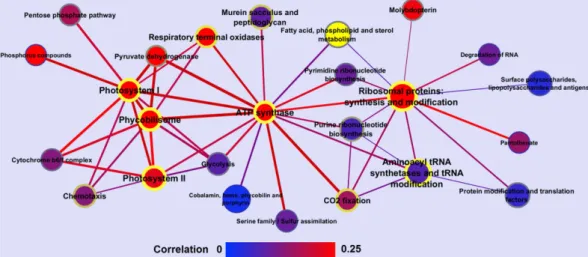
Figure 6. Network of molecular processes based on co-expression. Nodes represent molecular processes,
while edges represent the calculated average Spearman correlation between the associated genes. The size of the nodes is proportional to the number of genes associated with a particular process. Node and edge colors represent the average correlation of genes within and between processes, with respect to a gradient color bar from blue to red. Font size and color of node border (blue to yellow) indicate the z-score for the average co-expression of genes within the same processes, while the widths of edges indicate the log odds of observing highly correlated gene pairs between two processes.
Discussion
Given Synechocystis’ importance to our understanding of photosynthesis and its potential for biotechnological applications, we sought to resolve its transcriptional landscape by evaluating gene expression across a diverse range of environmental conditions. In general, we found a highly coordinated transcriptional adaption of
Synechocystis to environmental stress conditions, covering a variety of processes. To help visualize the level of
co-transcription of the different functional categories, we created a network using the expression correlation between the genes within each category (Fig. 6). Notably, some processes seemed to play a more central role in the cell, having more interconnections with other functional categories. Indeed, our network shows PSI, PSII, PBS, ATP synthase, and the ribosomal proteins as central nodes, sharing regulatory mechanisms with components of various other functional categories. Intriguingly, these central functions are also among those with the highest variability in expression (Table 1; see also Table S4 for a more complete listing). Moreover, we see highly signifi-cant co-expression of photosynthesis, ATP synthase, and translation, demonstrating a tight coordination between the photosynthetic apparatus and protein synthesis (Fig. S8). This representation points to a dynamic core of essential functions that undergo extensive transcriptional reprogramming under stress conditions, but still serve as central connectors of the cellular network.
A more detailed view of the coordination of individual photosynthetic components can be found in the clustering of the 115 expression contrasts for environmental perturbations, which resolved the pool of tran-scripts into four main gene clusters (Fig. 2). Functional enrichment analyses of these clusters revealed a region (cluster D in Fig. 2), where genes associated with photosynthesis and respiration were significantly more abun-dant. Remarkably, the structure of this cluster closely reflected the known light dependency of reactions, in which these genes participate. More specifically, genes encoding subunits of complexes traditionally classified as part of the “light-dependent” photosynthetic reactions, PSI, PSII, PBS, and the cytochrome b6 f complex
were grouped together, showing evident co-regulation under different environmental perturbations. In con-trast, genes encoding the central enzymatic complex of the “light-independent” photosynthetic reactions and the ribulose-1,5-bisphosphate carboxylase/oxygenase (RuBisCo) complex formed a separate cluster, together with genes known to be up-regulated under CO2 limiting conditions (Supplementary Fig. S9). In the following
Figure 7. Clusters containing genes encoding photosystem II subunits. The clusters correspond to regions
of the global cluster shown in Fig. 2 (a thumbnail image of the global cluster is shown on the left to localize the clusters discussed in the text). The gene names have been colored to facilitate the visualization of genes encoding proteins for different photosynthetic complexes, with PSII in green, PSI in blue, PBS in purple, Cyt. b6 f in
orange, and other categories in black. The gene associations arose through comparison of all the samples using wild-type strains grown under different environmental perturbations. Cluster E containing psba3 and psba2 genes encoding the PSII reaction center D1 protein. Clusters F and G significantly enriched in genes encoding subunits of different photosynthetic complexes. Color bars positioned under the different contrasts indicate modification of the same environmental factor; S: Sulfate starvation, C: Carbon limitation, HL: High-intensity light, Oxidative: Oxidative stress, Cold: Low temperature, Fe: Iron limitation. Other conditions discussed in the text were trimmed for publication.
www.nature.com/scientificreports/
discussion, we illustrate how gene clusters can be used to clarify the regulation of key photosynthetic genes, and to connect components and gene families associated with photosynthesis, based on their co-expression.
One of the most important factors determining the expression levels of photosynthetic genes appears to be oxidative stress. This is especially true for PSII, which has been shown to be the main source of reactive oxy-gen species, as well as the most frequent target of photodamage19. Our analysis shows that PSII-related genes
are up-regulated under conditions of high oxidative stress, including high-intensity light and Fe limitation, but repressed under dark conditions (Fig. 3). The reason behind the increased transcription of genes encoding PSII subunits under oxidative stress seems to be the higher PSII repair rate under these conditions19–21. In fact, it has
been frequently observed that genes encoding the D1 subunit of PSII accumulate under high-intensity light22,23.
The Synechocystis genome contains gene duplications for two of the four PSII core subunits, with three gene cop-ies for D1 (psbA1, psbA2, psbA3) and two for D2 (psbD1, psbD2). Interestingly, while it has been reported that the different psbA alleles are regulated differently24–26, inspection of the integrated expression data revealed an overall
similarity in their transcriptional changes (Fig. 7). Nevertheless, under conditions where oxygen is not limiting, only D1 proteins encoded by psbA2 or psbA3 genes have been detected24,27. Analysis of single mutants lacking
one of these two genes showed that they are able to replace each other, without obvious phenotypic differences22.
Consistent with these observations, a high degree of expression correlation between psbA2 and psbA3, compared to all other PSII subunits was observed (Fig. 7; cluster E). The independent clustering of psbA2 and psbA3 from other genes encoding structural PSII subunits (Fig. 7; cluster F and cluster G) is probably due to the high turno-ver of D1 under stress conditions compared with other subunits, and the capacity of the cell to substitute it at a monomer level21,28. It also indicates a regulatory mechanism at transcriptional level that is distinct from those for
other PSII subunits.
We also detected a large cluster (part of cluster D in Fig. 2) containing 43 genes: 15 genes coding for PSII sub-units, 8 genes coding for PSI subsub-units, 3 genes coding for cytochrome b6 f, 12 genes coding subunits of the PBS
antenna, and 3 genes with no annotated function (sll1638, ssl2384, sgl0002) (Fig. 7; cluster G). Notably, this large cluster did not include the genes sll0849 and slr0927, encoding the inner core PSII subunit D2 or the genes encod-ing the inner antennae CP47 (slr0906) and CP43 (sll0851). Instead, these genes clustered together with others, forming a separate group of 13 genes (Fig. 7; cluster F), along with smr0009 encoding the PSII subunit PsbN, two genes encoding cytochrome b6 f subunits, two encoding the PSI core subunits PsaA and PsaB, and four encoding
proteins with no annotated function (slr1634, slr1970, ssr3341, ssl2595).
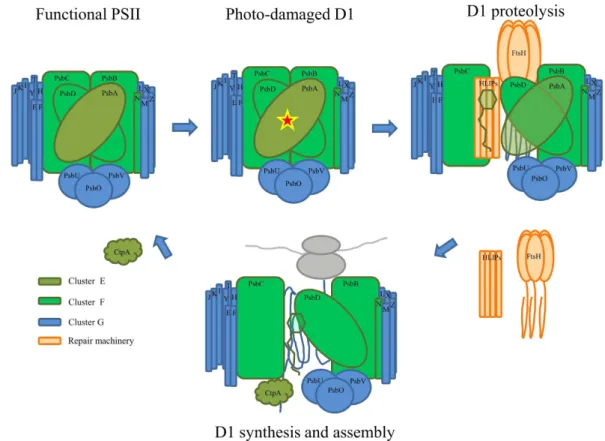
Figure 8. Potential model of the repair cycle of a photo-damaged D1 protein. The exposure of cells to stress
conditions in the presence of light often results in irreversible oxidation of D1, which subsequently needs to be replaced. In the repair process, several proteases and chlorophyll-binding proteins are recruited at different stages, as previously suggested39,40. The observed co-expression suggests a cooperative role of FtsH proteases
and high-light induced proteins (HLIPs) in the D1 proteolysis, as indicated in the scheme. The color of the different subunits and recruited proteins symbolizes their pertinence to differently regulated gene clusters.
The tight clustering of seven functionally unannotated genes (from clusters F and G) with known components of the photosynthetic apparatus suggests a potential functional association of these genes with photosynthesis. Indeed, bibliographic and database searches carried out for these unannotated genes support this hypothesis. For example, of the three unannotated genes in cluster G, sll1638, although not annotated in Cyanobase, encodes the PsbQ subunit of PSII29. The other two genes encode putative membrane-bound proteins, with two (ssl2384)
and one (sgl0002) predicted hydrophobic domains, implying a possible location in the thylakoid membrane. Furthermore, sgl0002 is located in the same orientation and genomic region as sml0004 encoding the cytochrome
b6 f subunit VIII30. Intriguingly, within the unannotated set in cluster F, we detected the operon formed by slr1970
and ssr3341, with the latter encoding an Hfq homolog related to degradation of non-coding RNAs and cell motil-ity31, but no reported previous links to photosynthesis (Fig. 7; cluster F). Of the other two unannotated genes in
cluster F, ssl2595 is encoded in adjacent position on the chromosome, but in opposed direction to psbN, which is located in the sister branch of the dendrogram, due to the high expression correlation between both genes. These examples indicate that the association of genes in clusters can be used to uncover novel genes associated with photosynthesis.
The separation of various photosynthetic components into different clusters suggests different sets of regula-tory factors for assembly and maintenance of PSI and PSII. We found members of two gene families (FtsH pro-teases and high-light induced proteins; HLIPs) placed in the same cluster. It is well known that FtsH propro-teases are required under stress conditions to repair or assemble subunits of damaged PSII. For example, mutants defective in FtsH2 (slr0228) exhibit an increased sensitivity to high-intensity light32 and UV-B light33, probably because of
inefficient repair of photodamaged PSII. Both FtsH2 and FtsH3 (slr1604) have been co-purified by pull-down assays, with PSII complexes32,34. Recent evidence has shown FtsH3 to be an essential component of isolated FtsH
hetero-oligomeric complexes, partnering not only FtsH2, but also FtsH1 (slr1390)35. Notably, after exposure to
high light, HLIPs were co-isolated with PSII and FtsHs36–38. Co-purification of PSII with HLIP, FtsH2, FtsH3,
and FtsH4 under native conditions indicated that HLIPs might perform a protective role during PSII biogenesis under stress39–41. If this is the case, and both gene families are required for an efficient assembly of PSII, then a
co-transcriptional regulation can be expected. Indeed, we observed similar transcription profiles of genes encod-ing FtsH2, FtsH3, HliC (ssl1633), HliA (ssl2542), and HliB (ssr2595) under different environmental conditions (Fig. S10; cluster H). The cluster structure appears to correspond well with results from pull-down experiments involving tagged HLIPs under native conditions. Physical interaction between these proteins, together with the results of our hierarchical clustering, reinforces the idea of a complementary role for these two families during PSII assembly (Fig. 8).
Another indication provided by the clustering is the potential co-assembly of both photosystems. Co-regulation, inferred by the clustering of genes encoding PSI and PSII subunits (Figs 2 and 6), supports the idea that there is an intermediate assembly unit formed by PSII and PSI subunits42,43. Such a putative assembly unit
would facilitate the quenching of absorbed solar energy during the assembly or repair of both complexes, miti-gating photo-damage. This idea originates from pull-down experiments and native separation of Psb27 (slr1645) containing complexes, which co-purified CP43 bound to PSI subunits44. Our results also point to a functional
connection, since the expression profile for psb27 closely resembled that of slr0171 (ycf37) (Fig. S10; cluster J), for which the corresponding protein contributes to assembly and stabilization of PSI complexes45,46. Likewise,
the co-transcription of psbN with genes encoding core subunits of both PSII and PSI (Fig. 7; cluster F) reinforces findings described in tobacco plants, suggesting PsbN is required for the biogenesis of both PSI and PSII47.
The classical photosynthetic reaction is complete, when chemical energy in the form of ATP and NAD(P) H produced during light-dependent reactions is used to incorporate inorganic carbon (CO2) into organic
back-bones. This reaction is catalyzed by the RuBisCo complex. RuBisCo is composed of several copies of two subunits encoded by slr0012 (RbcL-large subunit), and slr0009 (RbcS-small subunit); its assembly is mediated by the prod-uct of slr0011 (RbcX), annotated as a “possible RuBisCo chaperon”48. Our results show that genes of the RuBisCo
operon belong to a large cluster formed by multiple genes coding for proteins involved in CO2 assimilation,
including subunits of the NDH-1 complex (Fig. S9)49. Nevertheless, notable differences in expression patterns
between well-known CO2 regulated genes and the RuBisCo operon exist under some conditions, such as iron or
sulfate limitation, suggesting that distinct regulatory factors are influencing the expression of these genes under specific conditions (Fig. S9). This suggests that regulation of RuBisCo is primarily modulated by cellular CO2
con-centration, rather than by the status of other photosynthetic complexes. Therefore, we propose that the regulatory factors behind regulation of the light-independent photosynthetic reaction are distinct from those of the main players involved in light-dependent photosynthetic reactions.
Another application of the integrated Synechocystis transcriptome is the elucidation how the different compo-nents of the photosynthesis apparatus are coordinated with each other and with other cellular processes (Table S5). In fact, we found various examples of strongly correlated gene pairs that indicate functional connections between photosynthesis and other functional categories. For instance, sll1184 encoding the heme oxygenase (ho1), which is associated with the functional category ‘Cobalamin, heme, phycobilin and porphyrin, is strongly cor-related (median correlation = 0.72) with the functional sub-category PBS. Such a strong correlation is not unex-pected, since Ho1 is a key enzyme in the synthesis of the chromophore part of the phycobilisomes50. Besides
heme-oxygenase other 6 genes part of the category “Cobalamin, heme, phycobilin and porphyrin” show a signif-icant correlation with this category, indicating the existence of common regulatory factors that will aim to ensure an adequate supply of chromophore to the protein scaffold. Similar connections were established between genes encoding PSI subunits, i.e., slr0737 (psaD), PSII and the PBS category. Besides the known functional connection between PSI, PSII and PBS51,52, this indicates tightly coordinated regulation in the assembly of light-dependent
complexes.
Although examples described here demonstrate the value of an integrated Synechocystis’ transcriptome, it is important to acknowledge that, caution is required in the interpretation of results from meta-analysis, such as
www.nature.com/scientificreports/
the one presented here. Firstly, the expression datasets were generated in different laboratories using different
Synechocystis wild-type strains. Additionally, so called “normal” or “standard” conditions have variations between
different experiments (Table S6). To minimize the influence of such variations, as well as other potential latent variables, we formulated statistical linear models for the reference designs applied in the original studies and derived well-defined expression contrasts. However, non-linear effects, such as those observed in epistasis, would not be fully captured by this approach and may contribute to the observed variation in gene expression. Despite this, the variation between experimental set-ups can help us to assess the fidelity of observed co-expression pat-terns. For instance, patterns that are observed across many different experiments and platforms can be considered as more robust, and tend to be more biologically meaningful6,53. Nevertheless, critical inspection is warranted,
especially when conclusions are mainly based on a small subset of the collected transcriptome data.
Therefore, to facilitate visualization and critical inspection of the integrated Synechocystis’ transcriptome, we implemented CyanoEXpress (http://cyanoexpress.sysbiolab.eu.), a database with a web-interface based on the GeneXplorer software54. It enables other researchers to carry out similar investigations, as we presented here for
PSII. CyanoEXpress includes all collated and integrated genome-wide expression data, as well as information regarding samples, their origins, and associated publications. It can assist researchers in the characterization and functional annotation of genes using the guilty-by-association principle, and might also be helpful to determine the underlying regulatory networks. We anticipate that our meta-analyses together with the CyanoEXpress data-base will contribute to a better understanding of regulation of photosynthesis and its coordination with other processes on a systems level, as well as help to establish Synechocystis as a photosynthetic model organism for systems and synthetic biology studies.
Methods
Microarray data collection.
Genome-wide expression data for Synechocystis were retrieved from three data repositories: NCBI Gene Expression Omnibus (GEO) (22 datasets), KEGG Expression database (13 datasets), and EBI ArrayExpress (2 datasets). These datasets were generated using seven distinct platforms, designated either by their commercial name (CyanoCHIP)4 or by the first author whom described their design in the literature(i.e., Postier, Tu, Singh, Zhang, Georg, and Dickson)16,55–59. These datasets comprise measurements of expression
changes caused by variations in different environmental factors, including light intensity and quality (UV-B, red versus blue light), temperature, availability of nutrients (deprivation of CO2, SO42−, Cu2+, Fe2+; excess of
Fe2+, Zn2+, and presence of Cd2+), concentration of atmospheric O
2, induced oxidative stress (through H2O2,
DCMU, DBMIB, or methyl viologen), and osmotic stress (through NaCl, or sorbitol). Our analysis is not limited to experiments only using WT Synechocystis, but also includes microarray measurements that compared the gene expression of mutants with WT after different treatments. Such datasets were mainly derived from two-color microarrays (N = 29), with the exception of six datasets using Agilent58 or NimbleGen microarrays59. The
differ-ent microarray platforms are described in more detail in the Supplemdiffer-entary Text. Protein-coding gene names, description and functional categories were extracted from Cyanobase (http://genome.kazusa.or.jp/cyanobase/)60.
Data normalization and differential expression analysis.
Microarray data were pre-processed and analyzed using R statistical language and various Bioconductor packages. All dual-channel microarray datasets were individually imported and normalized by optimized intensity-dependent normalization (OIN), based on iterative regression of log fold changes with respect to average log spot intensities61. Single-channel microarrayswere analyzed using functions from the limma package, i.e., the normexp function for background correction, and quantile normalization to adjust signal intensities for each experiment. Intensities from spots corresponding to the same genomic feature were averaged to obtain a value per gene per array. For each of the collected microar-ray experiments, a linear model was designed based on the sample annotation and evaluated using the lmFit function62. The use of explicit models allowed us to define stringent statistical contrasts, which were evaluated for
each experiment. These contrasts facilitated comparison of samples for a defined condition (perturbation) with those for the reference condition. For instance, a contrast arises through comparison of gene expression level of a culture grown under high-intensity light compared with one grown under “normal” conditions measured by rep-licate arrays. Generally, measurements of WT Synechocystis under “normal” conditions were used as a reference. It should be noted that these so called “normal” or “standard” can vary between experiments. Table S6 provides an overview of the normal and treatment conditions for the different studies included in the database. Time spans for time-series experiments ranged from 15 min to 4 d, after perturbation. Measurements at individual time points were retained to maximize information, rather than averaging over each time series, and samples at time point 0 were used as reference. Altogether, 115 contrasts were defined for comparisons involving only WT Synechocystis gene expression, while 73 contrasts were defined for comparisons between mutant and WT Synechocystis gene expressions.
Hierarchical clustering.
For hierarchical two-way clustering (i.e., simultaneous clustering of genes and samples), we used the software Cluster 3.063. Clustering was based on complete linkage, using Spearman Rankcorrelation as a similarity measure. We carried out clustering only for genes, for which expression values were present for at least 80% of the contrasts. Clusters were visualized using Java TreeView software64. Differential
expression was displayed as heat maps, using the color range from green to red, with shades of green indicating negative, and shades of red indicating positive expression changes with respect to the reference sample. No differ-ences in expression are indicated by black, while grey represents missing data. Dendrograms attached to the heat maps display the cluster structure, with the length of the branches used as a measure of the similarity between genes, based on their expression. For the statistical enrichment analysis, we used the hypergeometric test (an equivalent of Fisher´s exact test), as implemented in R.
Effects of environmental conditions on expression of molecular functions.
To evaluate whether genes associated with a certain functional category (as defined in Cyanobase, and reproduced in Table S2) show characteristic expression changes for similar environmental conditions, we grouped microarray experiments (and the corresponding expression contrasts) into 12 classes based on their perturbation type (e.g., Fe limitation, oxidative stress, CO2 limitation). Experiments performed with mutant strains were excluded from this analysis.Datasets per class are listed in Table S1. For statistical evaluation, the mean gene expression value was calculated for genes linked to the same molecular function (such as PBS). A minimum number of five genes per functional category were required to include a category in this analysis. The individual contrasts (derived earlier in the differ-ential gene expression analysis) were ranked according to their mean expression values. Subsequently, a Wilcoxon rank sum test was applied to assess whether the contrasts associated with each class showed a trend towards high or low expression level within the ranked microarrays. Resulting p-values were converted to false discovery rates (FDR) through the Benjamini-Hochberg procedure. Subsequently, FDR were used to cluster both functional categories and perturbation classes. To perform clustering, “significance vectors” were constructed for each cate-gory, with values ranging from −1 to + 1 for each perturbation class. The values were calculated as follows: FDR corresponding to repression were multiplied by (−1) and added to (−1), whereas FDR corresponding to activa-tion were subtracted from (+1). Thus, perturbaactiva-tions that led to a highly significant activaactiva-tion are represented by values close to (+1), while perturbations that led to a highly significant repression are represented by values close to (−1). These significance vectors were merged into a matrix and a two-way hierarchical clustering of functional categories and perturbation classes was carried out.
Variability of gene expression within sub-categories.
To assess the variability of gene expression within different sub-categories, we calculated the standard deviation of expression of each gene. Subsequently, the average was computed for all genes associated with a particular sub-category in Cyanobase. The statistical significance of the observed values was obtained through comparison with the expected normal background distribution based on 1000 randomized gene sets of the same size. P-values were calculated from the z-scores of the observed average values and converted to FDR.Co-expression network of functional categories.
A co-expression network of functional catego-ries was generated by first calculating the Spearman correlation for each pair of genes based on the integrated expression data (Table S7). This gene network was then converted into a co-expression network of functional sub-categories defined in Cyanobase. For this purpose, the mean correlation between genes included in the same category was computed for each category. Similarly, the mean correlation was computed for all possible pairs of functional categories by averaging over the correlation of corresponding gene pairs, i.e., the correlation of genes associated with different categories. To obtain a measure for the strength of co-expression, the z-scores for the mean correlation values within and between categories were calculated based on the mean and standard devi-ation of the total set of observed correldevi-ations. Additionally, log odds were calculated for the presence of highly correlated gene pairs among all gene pairs within a category or between categories. Gene pairs were considered highly correlated, if their correlation coefficient was among the top 10% of all correlation coefficients. To generate Fig. 6, only edges with a z-score of greater than 7 were retained, resulting in a network of 25 nodes and 47 edges.Detection of co-expression of genes associated with different functional categories.
To detect genes, that were highly transcriptionally co-regulated with gene associated with 8 functional sub-categories of ‘Photosynthesis and Respiration’ (i.e. ‘Atp synthase’,‘CO2 fixation’, ‘Cytochrome b6 f complex’, ‘NADHdehydro-genase’, ‘PSI’, ‘PSII’, ‘PBS’ and ‘Respiratory terminal oxidases’), we compared the median pair-wise correlation between genes. More specifically, we calculated first the median correlation of genes within one of the eight specific sub-categories with other genes of the same sub-category and then derived a threshold, so that 80% of the calculated correlation coefficients were below. This leads to individual thresholds for the sub-category indi-cating their internal co-expression. For ‘CO2 fixation’ and ‘NADH dehydrogenase’, a higher threshold (90%) was
set, since the internal co-expression tend to be relatively weak. Subsequently, median pair-wise correlation was calculated for each Synchocystis gene with genes of the eight selected sub-categories and compared to the relevant thresholds. Genes whose correlation passed the thresholds can be found in Supplementary Table S5.
References
1. Rasmussen, B., Fletcher, I. R., Brocks, J. J. & Kilburn, M. R. Reassessing the first appearance of eukaryotes and cyanobacteria. Nature 455, 1101–1104 (2008).
2. Heidorn, T. et al. Synthetic Biology in Cyanobacteria: Engineering and Analyzing Novel Functions. Methods in Enzymology, Vol 497:
Synthetic Biology, Methods for Part/Device Characterization and Chassis Engineering, Pt A 497, 539–579 (2011).
3. Kaneko, T. et al. Sequence Analysis of the Genome of the Unicellular Cyanobacterium Synechocystis sp. Strain PCC6803. II. Sequence Determination of the Entire Genome and Assignment of Potential Protein-coding Regions. DNA Res. 3, 109–136 (1996). 4. Hihara, Y., Kamei, A., Kanehisa, M., Kaplan, A. & Ikeuchi, M. DNA microarray analysis of cyanobacterial gene expression during
acclimation to high light. Plant Cell 13, 793–806 (2001).
5. Hernández-Prieto, M. A., Semeniuk, T. A. & Futschik, M. E. Towards a systems-level understanding of gene regulatory, protein interaction, and metabolic networks in cyanobacteria. Front Genet., doi: 10.3389/fgene.2014.00191 (2014).
6. Steele, E. & Tucker, A. Consensus and Meta-analysis regulatory networks for combining multiple microarray gene expression datasets. J Biomed Inform 41, 914–926 (2008).
7. Singh, A. K. et al. Integrative analysis of large scale expression profiles reveals core transcriptional response and coordination between multiple cellular processes in a cyanobacterium. BMC Syst Biol 4, 105 (2010).
8. Hernandez-Prieto, M. A. & Futschik, M. E. CyanoEXpress: A web database for exploration and visualisation of the integrated transcriptome of cyanobacterium Synechocystis sp. PCC6803. Bioinformation 8, 629–633 (2012).
9. Mizuno, T., Kaneko, T. & Tabata, S. Compilation of all genes encoding bacterial two-component signal transducers in the genome of the cyanobacterium, Synechocystis sp. strain PCC 6803. DNA Res. 3, 407–414 (1996).
www.nature.com/scientificreports/
10. Liang, C. et al. Serine/Threonine Protein Kinase SpkG Is a Candidate for High Salt Resistance in the Unicellular Cyanobacterium Synechocystis sp. PCC 6803. PLoS ONE 6, e18718 (2011).
11. van Waasbergen, L. G., Dolganov, N. & Grossman, A. R. nblS, a gene involved in controlling photosynthesis-related gene expression during high light and nutrient stress in Synechococcus elongatus PCC 7942. J. Bacteriol. 184, 2481–2490 (2002).
12. Paithoonrangsarid, K. et al. Five Histidine Kinases Perceive Osmotic Stress and Regulate Distinct Sets of Genes in Synechocystis. J.
Biol. Chem. 279, 53078–53086 (2004).
13. Hernandez-Prieto, M. A. et al. Iron deprivation in Synechocystis: inference of pathways, non-coding RNAs, and regulatory elements from comprehensive expression profiling. G3 (Bethesda) 2, 1475–1495 (2012).
14. Ehira, S., Ohmori, M. & Sato, N. Identification of Low-temperature-regulated ORFs in the cyanobacterium Anabaena sp. strain PCC 7120: distinguishing the effects of low temperature from the effects of photosystem II excitation pressure. Plant Cell Physiol. 46, 1237–1245 (2005).
15. Lea-Smith, D. J. et al. Thylakoid terminal oxidases are essential for the cyanobacterium Synechocystis sp. PCC 6803 to survive rapidly changing light intensities. Plant Physiol. 162, 484–495 (2013).
16. Zhang, Z., Pendse, N. D., Phillips, K. N., Cotner, J. B. & Khodursky, A. Gene expression patterns of sulfur starvation in Synechocystis sp. PCC 6803. BMC Genomics 9, 344 (2008).
17. Houot, L. et al. Cadmium triggers an integrated reprogramming of the metabolism of Synechocystis PCC6803, under the control of the Slr1738 regulator. BMC Genomics 8, 350 (2007).
18. Baier, K., Nicklisch, S., Grundner, C., Reinecke, J. & Lockau, W. Expression of two nblA-homologous genes is required for phycobilisome degradation in nitrogen-starved Synechocystis sp. PCC6803. FEMS Microbiol. Lett. 195, 35–39 (2001).
19. Aro, E.-M., Virgin, I. & Andersson, B. Photoinhibition of Photosystem II. Inactivation, protein damage and turnover. Biochim.
Biophys. Acta 1143, 113–134 (1993).
20. Herranen, M., Aro, E.-M. & Tyystjärvi, T. Two distinct mechanisms regulate the transcription of photosystem II genes in Synechocystis sp. PCC 6803. Physiol. Plant. 112, 531–539 (2001).
21. Nixon, P. J., Michoux, F., Yu, J., Boehm, M. & Komenda, J. Recent advances in understanding the assembly and repair of photosystem II. Ann. Bot. 106, 1–16 (2010).
22. Mohamed, A. & Jansson, C. Influence of light on accumulation of photosynthesis-specific transcripts in the cyanobacterium Synechocystis 6803. Plant Mol. Biol. 13, 693–700 (1989).
23. Pollari, M., Ruotsalainen, V., Rantamäki, S., Tyystjärvi, E. & Tyystjärvi, T. Simultaneous Inactivation of Sigma Factors B and D Interferes with Light Acclimation of the Cyanobacterium Synechocystis sp. Strain PCC 6803. J. Bacteriol. 191, 3992–4001 (2009). 24. Mohamed, A., Eriksson, J., Osiewacz, H. & Jansson, C. Differential expression of the psbA genes in the cyanobacterium
Synechocystis 6803. Mol. Gen. Genet. 238, 161–168 (1993).
25. Sakurai, I. et al. Positive Regulation of psbA Gene Expression by cis-Encoded Antisense RNAs in Synechocystis sp. PCC 6803. Plant
Physiol. 160, 1000–1010 (2012).
26. Salih, G. F. & Jansson, C. Activation of the silent psbA1 gene in the cyanobacterium Synechocystis sp strain 6803 produces a novel and functional D1 protein. Plant Cell 9, 869–878 (1997).
27. Summerfield, T. C., Toepel, J. & Sherman, L. A. Low-oxygen induction of normally cryptic psbA genes in cyanobacteria.
Biochemistry 47, 12939–12941 (2008).
28. Vermaas, W. et al. Turnover of the D1 protein and of Photosystem II in a Synechocystis 6803 mutant lacking Tyrz. Photosynthesis
Res. 45, 99–104 (1995).
29. Summerfield, T. C., Shand, J. A., Bentley, F. K. & Eaton-Rye, J. J. PsbQ (Sll1638) in Synechocystis sp. PCC 6803 is required for photosystem II activity in specific mutants and in nutrient-limiting conditions. Biochemistry 44, 805–815 (2005).
30. Schneider, D., Volkmer, T. & Rögner, M. PetG and PetN, but not PetL, are essential subunits of the cytochrome b6f complex from Synechocystis PCC 6803. Res. Microbiol. 158, 45–50 (2007).
31. Dienst, D. et al. The cyanobacterial homologue of the RNA chaperone Hfq is essential for motility of Synechocystis sp. PCC 6803.
Microbiology 154, 3134–3143 (2008).
32. Silva, P. et al. FtsH is involved in the early stages of repair of photosystem II in Synechocystis sp PCC 6803. Plant Cell 15, 2152–2164 (2003).
33. Cheregi, O., Sicora, C., Kos, P., Nixon, P. & Vass, I. The FtsH protease is required for the repair of Photosystem II in the cyanbacterium Synechocystis 6803 damaged UV-B radiation. BMC Plant Biol., doi: 10.1186/1471-2229-5-S1-S8 (2005).
34. Kashino, Y. et al. Characterization of purified His-tagged CP47-containing photosystem II complexes from a cyanobacterium, Synechocystis sp. PCC 6803. Science Access, doi: 10.1071/SA0403493 (2004).
35. Krynická, V. et al. Two essential FtsH proteases control the level of the Fur repressor during iron deficiency in the cyanobacterium Synechocystis sp. PCC 6803. Mol. Microbiol. 94, 609–624 (2014).
36. Promnares, K. et al. Cyanobacterial small chlorophyll-binding protein ScpD (HliB) is located on the periphery of photosystem II in the vicinity of PsbH and CP47 subunits. J. Biol. Chem. 281, 32705–32713 (2006).
37. Yao, D. et al. Localization of the small CAB-like proteins in photosystem II. J. Biol. Chem. 282, 267–276 (2007).
38. Kufryk, G. et al. Association of small CAB-like proteins (SCPs) of Synechocystis sp. PCC 6803 with Photosystem II. Photosynthesis
Res. 95, 135–145 (2008).
39. Hernandez-Prieto, M. A. et al. The small CAB-like proteins of the cyanobacterium Synechocystis sp. PCC 6803: their involvement in chlorophyll biogenesis for Photosystem II. Biochim. Biophys. Acta 1807, 1143–1151 (2011).
40. Yao, D. C., Brune, D. C., Vavilin, D. & Vermaas, W. F. Photosystem II component lifetimes in the cyanobacterium Synechocystis sp. strain PCC 6803: small Cab-like proteins stabilize biosynthesis intermediates and affect early steps in chlorophyll synthesis. J. Biol.
Chem. 287, 682–692 (2012).
41. Knoppova, J. et al. Discovery of a chlorophyll binding protein complex involved in the early steps of photosystem II assembly in Synechocystis. Plant Cell 26, 1200–1212 (2014).
42. Wegener, K. M. et al. High Sensitivity Proteomics Assisted Discovery of a Novel Operon Involved in the Assembly of Photosystem II, a Membrane Protein Complex. J. Biol. Chem. 283, 27829–27837 (2008).
43. Kubota, H. et al. Purification and characterization of photosystem I complex from Synechocystis sp. PCC 6803 by expressing histidine-tagged subunits. Biochim. Biophys. Acta 1797, 98–105 (2010).
44. Komenda, J. et al. The Psb27 assembly factor binds to the CP43 complex of Photosystem II in the cyanobacterium Synechocystis sp. PCC 6803. Plant Physiol. 158, 476–486 (2012).
45. Dühring, U., Ossenbühl, F. & Wilde, A. Late Assembly Steps and Dynamics of the Cyanobacterial Photosystem I. J. Biol. Chem. 282, 10915–10921 (2007).
46. Jackson, S. A., Hervey, J. R. D., Dale, A. J. & Eaton-Rye, J. J. Removal of both Ycf48 and Psb27 in Synechocystis sp. PCC 6803 disrupts Photosystem II assembly and alters QA− oxidation in the mature complex. FEBS Lett. 588, 3751–3760 (2014).
47. Krech, K. et al. Reverse genetics in complex multigene operons by co-transformation of the plastid genome and its application to the open reading frame previously designated psbN. The Plant Journal 75, 1062–1074 (2013).
48. Saschenbrecker, S. et al. Structure and Function of RbcX, an Assembly Chaperone for Hexadecameric Rubisco. Cell 129, 1189–1200 (2007).
49. Battchikova, N., Eisenhut, M. & Aro, E.-M. Cyanobacterial NDH-1 complexes: Novel insights and remaining puzzles. Biochim.
50. Richaud, C. & Zabulon, G. The heme oxygenase gene (pbsA) in the red alga Rhodella violacea is discontinuous and transcriptionally activated during iron limitation. Proc. Natl. Acad. Sci. USA 94, 11736–11741 (1997).
51. Liu, H. et al. Phycobilisomes Supply Excitations to Both Photosystems in a Megacomplex in Cyanobacteria. Science 342, 1104–1107 (2013).
52. Watanabe, M. et al. Attachment of phycobilisomes in an antenna–photosystem I supercomplex of cyanobacteria. Proc. Natl. Acad.
Sci. USA 111, 2512–2517 (2014).
53. Russ, J. & Futschik, M. E. Comparison and consolidation of microarray data sets of human tissue expression. BMC Genomics 11, 305 (2010).
54. Rees, C., Demeter, J., Matese, J., Botstein, D. & Sherlock, G. GeneXplorer: an interactive web application for microarray data visualization and analysis. BMC Bioinformatics 5, 141 (2004).
55. Postier, B. L. et al. The construction and use of bacterial DNA microarrays based on an optimized two-stage PCR strategy. BMC
Genomics 4, 23 (2003).
56. Tu, C. J., Shrager, J., Burnap, R. L., Postier, B. L. & Grossman, A. R. Consequences of a deletion in dspA on transcript accumulation in Synechocystis sp. strain PCC6803. J. Bacteriol. 186, 3889–3902 (2004).
57. Singh, A. K. et al. Integration of carbon and nitrogen metabolism with energy production is crucial to light acclimation in the cyanobacterium Synechocystis. Plant Physiol. 148, 467–478 (2008).
58. Georg, J. et al. Evidence for a major role of antisense RNAs in cyanobacterial gene regulation. Mol. Syst. Biol. 5, 305 (2009). 59. Dickson, D. J., Luterra, M. D. & Ely, R. L. Transcriptomic responses of Synechocystis sp. PCC 6803 encapsulated in silica gel. Appl.
Microbiol. Biotechnol. 96, 183–196 (2012).
60. Nakamura, Y., Kaneko, T., Hirosawa, M., Miyajima, N. & Tabata, S. CyanoBase, a www database containing the complete nucleotide sequence of the genome of Synechocystis sp. strain PCC6803. Nucleic Acids Res. 26, 63–67 (1998).
61. Futschik, M. E. & Crompton, T. OLIN: optimized normalization, visualization and quality testing of two-channel microarray data.
Bioinformatics 21, 1724–1726 (2005).
62. Smyth, G. K. Limma: linear models for microarray data In Bioinformatics and Computational Biology Solutions using R and
Bioconductor (eds R. Gentleman et al.) 23, 397–420 (Springer, New York, 2005).
63. de Hoon, M. J., Imoto, S., Nolan, J. & Miyano, S. Open source clustering software. Bioinformatics 20, 1453–1454 (2004). 64. Saldanha, A. J. Java Treeview—extensible visualization of microarray data. Bioinformatics 20, 3246–3248 (2004).
Acknowledgements
The presented work is supported by national Portuguese funding through FCT—Fundação para a Ciência e a Tecnologia, project ref. PTDC/BIA-MIC/101036/2008, IF/00881/2013 and PTDC/BIA-MIC/4418/2012 granted to Matthias E. Futschik.
Author Contributions
M.H.P. and M.F. designed the workflow and scripts to analyze the expression data obtained from different data repositories. T.A.S. linked the different experiments to their corresponding publications and contributed together with M.H.P. and M.F. to the design and implementation of CyanoEXpress. M.H.P. and M.F. performed the statistical analyses. J.G.L. contributed to the interpretation of the results. J.G.L., T.S., M.F. and M.H.P. discussed the results and actively contributed to drafts of this manuscript.
Additional Information
Supplementary information accompanies this paper at http://www.nature.com/srep Competing financial interests: The authors declare no competing financial interests.
How to cite this article: Hernández-Prieto, M. A. et al. The Transcriptional Landscape of the Photosynthetic
Model Cyanobacterium Synechocystis sp. PCC6803. Sci. Rep. 6, 22168; doi: 10.1038/srep22168 (2016).
This work is licensed under a Creative Commons Attribution 4.0 International License. The images or other third party material in this article are included in the article’s Creative Commons license, unless indicated otherwise in the credit line; if the material is not included under the Creative Commons license, users will need to obtain permission from the license holder to reproduce the material. To view a copy of this license, visit http://creativecommons.org/licenses/by/4.0/