UNIVERSIDADE DA BEIRA INTERIOR
Ciências Sociais e Humanas
The Impact of Feed-in policies on Renewable
Electricity Generation in Spain
Daniela Pereira Macedo
Dissertação para obtenção do Grau de Mestre em
Economia
(2º ciclo de estudos)
Orientador: Prof. Doutor António Manuel Cardoso Marques
Acknowlegments
This dissertation would not have been possible without the comprehension, friendship and support of my family and friends. I will never forget all the contributions of each of you. I would like to express my sincere gratitude to my supervisor Professor António Manuel Cardoso Marques, for his guidance, friendship and support. I am very thankful for the constant encouragements, for having accepted work with me and for all his help. I will never forget that “I CAN DO IT!”. I would also like to acknowledge to Professor José Alberto Serras Ferreira Rodrigues Fuinhas for his precious assistance and several suggestions.
I would like to express my honest gratitude to my parents and to my biggest brother. For all their support, patient and incentive during the years of my studies. Their help, affection and attention are indispensable factors. I really want to thank you, for always transmitting me motivation, for remembering me everyday that I will always be able to reach my goals and realize my dreams. I also would like to express my big thanks to my best friend, João Tadeu, for helping me and for the best advices. And, of course, to Patrícia Alexandra for being in this stage of my life since the first year of our graduation, for all support, patient and friendship. Finally, but not the least, to all my friends I made in Covilhã, without doubt that their help was very important, and their friendship made me happy during this years.
Resumo
Esta dissertação estuda o impacto das Tarifas Feed-in (FiTs) e Feed-in Premium (FiPs), bem como, dos pagamentos por capacidade na geração de eletricidade por fonte de energia, avaliando as suas consequências, enquanto que controlando o preço de mercado. São aplicados dados com frequência mensal para a Espanha, desde janeiro de 2010 até fevereiro de 2017 e o modelo Autoregressive Distributed Lag é o usado. Os resultados revelam que, tanto as FiTs como as FiPs, contribuem negativamente para a produção de eletricidade através da fonte de energia eólica. Para além disso, os pagamentos por capacidade aparentam incentivar os produtores de fuel/gas a licitar preços baixos e aumentar a eletricidade produzida através de renováveis.
Palavras-Chave
Interações de fontes de energia; Pagamentos por Capacidade; Sistema Feed-in; Preço de Mercado; Modelo ARDL; Espanha.
Resumo Alargado
A redução de energia produzida através de fontes não renováveis tem vindo a ser uma prioridade para todo o mundo, favorecendo as fontes de energia renováveis. Desta forma, o aumento da capacidade instalada de renováveis deve ser promovida. A estratégia que diversos países encontraram para aumentar a capacidade instalada de energia renováveis assentou essencialmente na atribuição de subsídios aos produtores de energia renovável, sendo as tarifas Feed-in e Feed-in Premium a sua concretização mais comumente usada. Por um lado, é sabido que a integração das fontes de energia renováveis no sistema eletroprodutor é uma mais-valia para a redução das emissões de dióxido de carbono. Por outro lado, devido às características das fontes renováveis (como a intermitência, especialmente das fontes de energia solar e eólica), o sistema elétrico defronta-se com desafios relacionados com esta transição de paradigma de energia.
Devido às características específicas das energias renováveis, existe a possibilidade de o sistema electroprodutor não satisfazer a procura de eletricidade. De facto, uma vez que as renováveis são dependentes das condições climáticas, sabe-se que em algum momento, quando o sol ou o vento deixam de produzir eletricidade, as energias não renováveis terão de atuar para assegurar a oferta de eletricidade. A questão que se coloca é: de que forma os produtores de energia não renovável estarão dispostos a contribuir para o sistema, unicamente como último recurso? Os pagamentos por capacidade subsidiam fontes de energia, que são flexíveis ou controláveis, e são atribuídos de acordo com a capacidade instalada de cada fonte. É neste sentido que os pagamentos por capacidade são uma variável indispensável neste estudo. Por sua vez, as tarifas Feed-in e Feed-in Premium são atribuídas de acordo com o que cada fonte renovável produz na realidade, não dependendo da capacidade máxima de produção.
Portanto, estudar os três tipos de subsídios (referidos no parágrafo anterior) em conjunto tem como principal objetivo, avaliar empiricamente os subsídios que apoiam 100% as energias solar e eólica, nomeadamente, as tarifas Feed-in e Feed-in premium, assim como, os pagamentos por capacidade que apoiam economicamente as fontes de energia controláveis. Para além disso, a eletricidade produzida por fonte de energia é uma variável importante de avaliar o seu contributo, uma vez que são analisados os impactos que os três subsídios referidos têm na interação entre fontes de energia, controlando o preço de mercado de eletricidade. O período temporal utilizado neste estudo, tem periodicidade mensal, desde janeiro de 2010 até fevereiro de 2017. A metodologia aplicada é o modelo Autoregressive
Distributed Lag (ARDL), no qual foram executados os testes de raízes unitárias, da
especificação dos modelos, e posteriormente foram calculadas as elasticidades de curto- e longo-prazo.
O país estudado é Espanha, uma vez que se trata de um país com elevada capacidade instalada de energia eólica. Para além disso, incentivos para o desenvolvimento de energia renovável foram extensivamente adotados neste país. Os produtores de energia solar e eólica, em Espanha, podem escolher entre receber uma Tarifa Feed-in ou uma Feed-in Premium. Esta última pode ser classificada entre fixa ou de “slidding”. Uma tarifa é slidding, uma vez que é atribuída de acordo com o preço de mercado diário de eletricidade praticado. Este método funciona para que os produtores de energia não usufruam de sobrecompensação. Este estudo foca-se na tarifa slidding, uma vez que em 2007, Espanha mudou de uma tarifa fixa para uma de slidding, para incentivar os produtores a praticar preços de “spot”. Os incentivos públicos direcionados para a eletricidade foram implementados estrategicamente para aumentar a evolução das fontes de energia renovável, sem que, com isso, o sistema eletroprodutor fosse afetado e, portanto, garantir que oferta de eletricidade é assegurada. De forma geral, os principais resultados revelam que os subsídios que apoiam 100% as energias renováveis contribuem negativamente para o aumento de eletricidade produzida por fonte de energia eólica. No caso da fonte de energia solar, obteve-se efeitos contrários para o curto- e longo-prazo. Relativamente ao impacto dos três subsídios na atividade económica, dois efeitos distintos foram encontrados: (i) impacto positivo das Tarifas Feed-in e Feed-in
Premium da fonte de energia eólica e, (ii) impacto negativo das Tarifas Feed-in da energia
solar e dos pagamentos por capacidade. A incerteza dos produtores de energia de fontes controláveis aparenta diminuir, com a atribuição dos pagamentos por capacidade aos mesmos. De facto, isto pode justificar o impacto negativo que os pagamentos por capacidade têm no preço de mercado de eletricidade. Ademais, este resultado é também explicado através do impacto negativo que a eletricidade produzida através fuel/gas tem no preço de mercado de eletricidade. De facto, os produtores de energia não renovável poderão estar a licitar preços de eletricidade mais baixos, evidenciando o aumento da competitividade no mercado de eletricidade. Para concluir, os resultados demonstram o papel de backup das fontes de energia não renováveis nas fontes de energia renováveis.
De forma geral, os resultados desta dissertação sugerem que as políticas devem ser direcionadas para cada fonte de energia, ao invés de serem definidas de forma indiferenciada, não tendo em consideração as especificidades de cada fonte. Contudo, os decisores de política deverão estruturar tais políticas não comprometendo o desenvolvimento de nenhuma das fontes de energia, tendo como objetivo principal promover uma transição de energia mais suave.
Abstract
The novel aspect of this research is the study of the impact of feed-in tariffs, feed-in premiums and capacity payments on electricity generation by source, as well as, the assessment of their consequences in electricity source interactions, while controlling the market price. Monthly data for Spain, from January of 2010 to February of 2017 and the autoregressive distributed lag approach were used. The results revealed that both the feed-in tariffs and feed-in premiums contribute negatively to wind electricity production. Moreover, capacity payments appear to encourage fuel/gas producers to bid low, and to increase production from renewables.
Keywords
Electricity interactions; capacity payments; feed-in system; market price; ARDL approach; Spain.
Index
1. Introduction ... 1 2. Literature review ... 3 3. Methodology ... 5 3.1 Data ... 5 3.2 Method ... 10 4. Results ... 11 5. Discussion ... 20 6. Conclusion ... 22 References ... 23Tables list
Table 1 – Variables description and summary statistics
Table 2 – Unit root tests
Table 3 – ARDL results of the activity economic and intensity of carbon dioxide emissions from the electricity sector models
Table 4 – ARDL results of the electricity sources generation models
Table 5 – ARDL results of the market price models
Table 6 – Long-run elasticities
Acronyms list
ADF Augmented Dickey-Fuller ARDL Autoregressive Distributed Lag CO2 Carbon Dioxide
ECM Error Correction Model FiPs Feed-in Premiums FiTs Feed-in Tariffs
IPI Industrial Production Index KPSS Kwiatkowski Phillips Schmidt PP Phillips and Perron
PV Photovoltaic
1. Introduction
The reduction of non-renewable energy production has been a priority worldwide, in favour of renewable energy sources (RES). One of the ways that most countries have found to increase the deployment of RES has been the implementation of subsidies upon the renewable electricity production, such as feed-in tariffs (FiTs) and feed-in premiums (FiPs). However, the inclusion of RES in the electricity market has encountered some challenges, as a consequence of their characteristics of intermittency (specifically on wind and solar power), and the merit order effect on electricity prices (Kyritsis et al., 2017, Ballester and Furió, 2015). Still, when the wind stops blowing or the sun stops shining, capacity payments could be one solution to overcome the issue of not satisfying the electricity demand.
Spain is one of the countries with the highest installed capacity of wind power. Moreover, public policies have been extensively adopted to increase the deployment of RES, in Spain. According to the report “Renewable Energy in the Spanish electricity market” published by
“Red Eléctrica de España” in 2016, 45% of the installed electricity capacity was covered by
renewable energy. The share of electricity generated by renewables was 39% of the total electricity generation mix. Since 2007, the installed capacity of wind and solar power grew 70%. Indeed, the introduction of renewable energy sources in the electricity system contributed to a reduction in carbon dioxide (CO2) emissions. In 2016, CO2 emissions from the electricity generation were around 63.5 million tonnes of CO2, which corresponds to less 43.1%, and 18.3% of emissions, compared with 2007, and 2015, respectively (Red Eléctrica de España, 2016).
A feed-in system includes two types of subsidies: FiTs and FiPs. The FiPs can be classified into fixed or sliding premium. This paper focus on the last one, given that in 2007 Spain changed from a fixed to a sliding premium. Spain implemented the feed-in system in 1998 and producers were able to choose between receiving a FiT or a FiP. Since then, many laws have been introduced with respect to these two supports. Still, these laws have undergone some changes over the years. For example, in 2007, a new concept for the FiPs appeared, i.e, Spain started to consider FiPs as sliding premium. Considering the information contained in law 661/2007 (Ministerio de Industria Turismo y Comercio, 2007), the cap and floor price started to be considered when attributing the FiPs. This modification in the law, resulted in a more efficient method, so that producers were incentivized to practice spot prices. In 2013, to diminish the tariff deficit and achieve stability in the electricity market, law 2/2013 (Boletín Oficial del Estado, 2013a) revoked the FiPs for new producers.
The capacity payments subsidise controllable power plants for what they can potentially produce rather than what they actually produce in real time. According to Red Eléctrica de
España, in Spain, capacity payments are attributed to: fuel/gas, coal, combined cycle,
sources to ensure a more reliable electricity market. The electricity produced from RES has low marginal costs. Hence, renewable generators would bid at lower price than conventional producers. In fact, due to the intermittency of RES, controllable sources must replace the electricity supply. Moreover, electricity generation by renewables provokes high price volatility (Fogelberg and Lazarczyk, 2017). The priority of dispatch allows RES to inject electricity into the grid first. In its turn, conventional producers carry out the associated costs of producing electricity even when not all the electricity produced is sold, i.e., the return of investment could be low. So that, capacity payments are ensuring a certain revenue for producers. Thus, controllable sources producers are still able to inject electricity into the grid, when, for example, wind and solar plants, stop producing electricity.
The public supports for electricity where implemented strategically, to increase the deployment of renewables as well as to satisfy the electricity supply. This paper contributes to the literature by empirically studying three distinct types of support mechanism. FiTs and FiPs that support RES 100%, while capacity payments provide economic aid to electricity producers of controllable sources. Moreover, this research aims to assess how these three supports mechanisms influence the interactions between electricity sources, while controlling for the market price. The methodology applied for this research is the ARDL approach that, among other features, allows taking conclusions about the effects in both the short- and long-run and is robust in the presence of endogeneity.
Overall, the main findings of this paper reveal that renewables supports are not contributing to an increase in electricity production from wind power. In the case of solar photovoltaic (PV), opposing effects were found, depending on which term is analysed (short or long-run). The supports mechanisms reveal two distinct effects on the industrial production index (IPI): (i) a positive impact of the FiTs and FiPs from the wind source; (ii) a negative impact of the FiTs from the solar PV power and capacity payments. The uncertainty handled by controllable sources producers appears to decrease through the capacity payments. In fact, this could justify the negative impact of capacity payments in the market price. Therefore, the negative impact of electricity produced from fuel/gas on market price, indicates that the electricity market has become more competitive. Moreover, there is evidence that non-renewable energy sources are playing a backup role for renewables, that could be due, in part, to the application of capacity payments. The results of this paper could help policymakers structure policies for each source, without compromising the development of any of them, and promote a smoother energy transition.
After this introduction, this paper is structured as follows: Section 2 provides a literature review, Section 3 describes the data and methodology, Section 4 and 5 analyse and interpret the results and discussions, respectively, and finally, Section 6 presents the conclusions.
2. Literature review
The literature concerning the feed-in system, reveals that this system has been adopted throughout almost the entire world. Mechanisms to support renewables, are usually discussed in international commitments and its applicability is similarly adopted in most countries. However, introducing the same policies in different countries is not always successful, once that countries have different preferences (Romano et al., 2017). The electricity generated by intermittent technologies, as wind and solar plants, could be being charged more, or less, depending on capacity or energy price. So that, policies should be individually structured (Antweiler, 2017).
In addition to in system, quota systems are also used in many countries, although, feed-in systems contribute more to the deployment of renewables (Schallenberg-Rodriguez, 2017). Nicolini and Tavoni, (2017) studied France, Italy, Germany, Spain and United Kingdom to see whether policies (such FiTs and tradable green certificates) intended to encourage renewables as well as their effectiveness. Their results revealed that these policies have a positive relationship in the short-run, by incentivising generation, and in the long-run by promoting greater installed capacity. Indeed, feed-in tariffs were considered one of the contributory factors regarding the increase of the installed capacity of photovoltaics (Norberto et al., 2016).
The marginal cost of renewables is low, and this implies reduced electricity prices. However, in Germany, contradictory effects were observed. The significant expansion of photovoltaics was not considered the main price driver, and the merit order effect was not found to be the primary reason for the decrease in electricity prices (Bublitz et al., 2017). In fact, producers of conventional sources, such as gas-fired, were becoming unprofitable. Policymakers suggested the introduction of capacity payments to overcome this issue. The introduction of capacity payments is intended to make the electricity market more reliable, so enough electricity is guaranteed to satisfy the demand, thus reducing the cost to the consumer (Bhagwat et al., 2017).
Although there is evidence that wind power production decreases electricity prices. Furthermore, it also provokes high volatility in prices (Martinez-Anido et al., 2016). Two effects may arise from the introduction of capacity payments, (i) an increase in wholesale electricity prices and (ii) a decrease in price volatility (Bajo-buenestado, 2017). In southern Germany, the introduction of such payments allowed day-ahead scheduling of gas-fired electricity dispatch. Besides, capacity payments can be also seen as an incentive to include renewable energy in the electricity market (Siddiqui et al., 2016). Defined as a good reserve margin, capacity payments are also considered a better tool for preventing price spikes, than the incentives for renewables (Ibanez-lopez et al., 2017). Therefore, an investment in the
peak-load could result from applying capacity payments, while bearing in mind the policy targets stipulated for each country (Hach and Spinler, 2016).
For Italy, the feedback hypothesis was observed for fossil fuels in the short-run. Moreover, investments concerning the deployment of renewables must take into account whether countries can handle these investments, without compromising their economies (Marques et al., 2015). In Tunisia, RES contributed negatively to economic growth, and the conservation hypothesis was found (Brini et al., 2017). In Greece, fossil fuels caused economic growth in the short-run. Renewable electricity sources were encouraged by economic growth in the and long-run, but the opposite effect is not found (Marques et al., 2014). In the short-run, fossil fuels seemed to be working as a baseload, and in the long-short-run, fossil fuels appeared to be stimulating the deployment of renewables by acting as a backup (Marques et al., 2016).
For 20 countries of the Organisation for Economic Co-operation and Development, the feedback hypothesis between economic growth and renewable energy, was found. The results of the research highlighted that specific sources have different impacts on economic growth (Ohler and Fetters, 2014). There is also evidence from 29 OECD countries of a possible substitution effect between renewable and non-renewable energy, which means that an increase in one implies a decrease in the other (Salim et al., 2014). A bidirectional causality between economic growth and energy consumption, was found for Pakistan. This result revealed that ensuring an adequate energy supply can be crucial to increase economic growth. However, an increase in energy consumption, increases CO2 emissions, so countries should focus on the deployment of RES. The feedback hypothesis between CO2 emissions and economic growth, suggests that policies should be directed towards the reduction of emissions, improving the environmental quality (Mirza and Kanwal, 2017).
Overall, demand-side management (DSM) suggests techniques, which intended to change consumer behaviour. The smart grid is a recent concept that involves technology which transmits information, communications, and intelligent control systems. Yang et al., (2017), focused their study on the various categories of demand response, especially price-based demand response. They concluded that the most commonly used tariff is the time-of-use tariff, used on its own or in combination with tiered electricity pricing. Moreover, implementing regulations and policies related to demand-side management, made the generation sector more competitive, transmitting improvements in the equilibrium of electricity supply and demand.
In the literature, the authors are looking to supports mechanisms, interactions between electricity sources, and market price, individually. This research goes further by incorporating the concepts mentioned in the same study.
3. Methodology
This section describes the database and the preliminary tests (3.1) upon its properties, as well as the method employed (3.2). For a better understanding of how certain specific variables interact, we also include, in subsection 3.1, a description of the components of the monthly price and an explanation of the calculation of the FiTs and FiPs.
3.1 Data
Monthly data for Spain, from January of 2010 to February 2017, was used. The published information on electricity generation by energy sources is recent, and this is one reason why the time span of this study starts in 2010. Using annual data would imply a smaller number of observations, while using monthly data provides a sample with far more observations. Instead of studying renewables and non-renewable energy sources in an aggregate way, the use of monthly data allows analysing the impact of support mechanisms on specific electricity sources, as well as their interactions. Moreover, the monthly frequency provides more accurate results.
The database in this study includes: the adjusted industrial production index (IPI_AJ, 2010=100), intensity of carbon dioxide emissions from the electricity sector (CO2EC, tCO2), electricity imports (IMPS, GWh) and exports (EXPS, GWh), electricity consumption for pumping (PUMP, GWh), electricity generation from hydro power (HYDRO, GWh), wind power (WIND, GWh), solar photovoltaic (SOL_PV, GWh), nuclear (LNUCLEAR, GWh) and fuel/gas (LFUEL/GAS, GWh), market price (PRICE, €/MWh), price for system adjustment services (AJ_SIST, €/MWh), feed-in tariffs for wind (FiT_WIND, €/MWh) and solar photovoltaic (FiT_PV, €/MWh),) energy sources, feed-in premiums for the wind power (FiP_WIND, €/MWh),) capacity payments for controllable sources (CAP_PAY, €/MWh),). All the data has been retrieved from the Eurostat and the Red Eléctrica de España, except the two types of feed-in tariffs. Both the fixed-FiTs and FiPs were calculated by us, taking into the account the raw data contained in law 661/2007, law 1578/2008, law 1565/2010, and law 1614/2010. All the variables were transformed into their natural logarithms (hereafter denominated “L”), except the FiTs and FiPs, due to their behaviour caused by cuts in these subsidies. Note that, the industrial production index was used as a proxy of gross domestic product, once there is no data availability with a monthly frequency for it. Table 1 shows the description and summary statistics of the variables used.
The variance inflation factor test was performed, and it suggested the presence of multicollinearity between CO2 emissions, coal electricity generation and the market price. The correlation matrix was also carried out, and a high correlation between coal and CO2 was found. Consequently, the simultaneous inclusion of CO2 and coal would lead to biased results,
so coal electricity production was not included in the estimation of the models. Regarding multicollinearity between the market price and CO2, the solution found was to transform the CO2 variable into a variable of the intensity of CO2 from the electricity sector, i.e., the ratio between CO2 emissions from the electricity sector and the IPI. Furthermore, it was noticed high correlation between the FiTs of wind and solar PV. These two variables are not estimated simultaneously, therefore two separate models were estimated for the following dependent variables: IPI, and PRICE.
Components of the monthly final price
The components of the monthly final price used have the following meaning:
(i) Market price: does the management of electricity bids for sale and purchase for the day ahead;
(ii) System adjustment services: a service to guarantee the supply of the electricity with quality, security and reliability.
Fixed feed-in tariffs and feed-in premiums
In this study we analyse the FiTs paid to onshore wind and solar PV producers. The FiTs are a subsidy to incentivise the production of electricity by renewables. It is a fixed price paid to investors for each megawatt produced (€/MWh). Tariffs are allocated for a period of twenty or twenty-five years, for onshore wind and solar PV, respectively. Leading to this, producers of RES could feel more secure and reliable of their investment. Note that, the subsidies paid to each producer change according to the type of technology.
The variable calculation of FiTs was based on the fixed price defined in law 661/2007. Although, as mentioned before, new laws appeared with cuts in fixed-FiTs for both wind and solar PV energy sources. First, in accordance with law 1565/2010, tariffs for solar PV were cut. The cuts were based on the size and type of solar PV plants, i.e., for small-roof, medium-roof and ground size installations it was applied a cut of 5%, 25% and 45%, respectively. The new FiTs for solar PV source was introduced in November 2010 (please note that this paper does not differentiate the size and type of solar photovoltaic plants). Second, the subsidy for wind source suffered a cut of 35% in December 2010 (law 1614/2010), modifying the prices established in law 661/2007.
In the case of the FiPs, they are defined as premium that producers receive in addition to the price of the electricity. In Spain, the source that is entitled to receive this type of subsidy is onshore wind, i.e. solar PV power is only included in the fixed-FiTs. According to the law 661/2007, a new feature was introduced in the FiPs mechanism. The cap and floor price
appeared, introducing the sliding FiPs concept. This concept was adopted by Spain to avoid producers being overcompensated, and to incentivise them to practice spot prices.
The calculation of the FiPs variable were based on the daily electricity price, from the “Operador del Mercado Ibérico de Energía”. The calculation of the FiPs variable involved the following steps: firstly, we added the daily electricity price to the reference premium resulting in the daily support, and secondly a monthly average of the daily support was calculated. Finally, according to the cap and floor values given in law 661/2007, the FiPs were calculated taking into account the following assumptions: if the monthly average were lower than the cap value, the premium attributed is the floor price minus the monthly average, if the monthly average is higher than the cap value, the premium received is equal to zero, but when the monthly average is between the cap and floor values, the premium obtained by producers is the reference premium (Schallenberg-rodriguez, 2014). After the calculation of both the fixed-FiTs and FiPs, the feed-in prices were updated, considering the consumer index price. The consumer index price data source was the “Organisation for Economic Co-operation and Development” and was applied to every month.
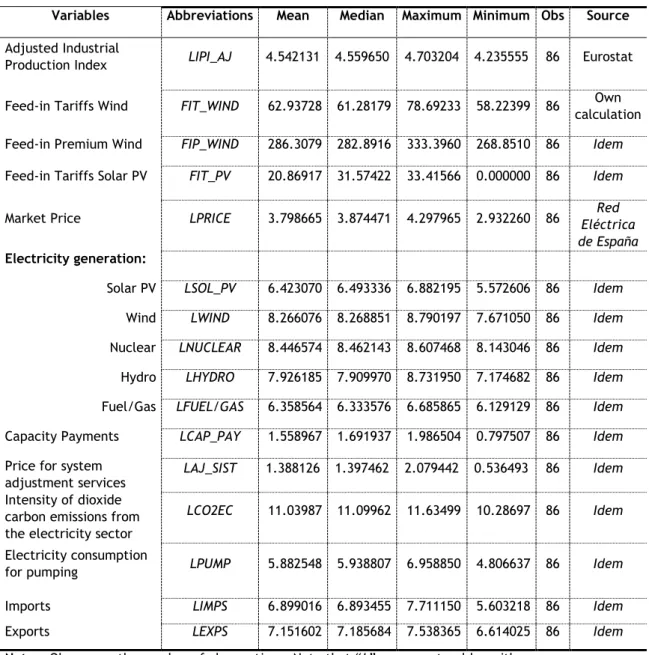
Table 1. Variables description and summary statistics
Variables Abbreviations Mean Median Maximum Minimum Obs Source
Adjusted Industrial
Production Index LIPI_AJ 4.542131 4.559650 4.703204 4.235555 86 Eurostat
Feed-in Tariffs Wind FIT_WIND 62.93728 61.28179 78.69233 58.22399 86 calculation Own Feed-in Premium Wind FIP_WIND 286.3079 282.8916 333.3960 268.8510 86 Idem
Feed-in Tariffs Solar PV FIT_PV 20.86917 31.57422 33.41566 0.000000 86 Idem
Market Price LPRICE 3.798665 3.874471 4.297965 2.932260 86 Eléctrica Red
de España
Electricity generation:
Solar PV LSOL_PV 6.423070 6.493336 6.882195 5.572606 86 Idem
Wind LWIND 8.266076 8.268851 8.790197 7.671050 86 Idem
Nuclear LNUCLEAR 8.446574 8.462143 8.607468 8.143046 86 Idem
Hydro LHYDRO 7.926185 7.909970 8.731950 7.174682 86 Idem
Fuel/Gas LFUEL/GAS 6.358564 6.333576 6.685865 6.129129 86 Idem
Capacity Payments LCAP_PAY 1.558967 1.691937 1.986504 0.797507 86 Idem
Price for system
adjustment services LAJ_SIST 1.388126 1.397462 2.079442 0.536493 86 Idem Intensity of dioxide
carbon emissions from the electricity sector
LCO2EC 11.03987 11.09962 11.63499 10.28697 86 Idem
Electricity consumption
for pumping LPUMP 5.882548 5.938807 6.958850 4.806637 86 Idem Imports LIMPS 6.899016 6.893455 7.711150 5.603218 86 Idem
Exports LEXPS 7.151602 7.185684 7.538365 6.614025 86 Idem
Notes: Obs means the number of observations. Note that “L” means natural logarithm.
Before proceeding to the estimation of the model, the appropriate methodology to be used had to be identified. A visual inspection of the series was made and, then the integration order of the variables was assessed using three stationary tests, namely: the Augmented Dickey-Fuller (ADF) (Dickey and Fuller, 1979), Phillips-Perron (PP) (Phillips and Perron, 1988), and Kwiatkowski-Phillips-Schmidt-Shin (KPSS) (Kwiatkowski et al., 1992) (see Table 2).
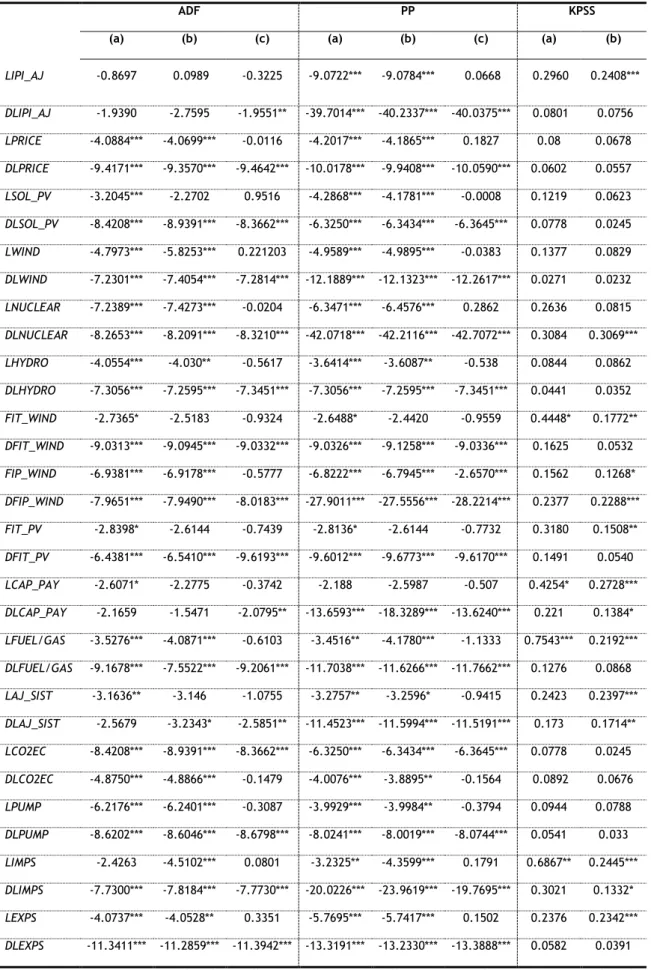
Table 2. Unit root tests
ADF PP KPSS
(a) (b) (c) (a) (b) (c) (a) (b)
LIPI_AJ -0.8697 0.0989 -0.3225 -9.0722*** -9.0784*** 0.0668 0.2960 0.2408*** DLIPI_AJ -1.9390 -2.7595 -1.9551** -39.7014*** -40.2337*** -40.0375*** 0.0801 0.0756 LPRICE -4.0884*** -4.0699*** -0.0116 -4.2017*** -4.1865*** 0.1827 0.08 0.0678 DLPRICE -9.4171*** -9.3570*** -9.4642*** -10.0178*** -9.9408*** -10.0590*** 0.0602 0.0557 LSOL_PV -3.2045*** -2.2702 0.9516 -4.2868*** -4.1781*** -0.0008 0.1219 0.0623 DLSOL_PV -8.4208*** -8.9391*** -8.3662*** -6.3250*** -6.3434*** -6.3645*** 0.0778 0.0245 LWIND -4.7973*** -5.8253*** 0.221203 -4.9589*** -4.9895*** -0.0383 0.1377 0.0829 DLWIND -7.2301*** -7.4054*** -7.2814*** -12.1889*** -12.1323*** -12.2617*** 0.0271 0.0232 LNUCLEAR -7.2389*** -7.4273*** -0.0204 -6.3471*** -6.4576*** 0.2862 0.2636 0.0815 DLNUCLEAR -8.2653*** -8.2091*** -8.3210*** -42.0718*** -42.2116*** -42.7072*** 0.3084 0.3069*** LHYDRO -4.0554*** -4.030** -0.5617 -3.6414*** -3.6087** -0.538 0.0844 0.0862 DLHYDRO -7.3056*** -7.2595*** -7.3451*** -7.3056*** -7.2595*** -7.3451*** 0.0441 0.0352 FIT_WIND -2.7365* -2.5183 -0.9324 -2.6488* -2.4420 -0.9559 0.4448* 0.1772** DFIT_WIND -9.0313*** -9.0945*** -9.0332*** -9.0326*** -9.1258*** -9.0336*** 0.1625 0.0532 FIP_WIND -6.9381*** -6.9178*** -0.5777 -6.8222*** -6.7945*** -2.6570*** 0.1562 0.1268* DFIP_WIND -7.9651*** -7.9490*** -8.0183*** -27.9011*** -27.5556*** -28.2214*** 0.2377 0.2288*** FIT_PV -2.8398* -2.6144 -0.7439 -2.8136* -2.6144 -0.7732 0.3180 0.1508** DFIT_PV -6.4381*** -6.5410*** -9.6193*** -9.6012*** -9.6773*** -9.6170*** 0.1491 0.0540 LCAP_PAY -2.6071* -2.2775 -0.3742 -2.188 -2.5987 -0.507 0.4254* 0.2728*** DLCAP_PAY -2.1659 -1.5471 -2.0795** -13.6593*** -18.3289*** -13.6240*** 0.221 0.1384* LFUEL/GAS -3.5276*** -4.0871*** -0.6103 -3.4516** -4.1780*** -1.1333 0.7543*** 0.2192*** DLFUEL/GAS -9.1678*** -7.5522*** -9.2061*** -11.7038*** -11.6266*** -11.7662*** 0.1276 0.0868 LAJ_SIST -3.1636** -3.146 -1.0755 -3.2757** -3.2596* -0.9415 0.2423 0.2397*** DLAJ_SIST -2.5679 -3.2343* -2.5851** -11.4523*** -11.5994*** -11.5191*** 0.173 0.1714** LCO2EC -8.4208*** -8.9391*** -8.3662*** -6.3250*** -6.3434*** -6.3645*** 0.0778 0.0245 DLCO2EC -4.8750*** -4.8866*** -0.1479 -4.0076*** -3.8895** -0.1564 0.0892 0.0676 LPUMP -6.2176*** -6.2401*** -0.3087 -3.9929*** -3.9984** -0.3794 0.0944 0.0788 DLPUMP -8.6202*** -8.6046*** -8.6798*** -8.0241*** -8.0019*** -8.0744*** 0.0541 0.033 LIMPS -2.4263 -4.5102*** 0.0801 -3.2325** -4.3599*** 0.1791 0.6867** 0.2445*** DLIMPS -7.7300*** -7.8184*** -7.7730*** -20.0226*** -23.9619*** -19.7695*** 0.3021 0.1332* LEXPS -4.0737*** -4.0528** 0.3351 -5.7695*** -5.7417*** 0.1502 0.2376 0.2342*** DLEXPS -11.3411*** -11.2859*** -11.3942*** -13.3191*** -13.2330*** -13.3888*** 0.0582 0.0391
Notes: ADF means Augmented Dickey-Fuller test, PP means Phillips Perron and KPSS means Kwiatkowski
Phillips Schmidt Shin; (a) means constant, (b) means constant and trend and (c) is without constant and trend; *, **, *** indicate rejection of the null hypothesis at 10%, 5% and 1%, respectively.
The ADF and PP have the null hypothesis that the variable has a unit root, and the KPSS null hypothesis is that the variable is stationary. The results presented in Table 3. reveal that the variables’ order of integration is at most one, i.e., I (1). The methodology that can handle with variables which have different integration order, is the Autoregressive Distributed Lag (ARDL), whose characteristics will be described in the next subsection (3.2).
3.2 Method
This paper uses monthly data for the period from 2010 till 2017. All the available information was used, considering the consensus between the variables. The management of energy production is carried out on a daily and monthly basis. Moreover, investments in energy sources require a detailed timeframe to assess their effectiveness. Consequently, is necessary to detect effects in both the short- and long run. The methodology that can best handle this type of analysis is the Autoregressive Distributed Lag (ARDL) approach developed by Pesaran et al., (2001).
During the period mentioned above, shocks and policies changes occurred. Consequently, they must to be tested, and the ARDL approach permits the incorporation of dummies for such events in models, without affecting the results. Moreover, it allows the use of variables with different orders of integration, except of order two (I (2)). It can cope with endogeneity, which allows studying the interactions between the electricity sources, controlling for the market price. The ARDL in its unrestricted error correction model form could be represented as follows in equation (1):
,
1 1 4 3 2 1 0 t k p k p p t p t t tTREND
DX
Y
X
DY
(1) wherein, D means the first differences, the vector Ytrepresents the dependent variables;the vector Xtrepresents the independent variables;
2
are the short-run coefficients; 3 is the error correction mechanism (ECM) and
4represents the long-run coefficients.4. Results
The results of the ARDL estimation and its diagnostic tests are presented in Tables 3, 4 and 5. The elasticities were calculated as well as the ARDL bounds tests, which are displayed in Tables 6 and 7, respectively. The semi-elasticities are presented in the tables of the ARDL results. Through the diagnostic tests the quality of the models was assessed. It was found that all models are correctly specified, and met all the econometric requirements. The Jarque-Bera test validates the normality of the series. The first and second order of correlation are rejected, through the Breusch-Godfrey serial correlation LM tests, and the ARCH test confirms the absence of conditional heteroskedascity, at only 10% of significance for each model. The CUSUM and CUSUM of squares tests confirms the stability of the coefficients. And, finally the RESET test indicates the correct specification of the models.
The analysis of the ECM values reveals that the return to the equilibrium of the models are fast, revealed by the high ECM values, and are significant at 1%. The lowest and the highest value are -0.2705 and -0.9350 for models with solar PV source and industrial production index as dependent variables, respectively. The prices charged for solar panels are high, and this may have affected the expansion of solar PV plants. However, is possible to observe that the deployment of solar photovoltaic power has been slowly increasing. Models I and II show the positive impact of LSOL_PV in the short- and long-run.
The differing impacts of the various supports for renewables, on both economic growth and electricity production by solar and wind power, were detected in models I, II, IV and V. Firstly, FiTs and FiPs for wind source appear to positively affect economic activity. However, FIT_PV has a negative impact on economic growth.
Table 3: ARDL results of the activity economic and intensity of carbon dioxide emissions from the
electricity sector models
Variable MODEL I - IPI_FiT_WIND MODEL II - IPI_FiT_PV MODEL III - CO2EC
DLIPI_AJ -1.0143*** DLPRICE 0.0992*** 0.4296*** DLSOL_PV 0.0673** 0.1018*** DLWIND -0.0535** -0.1899*** DLNUCLEAR -0.3025*** DLHYDRO -0.2627*** DFIT_WIND 0.0031* DFIP_WIND 0.0006** DFIT_PV -0.0017*** DLCAP_PAY -0.1431*** -0.1233*** 0.1845*** DLFUEL/GAS 0.8029*** DLAJ_SIST 0.0444** DLCO2EC -0.0868*** -0.1789*** DLPUMP -0.0814*** -0.0683*** -0.0648* DLIMPS 0.0367*** 0.0469*** DLEXPS 0.1486*** LIPI_AJ(-1) -0.9350*** -0.8723*** -0.8016*** LPRICE(-1) 0.0915** 0.1438*** 0.3998*** LSOL_PV(-1) 0.0489** 0.0783*** -0.1527*** LWIND(-1) -0.0623** -0.0923*** -0.1844** LNUCLEAR(-1) -0.2484** LHYDRO(-1) -0.2657*** FIP_WIND(-1) 0.0009** LCAP_PAY(-1) 0.2206*** LFUEL/GAS(-1) 0.2378*** 0.1805*** 0.8404*** LAJ_SIST(-1) LCO2EC(-1) -0.1583*** -0.1287*** -0.8689*** LPUMP(-1) -0.0599*** LIMPS(-1) 0.0246** -0.0568* LEXPS(-1) -0.1287*** TREND 0.0031*** C 4.5405*** 4.9011*** 12.9949*** ECM -0.9350*** -0.8723*** -0.8689*** Time Dummies D_2010M03 0.2856*** D_2013M04 -0.0914** D_2016M11 0.1401*** ID8 -0.4226*** -0.3664*** Diagnostics tests ARS 0.9540 0.9609 0.9297 SER 0.0325 0.0300 0.0661 Jarque-Bera [1.7356] [0.1704] [3.4297] LM (1) [0.0666] (1) [0.8424] (1) [0.2102] (2) [0.1288] (2) [0.4461] (2) [0.2496] ARCH (1) [1.1292] (1) [0.7502] (1) [0.3927] (2) [0.4796] (2) [1.2612] (2) [0.2955] RESET [0.4254] [0.2075] [0.5182]
Notes: ARS means Adjusted R-squared; SER means standard error of regression; JB means Jarque-Bera
normality test; LM means Breusch-Godfrey test; ARCH means ARCH test and RESET means Ramsey RESET test. The diagnostics tests are based on the F-statistic. In () is shown the lags for variables and in [] is shown the F-statistic values.
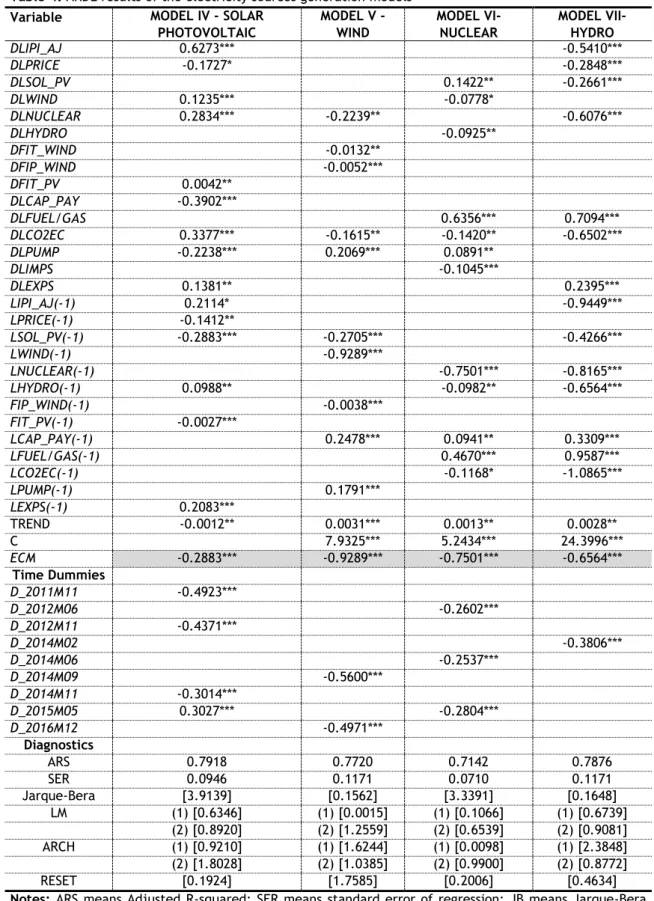
Second, support for renewables did not contribute to the increase of electricity production through wind power but, in case of solar PV sources, there is a positive impact of FIT_PV in the short-run, and a negative impact in the long-run. Conventional sources, such LFUEL/GAS and LNUCLEAR, are encouraging the production of RES. In model - VII, LFUEL/GAS is contributing positively to the increase of hydro electricity production. Despite LNUCLEAR be affecting negatively both the HYDRO and WIND model, in model – IV, is playing a backup role on solar photovoltaic electricity generation.
Table 4: ARDL results of the electricity sources generation models
Variable MODEL IV - SOLAR
PHOTOVOLTAIC MODEL V - WIND MODEL VI- NUCLEAR MODEL VII- HYDRO DLIPI_AJ 0.6273*** -0.5410*** DLPRICE -0.1727* -0.2848*** DLSOL_PV 0.1422** -0.2661*** DLWIND 0.1235*** -0.0778* DLNUCLEAR 0.2834*** -0.2239** -0.6076*** DLHYDRO -0.0925** DFIT_WIND -0.0132** DFIP_WIND -0.0052*** DFIT_PV 0.0042** DLCAP_PAY -0.3902*** DLFUEL/GAS 0.6356*** 0.7094*** DLCO2EC 0.3377*** -0.1615** -0.1420** -0.6502*** DLPUMP -0.2238*** 0.2069*** 0.0891** DLIMPS -0.1045*** DLEXPS 0.1381** 0.2395*** LIPI_AJ(-1) 0.2114* -0.9449*** LPRICE(-1) -0.1412** LSOL_PV(-1) -0.2883*** -0.2705*** -0.4266*** LWIND(-1) -0.9289*** LNUCLEAR(-1) -0.7501*** -0.8165*** LHYDRO(-1) 0.0988** -0.0982** -0.6564*** FIP_WIND(-1) -0.0038*** FIT_PV(-1) -0.0027*** LCAP_PAY(-1) 0.2478*** 0.0941** 0.3309*** LFUEL/GAS(-1) 0.4670*** 0.9587*** LCO2EC(-1) -0.1168* -1.0865*** LPUMP(-1) 0.1791*** LEXPS(-1) 0.2083*** TREND -0.0012** 0.0031*** 0.0013** 0.0028** C 7.9325*** 5.2434*** 24.3996*** ECM -0.2883*** -0.9289*** -0.7501*** -0.6564*** Time Dummies D_2011M11 -0.4923*** D_2012M06 -0.2602*** D_2012M11 -0.4371*** D_2014M02 -0.3806*** D_2014M06 -0.2537*** D_2014M09 -0.5600*** D_2014M11 -0.3014*** D_2015M05 0.3027*** -0.2804*** D_2016M12 -0.4971*** Diagnostics tests ARS 0.7918 0.7720 0.7142 0.7876 SER 0.0946 0.1171 0.0710 0.1171 Jarque-Bera [3.9139] [0.1562] [3.3391] [0.1648] LM (1) [0.6346] (1) [0.0015] (1) [0.1066] (1) [0.6739] (2) [0.8920] (2) [1.2559] (2) [0.6539] (2) [0.9081] ARCH (1) [0.9210] (1) [1.6244] (1) [0.0098] (1) [2.3848] (2) [1.8028] (2) [1.0385] (2) [0.9900] (2) [0.8772] RESET [0.1924] [1.7585] [0.2006] [0.4634]
Notes: ARS means Adjusted R-squared; SER means standard error of regression; JB means Jarque-Bera
normality test; LM means Breusch-Godfrey test; ARCH means ARCH test and RESET means Ramsey RESET test. The diagnostics tests are based on the F-statistic. In () is shown the lags for variables and in [] is shown the F-statistic values.
Looking at the models used to analyse market price, their results highlight that FUEL/GAS negatively affected both models VIII and IX. This result means that flexible sources producers could be bidding low, as renewables producers. FIP_WIND has a negative signal in model VIII in the short-run, while FIT_WIND has a positive in the long-run. However, FIT_PV is not showing no evidence that it is affecting the market price. Moreover, CAP_PAY is contributing to the decrease of the market price, in model – VIII.
Table 5: ARDL results of the market price models
Variable MODEL VIII - PRICE_FiT_WIND MODEL IX - PRICE_FiT_PV
DLIPI_AJ 0.8289*** 0.9194*** DFIP_WIND -0.0012* DLCAP_PAY -0.1483** DLFUEL/GAS -0.3886** -0.3873** DLCO2EC 0.9023*** 0.9062*** DLPUMP 0.0979** 0.1085*** DLIMPS -0.1483*** DLEXPS -0.1290** -0.0966* LIPI_AJ(-1) 0.3808*** 0.6402*** LPRICE(-1) -0.4692*** -0.6837*** LSOL_PV(-1) -0.0728** LHYDRO(-1) 0.1150** FIT_WIND(-1) 0.0108*** LCAP_PAY(-1) -0.1800*** LFUEL/GAS(-1) -0.8545*** -0.2603*** LCO2EC(-1) 0.5580*** 0.5581*** LPUMP(-1) -0.1116*** LIMPS(-1) -0.1241*** C -4.8130*** ECM -0.4692*** -0.6837*** Time Dummies D_2010M03 -0.4322*** -0.3874*** D_2013M01 0.2515*** D_2013M03 -0.2574*** D_2013M04 -0.3225*** D_2013M05 0.4718*** 0.3432*** Diagnostics tests ARS 0.8694 0.8354 SER 0.0779 0.0874 Jarque-Bera [0.0183] [1.0506] LM (1) [1.5740] (1) [1.1220] (2) [1.1187] (2) [0.5846] ARCH (1) [0.0083] (1) [0.0530] (2) [1.6063] (2) [0.5576] RESET [0.5579] [1.4146]
Notes: ARS means Adjusted R-squared; SER means standard error of regression; JB means Jarque-Bera
normality test; LM means Breusch-Godfrey test; ARCH means ARCH test and RESET means Ramsey RESET test. The diagnostics tests are based on the F-statistic. In () is shown the lags for variables and in [] is shown the F-statistic values.
The importance of certain events that occurred in the period studied, is confirmed by the statistical significance of the dummies used. Particularly the following events, industrial production always decreases in August, as the output is lower due to the holidays taken in this month. To control this effect, an impulse dummy (ID8) was used. Wind power was the
energy source which produced more energy than any other technology in March of 2010. Its production could supply all of Portugal’s electricity needs for a month.
Since the Fukushima accident, several initiatives were implemented to prevent other accidents. In June of 2012, the “Action Plan of the European Nuclear Safety Regulators” was published, setting out an action plan for different countries. In May of 2013, the European Commission recommended Spain to implement structural reforms to deny the electricity tariff deficit. Leading to the information given about the regulation of the Spanish electric system, in December 2016, the law 7/2016 was approved, correcting law 24/2013. This change in the law was directed to consumers more vulnerable.
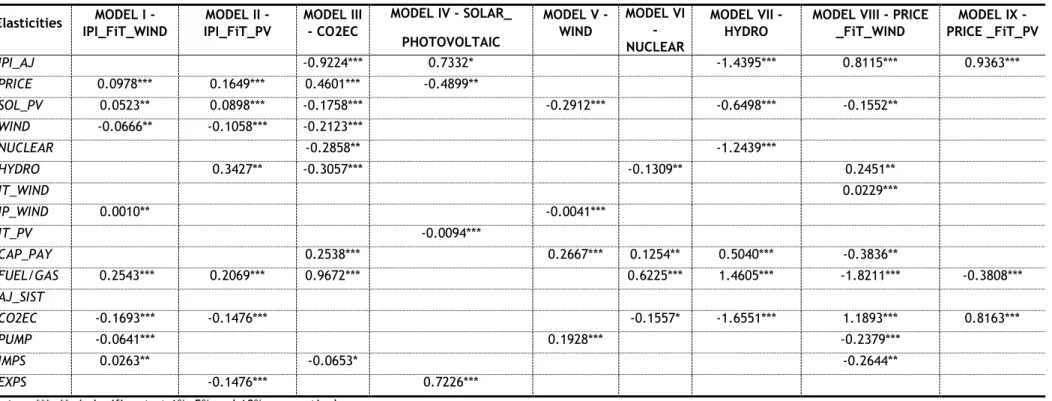
Semi-elasticities are the values of the variables’ coefficients in the short-run. The elasticities are calculated as follows: the value of the long-run coefficient is divided by the EMC value and multiplied by (-1). The semi-elasticities and elasticities allow the direct and indirect effects of the variables to be captured. The semi-elasticities are presented in the table of ARDL results, and the elasticities are presented in Table 6.
Table 6: Long-run elasticities Elasticities MODEL I - IPI_FiT_WIND MODEL II - IPI_FiT_PV MODEL III - CO2EC MODEL IV - SOLAR_ PHOTOVOLTAIC MODEL V - WIND MODEL VI - NUCLEAR MODEL VII - HYDRO
MODEL VIII - PRICE _FiT_WIND MODEL IX -PRICE _FiT_PV LIPI_AJ -0.9224*** 0.7332* -1.4395*** 0.8115*** 0.9363*** LPRICE 0.0978*** 0.1649*** 0.4601*** -0.4899** LSOL_PV 0.0523** 0.0898*** -0.1758*** -0.2912*** -0.6498*** -0.1552** LWIND -0.0666** -0.1058*** -0.2123*** LNUCLEAR -0.2858** -1.2439*** LHYDRO 0.3427** -0.3057*** -0.1309** 0.2451** FIT_WIND 0.0229*** FIP_WIND 0.0010** -0.0041*** FIT_PV -0.0094*** LCAP_PAY 0.2538*** 0.2667*** 0.1254** 0.5040*** -0.3836** LFUEL/GAS 0.2543*** 0.2069*** 0.9672*** 0.6225*** 1.4605*** -1.8211*** -0.3808*** LAJ_SIST LCO2EC -0.1693*** -0.1476*** -0.1557* -1.6551*** 1.1893*** 0.8163*** LPUMP -0.0641*** 0.1928*** -0.2379*** LIMPS 0.0263** -0.0653* -0.2644** LEXPS -0.1476*** 0.7226***
The elasticities of models I and II, indicate that an increase of 1% in LWIND, decreases LIPI by 0.0666% and 0.1058%, respectively. With respect to model IV, the elasticities show that an increase of 1% in FIT_PV reduces LSOL_PV by 0.0094%. Meanwhile, the semi-elasticities reveal that an increase of 1 percentage point in FIT_PV increases LSOL_PV by 0.0042%.
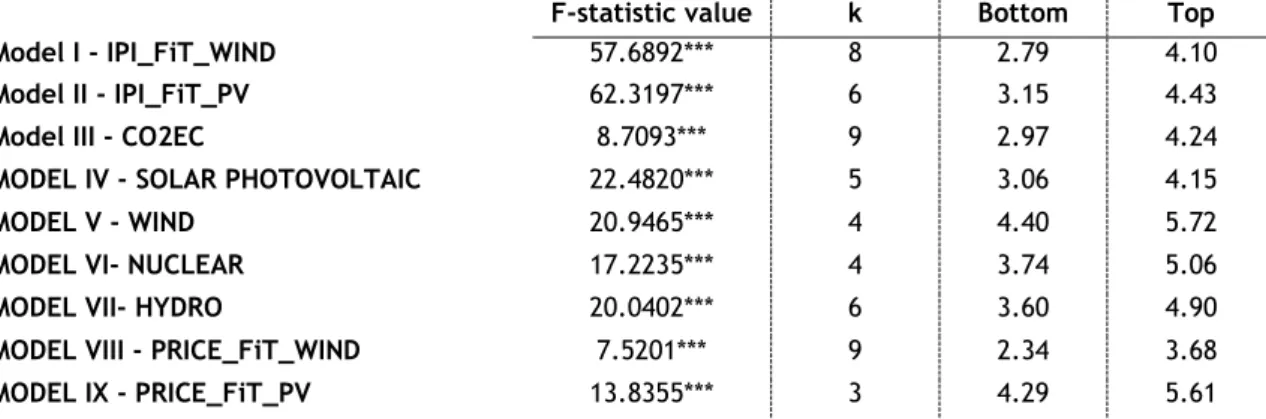
The bounds test was calculated using the Wald test. All the long-run coefficients were equal to zero and the null hypothesis is no cointegration relationship. The results indicate the rejection of the null hypothesis at a 1% level of significance. Thus, there is a relationship in the long-run between the variables, i.e. the variables move together in the long-run.
Table 7: ARDL Bounds tests
F-statistic value k Bottom Top
Model I - IPI_FiT_WIND 57.6892*** 8 2.79 4.10
Model II - IPI_FiT_PV 62.3197*** 6 3.15 4.43
Model III - CO2EC 8.7093*** 9 2.97 4.24
MODEL IV - SOLAR PHOTOVOLTAIC 22.4820*** 5 3.06 4.15
MODEL V - WIND 20.9465*** 4 4.40 5.72
MODEL VI- NUCLEAR 17.2235*** 4 3.74 5.06
MODEL VII- HYDRO 20.0402*** 6 3.60 4.90
MODEL VIII - PRICE_FiT_WIND 7.5201*** 9 2.34 3.68
MODEL IX - PRICE_FiT_PV 13.8355*** 3 4.29 5.61
Notes: k corresponds to the number of independent long-term variables, bottom and top are the critical
values at 1%. *** means the level of significance at 1%. The critical values are from Pesaran et al., (2001).
5. Discussion
The feed-in system has been one of the systems adopted in energy policies in almost the entire world to increase the electricity produced by RES. The results of this research reveal, in some cases, surprising evidences even so supported in the literature. Both FiTs and FiPs have a negative impact on electricity generation by wind power (Romano et al., 2017). Law 2/2013 was implemented, and revoked the FiPs subsides. Furthermore, FiTs were replaced with investment incentives, according to law 9/2013 (Boletín Oficial del Estado, 2013b). These investment incentives only cover the electricity sold on the electricity market, income investments (at a certain level), and they are not paid by electricity consumers.
According to the laws mentioned, one of the criteria in attributing subsidies is to diminish the risk of the investment to producers. Thus, support mechanisms attributed to producers of renewable sources are a kind of guaranteed subsidy for a maximum period of twenty-five years (depending on the type of technology). Hence, laws 2/2013 and 9/2013 are only applicable to new producers. Therefore, the negative impact of both FiTs and FiPs on the electricity production from wind source could be reflecting the subsidies that are still being paid to old producers, effectively becoming a rent for the economy. Both FiTs and FiPs are paid on top of the wholesale electricity market price, so that the additional tariff paid by consumers will always increase the wholesale price. Hence, consumers decide to consume less, and the demand curve goes down. With less demand, producers will adjust their supply, reducing electricity production (the supply curve moves to the left). Even though FiTs are paid according to the electricity produced, the producers still benefit from not producing high levels of electricity. Once, the marginal cost is the same while electricity prices increase. In fact, producers could be receiving the tariffs despite not investing them.
Considering the importance of the impact of the feed-in system on economic activity, it is noticed that supports for the wind and solar power were seen to have differing effects. On the one hand, support for the wind electricity production has had a positive impact on economic growth. On the other hand, FiTs for solar PV have had a negative impact on economic activity. In fact, between the years of 1965 and 1990, Japan and the United States of America (USA) were leaders in the manufacture of photovoltaic cells and models. When the subsidies for manufacturing PV cells and models in the USA were cut, the manufacturing companies were bought by competitors such Germany and France. Surprisingly, in the mid-2000s, China started to take over PV manufacturing technology. Nowadays, China supplies, more or less, 60% of solar photovoltaic technology. The transferral of the manufacturing of PV, from Europe to China, caused a negative impact to European producers of renewables, once it has made the feed-in systems losing their effectiveness. Accordingly, subsidies, such feed-in tariffs, that used to encourage the deployment of renewable energy sources were reduced (Binz et al., 2017).
The displacement of the conventional sources of the electricity market is a big concern for producers in terms of price and production. Producers of flexible energy sources in Spain appear to be recognising this risk. Therefore, capacity payments are attributed to reduce the uncertainty for these producers, decreasing market price. Moreover, capacity payments could be seen as a kind of risk premium, and thus, contribute to the competitiveness of the electricity market. The results of this research highlight that electricity produced by fuel/gas is reducing the market price (Ciarreta et al., 2017). Indeed, fuel/gas producers could be following the prices charged by RES producers, so as not to be dispensed from the electricity market.
Furthermore, it is noticed that fossil fuels such as fuel/gas and nuclear are stimulating the production of hydro and solar PV power, respectively. This result evidenced the backup role of the fossil fuels on renewables. Moreover, the results of this research highlight the importance of the deployment of solar PV power. The positive signal of the intensity of CO2 emissions could be inducing the production of electricity from solar PV power. Indeed, solar PV electricity production is contributing positively for the economic activity. These results could be a consequence of the increase of electricity production by micro producers through the installation of solar PV panels in their residences or in industrial facilities.
With respect to the environment, the reduction of CO2 emissions is a priority worldwide to reduce global warming. The introduction of RES in the electricity market in Spain seems to be helping the achievement of European Union targets. Additionally, carbon taxes were implemented to reduce CO2 emissions, thus increasing electricity prices (Bhandari et al., 2017). The intensity of CO2 emissions reveals to be increasing the market price. This effect could be a result of the incorporation of carbon taxes in the market price.
Overall, the inclusion of the feed-in system in the electricity market was not found to be contributing to an increase in electricity production by solar and wind farms. This could be a consequence of tariffs that are being paid by consumers. Moreover, capacity payments were shown to decrease market price. These payments, can also be considered as a risk premium, making flexible energy sources more inclined to bid lower and make the electricity market more competitive. The backup role of conventional energy sources on new renewable energy sources is also verified, and in case of hydro and wind power, which could be being incentivised by the attribution of capacity payments.
6. Conclusion
This study empirically analyses the impact of three types of support mechanism, namely: FiTs, FiPs and capacity payments, in electricity production, as well as in the interactions between different electricity sources, while controlling for market price. Policies are implemented to increase the deployment of RES. Due to the renewables’ intermittent characteristics, it may be hard to establish an equilibrium of production in the electricity market. Electricity demand always has to be satisfied, and renewables are not entirely dependable in this aspect. Hence, policymakers decided to attribute subsidies to controllable energy sources, so that they remained available in case of need to inject electricity into the grid. This mechanism ensures the availability of these kind of energy sources being ready to use.
Support mechanisms for renewables were not shown to be efficient, in terms of electricity produced, which could be a consequence of overloading consumers with tariff payments. On the one hand, the costs associated with wind power deployment may remain high. On the other hand, electricity production by solar PV power is boosting the economic activity. Thus, energy policies should be focused on the deployment of the solar PV energy source, particularly by incentivising consumers to generate their own electricity and thus become prosumers. Capacity payments were shown to positively affect electricity production of both wind and hydro power. Moreover, fuel/gas electricity production is contributing positively to the increase of electricity production through hydro power.
The results of this research highlight the need to design and implement energy policies regarding specific sources. The high costs of wind power indicate a need to implement market instruments rather than policies with guaranteed prices. Moreover, incentives should also be formulated incorporating the demand-side management. To assure a smoother and more economically bearable energy transition, policymakers should implement policies to make consumers more responsive, and to incentivise them to produce their own electricity.
References
Antweiler, W., 2017. A two-part feed-in-tariff for intermittent electricity generation ଝ. Energy Econ. 65, 458–470. https://doi.org/10.1016/j.eneco.2017.05.010
Bajo-buenestado, R., 2017. Welfare implications of capacity payments in a price-capped electricity sector : A case study of the Texas market ( ERCOT ). Energy Econ. 64, 272– 285. https://doi.org/10.1016/j.eneco.2017.03.026
Ballester, C., Furió, D., 2015. Effects of renewables on the stylized facts of electricity prices. Renew. Sustain. Energy Rev. 52, 1596–1609. https://doi.org/10.1016/j.rser.2015.07.168 Bhagwat, P.C., Iychettira, K.K., Richstein, J.C., Chappin, E.J.L., De Vries, L.J., 2017. The
effectiveness of capacity markets in the presence of a high portfolio share of renewable energy sources. Util. Policy 48, 76–91. https://doi.org/10.1016/j.jup.2017.09.003 Bhandari, V., Giacomoni, A.M., Wollenberg, B.F., Wilson, E.J., 2017. Interacting policies in
power systems : Renewable subsidies and a carbon. Electr. J. 0–1. https://doi.org/10.1016/j.tej.2017.06.004
Binz, C., Tang, T., Huenteler, J., 2017. Spatial lifecycles of cleantech industries – The global development history of solar photovoltaics. Energy Policy 101, 386–402.
https://doi.org/10.1016/j.enpol.2016.10.034
Boletín Oficial del Estado, 2013a. Boletín oficial del estado 9072–9077. Boletín Oficial del Estado, 2013b. Boletín oficial del estado.
Brini, R., Amara, M., Jemmali, H., 2017. Renewable energy consumption , International trade , oil price and economic growth inter-linkages : The case of Tunisia. Renew. Sustain. Energy Rev. 76, 620–627. https://doi.org/10.1016/j.rser.2017.03.067
Bublitz, A., Keles, D., Fichtner, W., 2017. An analysis of the decline of electricity spot prices in Europe : Who is to blame ? Energy Policy 107, 323–336.
https://doi.org/10.1016/j.enpol.2017.04.034
Ciarreta, A., Espinosa, M.P., Pizarro-Irizar, C., 2017. Has renewable energy induced competitive behavior in the Spanish electricity market? Energy Policy 104, 171–182. https://doi.org/10.1016/j.enpol.2017.01.044
Dickey, D.A., Fuller, W.A., 1979. Distribution of the Estimators for Autoregressive Time Series With a Unit Root. J. Am. Stat. Assoc. 74, 427–431. https://doi.org/10.2307/2286348
Fogelberg, S., Lazarczyk, E., 2017. Wind power volatility and its impact on production failures in the Nordic electricity market. Renew. Energy 105, 96–105.
https://doi.org/10.1016/j.renene.2016.12.024
Hach, D., Spinler, S., 2016. Capacity payment impact on gas-fired generation investments under rising renewable feed-in - A real options analysis. Energy Econ. 53, 270–280. https://doi.org/10.1016/j.eneco.2014.04.022
Ibanez-lopez, A.S., Martinez-val, J.M., Moratilla-soria, B.Y., 2017. A dynamic simulation model for assessing the overall impact of incentive policies on power system reliability , costs and environment. Energy Policy 102, 170–188.
https://doi.org/10.1016/j.enpol.2016.12.026
Kwiatkowski, D., Phillips, P.C.B., Schmidt, P., Shinb, Y., 1992. Testing the null hypothesis of stationary against the alternative of a unit root. J. Econom. 54, 159–178.
https://doi.org/http://dx.doi.org/10.1016/0304-4076(92)90104-Y
Kyritsis, E., Andersson, J., Serletis, A., 2017. Electricity prices , large-scale renewable integration , and policy implications. Energy Policy 101, 550–560.
https://doi.org/10.1016/j.enpol.2016.11.014
Marques, A.C., Fuinhas, J.A., Afonso, T.L., 2015. The dynamics of the Italian electricity generation system: An empirical assessment. WSEAS Trans. Bus. Econ. 12, 229–238. Marques, A.C., Fuinhas, J.A., Menegaki, A.N., 2016. Renewable vs non-renewable electricity
and the industrial production nexus: Evidence from an ARDL bounds test approach for Greece. Renew. Energy 96, 645–655. https://doi.org/10.1016/j.renene.2016.05.033 Marques, A.C., Fuinhas, J.A., Menegaki, A.N., 2014. Interactions between electricity
generation sources and economic activity in Greece: A VECM approach. Appl. Energy 132, 34–46. https://doi.org/10.1016/j.apenergy.2014.06.073
Martinez-anido, C.B., Brinkman, G., Hodge, B., 2016. The impact of wind power on electricity prices. Renew. Energy 94, 474–487. https://doi.org/10.1016/j.renene.2016.03.053 Ministerio de Industria Turismo y Comercio, 2007. I .
Mirza, F.M., Kanwal, A., 2017. Energy consumption , carbon emissions and economic growth in Pakistan : Dynamic causality analysis. Renew. Sustain. Energy Rev. 72, 1233–1240. https://doi.org/10.1016/j.rser.2016.10.081
Europe. Renew. Sustain. Energy Rev. 74, 412–423. https://doi.org/10.1016/j.rser.2016.12.032
Norberto, C., Gonzalez-Brambila, C.N., Matsumoto, Y., 2016. Systematic analysis of factors affecting solar PV deployment. J. Energy Storage 6, 163–172.
https://doi.org/10.1016/j.est.2016.04.003
Ohler, A., Fetters, I., 2014. The causal relationship between renewable electricity generation and GDP growth : A study of energy sources ☆. Energy Econ. 43, 125–139.
https://doi.org/10.1016/j.eneco.2014.02.009
Pesaran, M.H., Shin, Y., Smith, R.J., 2001. Bounds testing approaches to the analysis of long run relationships. J. Appl. Econom. 16, 289–326. https://doi.org/10.1002/jae.616 Phillips, P.C.B., Perron, P., 1988. Testing for a unit root in time series regression. Biometrika
75, 335–346. https://doi.org/10.1093/biomet/75.2.335
Red Eléctrica de España, 2016. Renewable energy in the Spanish electricity system 2016. Romano, A.A., Scandurra, G., Carfora, A., Fodor, M., 2017. developed countries crossmark.
Renew. Sustain. Energy Rev. 68, 738–747. https://doi.org/10.1016/j.rser.2016.10.024 Salim, R.A., Hassan, K., Shafiei, S., 2014. Renewable and non-renewable energy consumption
and economic activities: Further evidence from OECD countries. Energy Econ. 44, 350– 360. https://doi.org/10.1016/j.eneco.2014.05.001
Schallenberg-rodriguez, J., 2017. Renewable electricity support systems : Are feed-in systems taking the lead ? Renew. Sustain. Energy Rev. 76, 1422–1439.
https://doi.org/10.1016/j.rser.2017.03.105
Schallenberg-rodriguez, J., 2014. Renewable electricity support system : Design of a variable premium system based on the Spanish experience. Renew. Energy 68, 801–813.
https://doi.org/10.1016/j.renene.2014.03.009
Siddiqui, A.S., Salo, A., Rintam, T., 2016. How much is enough ? Optimal support payments in a renewable-rich power system 117, 300–313.
https://doi.org/10.1016/j.energy.2016.10.058
Yang, C., Meng, C., Zhou, K., 2017. Residential electricity pricing in China : The context of price-based demand response. Renew. Sustain. Energy Rev. 1–9.