metals
ArticleAluminum and Nickel Matrix Composites Reinforced
by CNTs: Dispersion/Mixture by Ultrasonication
Sónia Simões1,* ID, Filomena Viana1 ID, Marcos A. L. Reis2and Manuel F. Vieira1 ID
1 CEMMPRE, Department of Metallurgical and Materials Engineering, University of Porto, R. Dr. Roberto Frias, 4200-465 Porto, Portugal; [email protected] (F.V.); [email protected] (M.F.V.)
2 Faculdade de Ciências Exatas e Tecnologia, Universidade Federal do Pará, Abaetetuba, PA 68440-000, Brazil; [email protected]
* Correspondence: [email protected]; Tel.: +35-122-041-3113
Received: 21 June 2017; Accepted: 18 July 2017; Published: 22 July 2017
Abstract: The main challenge in the production of metal matrix composites reinforced by carbon nanotubes (CNTs) is the development of a manufacturing process ensuring the dispersion of nanoparticles without damaging them, and the formation of a strong bond with the metallic matrix to achieve an effective load transfer, so that the maximum reinforcement effect of CNTs will be accomplished. This research focuses on the production by powder metallurgy of aluminum and nickel matrix composites reinforced by CNTs, using ultrasonication as the dispersion and mixture process. Microstructural characterization of nanocomposites was performed by optical microscopy (OM), scanning and transmission electron microscopy (SEM and TEM), electron backscattered diffraction (EBSD) and high-resolution transmission electron microscopy (HRTEM). Microstructural characterization revealed that the use of ultrasonication as the dispersion and mixture process in the production of Al/CNT and Ni/CNT nanocomposites promoted the dispersion and embedding of individual CNT in the metallic matrices. CNT clusters at grain boundary junctions were also observed. The strengthening effect of the CNTs is shown by the increase in hardness for all nanocomposites. The highest hardness values were observed for Al/CNT and Ni/CNT nanocomposites, with a 1.00 vol % CNTs.
Keywords: metal matrix composites; nickel; aluminum; carbon nanotubes; powder metallurgy; ultrasonication; microstructural characterization
1. Introduction
Metal matrix composites demonstrate a range of fascinating properties, especially high mechanical ones, including high strength and stiffness, a desirable coefficient of thermal expansion and good damping properties [1,2]. Several investigations have been conducted into the development of metal matrix composites with different types of nanometric reinforcing materials. Ceramic nanoparticles, carbon nanotubes (CNTs) and graphene have been reported as the most promising reinforcements [3–5]. Among these, the CNTs stand out for their extraordinary properties, making them highly attractive for use as reinforcements. CNTs have been used to reinforce several metallic matrices, such as aluminum [6,7], nickel [8,9], copper [10,11], titanium [12] and magnesium [13,14], due to their extraordinary mechanical properties and excellent electrical conductivity [15,16].
The successful development of a production process that promotes a uniform and dense dispersion of CNTs in the matrix, without damaging them, is essential for obtaining the expected strengthening of nanocomposites. An effective load transfer from the metallic matrices to the CNTs is the key for the successful production of these nanocomposites. Several techniques have been suggested as adequate for this: conventional sintering [12,17], hot pressing [18,19], hot extrusion [20,21], thermal spraying [22,23] and electrodeposition [24,25], which appear to be the most promising. The possibility
Metals 2017, 7, 279 2 of 11
of producing these nanocomposites by powder metallurgy routes is quite interesting, since it allows the production of dense, near net shape components with complex geometries. However, the sintering temperatures for some of these matrices, such as nickel, copper and titanium, can induce high CNT damage and thus compromise the mechanical properties.
Several methods have been reported to obtain a uniform dispersion of CNTs through the matrix, with the mechanical ones, such as ball milling or sonication, being the most common [26–31]. In the ball milling method, a large amount of energy is involved, since the dispersion is achieved by collisions of dense and rigid balls with the CNTs. Due to this high-energy milling, CNTs suffer damage, which causes a degradation of their properties. However, this method performed with lower energy and shorter times can be used with the aim of reducing the length of the nanotubes [26]. The ultrasonication method involves the dispersion of the CNTs in a liquid, using ultrasound energy. It is a very efficient method for obtaining untangled CNTs dispersed in liquids, such as ethanol, isopropanol, ethylene glycol or acids [27]. The efficiency of this dispersion technique depends on the liquid, ultrasound energy, time and type of CNTs; the time required for dispersion is a crucial factor, since a considerable length of time leads to CNT damage [29,30].
In previous studies [29–31], ultrasonication was used to disperse and mix the metallic powders with CNTs, which is an effective dispersion/mixing process causing only a small amount of damage to the CNT structure. However, the studies on dispersion methods already published focus on a specific matrix, and it is difficult to generalize to matrices with a different composition or particle size. In this context, the main aim of this research is to extend the dispersion/mixture process already used on the Al/CNT nanocomposites to nickel matrix nanocomposites. Nickel is a high sintering temperature metal with mechanical strength higher than aluminum, which will allow testing the effect of the manufacture conditions on CNTs’ damage. Also, nickel does not form carbides by reacting with CNT as it was observed in Al/CNT nanocomposites.
For the evaluation of the effects of this process on the production of the nanocomposites, it is essential to understand the relationship between the microstructure and the mechanical properties. Microstructural characterization was performed by optical microscopy (OM), scanning and transmission electron microscopies (SEM and TEM), electron backscattered diffraction (EBSD) and high-resolution transmission electron microscopy (HRTEM); mechanical properties evaluation was undertaken by Vickers microhardness tests.
2. Materials and Methods 2.1. Materials
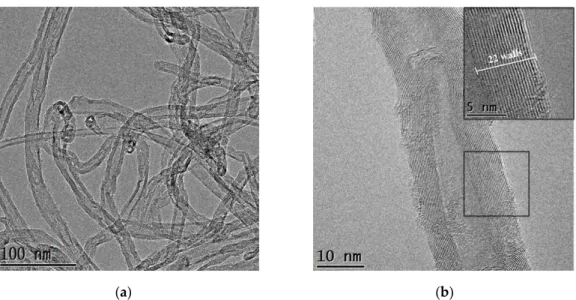
CNTs used in this investigation (from Fibermax Nanocomposites) are multi-walled carbon nanotubes (MWCNTs). Figure1shows the morphology and structure of the as-received CNTs. The MWCNTs exhibit inner and outer diameters of 5±1 and 19±6 nm respectively. As-received CNTs were entangled and had a large aspect ratio (Figure1a). In order to achieve good dispersion in the production of the nanocomposites, the untangling of CNTs is essential before they are mixed with the metallic powders.
A more detailed observation of MWCNT morphology is presented in the HRTEM image of Figure1b. The image shows an MWCNT with 20 walls. These walls show few defects; however, it is possible to observe the bamboo-type structure characteristic of MWCNTs produced by chemical vapor deposition.
The aluminum and nickel powders (from Goodfellow) have a maximum particle size of 65 µm and 60 µm respectively, and a purity of 99.5%. Figure2shows the SEM images of as-received aluminum and nickel powders and the distributions of the particle sizes.
Metals 2017, 7, 279 3 of 11
Metals 2017, 7, 279 3 of 11
(a) (b)
Figure 1. (a) TEM image of as-received carbon nanotubes (CNTs), and (b) high-resolution transmission electron microscopy (HRTEM) image of a CNT showing the morphology and structure of the multi-walled carbon nanotubes (MWCNTs) as well as detail showing the number of walls measured for this CNT.
(a) (b)
(c) (d)
Figure 2. SEM images and particle size distributions of: (a) and (b) aluminum and (c) and (d) nickel powders.
Figure 1.(a) TEM image of as-received carbon nanotubes (CNTs), and (b) high-resolution transmission electron microscopy (HRTEM) image of a CNT showing the morphology and structure of the multi-walled carbon nanotubes (MWCNTs) as well as detail showing the number of walls measured for this CNT.
Metals 2017, 7, 279 3 of 11
(a) (b)
Figure 1. (a) TEM image of as-received carbon nanotubes (CNTs), and (b) high-resolution transmission electron microscopy (HRTEM) image of a CNT showing the morphology and structure of the multi-walled carbon nanotubes (MWCNTs) as well as detail showing the number of walls measured for this CNT.
(a) (b)
(c) (d)
Figure 2. SEM images and particle size distributions of: (a) and (b) aluminum and (c) and (d) nickel powders.
Figure 2. SEM images and particle size distributions of: (a) and (b) aluminum and (c) and (d) nickel powders.
Metals 2017, 7, 279 4 of 11
2.2. Production of Nanocomposites
To produce the nanocomposites, the MWCNTs were dispersed and mixed with metallic powders in isopropanol using an ultrasonicator for 15 min, as described in [29,30]. The mixtures were dried and uniaxially pressed with 300 MPa for Al/CNTs and 900 MPa for Ni/CNTs. Compacts of 6 mm diameter and 2 mm thickness were produced with different content of CNTs (ranging from 0.50 to 2.00 vol %) and pressureless sintered under a vacuum better than 10−2Pa. The sintering was performed at 640◦C with a dwell time of 90 min for Al/CNTs and at 950◦C with a dwell time of 120 min for Ni/CNT nanocomposites.
2.3. Nanocomposites Characterization
2.3.1. Microstructural Characterization
Microstructural characterization of cross-sections perpendicular to the compaction direction of the nanocomposites was performed by optical microscopy (OM) (DM4000, Leica Microsystems, Wetzlar, Germany), scanning and transmission electron microscopies (SEM and TEM), selected area electron diffraction (SAED), electron backscattered diffraction (EBSD), high-resolution transmission electron microscopy (HRTEM) and fast Fourier transform (FFT) analysis. A high-resolution FEI QUANTA 400 FEG SEM (FEI Company, Hillsboro, OR, USA), a JEOL JEM 2010F (JEOL Ltd., Tokyo, Japan) and an FEI Tecnai G2 (FEI Company, Hillsboro, OR, USA) were used for this purpose. Electron transparent cross sections of nanocomposites were prepared by the lift-out technique at 5–30 keV, using the focused ion beam (FIB) (FEI FIB200, FEI Company, Hillsboro, OR, USA).
The distribution and size of CNT clusters through the matrices and the composite average grain size were evaluated using an OM and Leica Application Suite software (Leica Microsystems, Wetzlar, Germany). The dispersion of the CNT clusters was assessed by measuring the number and average diameter of the clusters in five fields of 489×653 µm2.
2.3.2. Mechanical Characterization
Mechanical characterization was performed by microhardness tests. The hardness was evaluated by Vickers microhardness using a 98 mN load (Duramin-1, Struers A/S, Ballerup, Denmark); ten tests were performed on cross-sections of each sample.
Al/CNT and Ni/CNT nanocomposites and aluminum and nickel samples produced under the same processing conditions were also tested.
3. Results and Discussion
3.1. Microstructural Characterization of Nanocomposites
Al/CNT and Ni/CNT nanocomposites were produced by powder metallurgy using ultrasonication as the dispersion/mixture process. Different CNT contents were used to evaluate the conditions leading to a higher strengthening by CNT reinforcement. Figure3shows the microstructures of the nanocomposites produced with 1.00 vol % of CNTs. From the OM images of Figure3, it is observed that the microstructures of the Al/CNT and Ni/CNT nanocomposites are very similar. In these OM images, it is possible to observe that equiaxied grains characterize the nanocomposites; at some grain boundary junctions, dark areas are observed that are larger than typical grain boundaries. By SEM analysis (Figure4) it is clear that these zones correspond to CNT clusters.
TEM and HRTEM observations revealed the presence of individual CNTs well-dispersed and embedded in the metallic matrices (Figure 5). In Figure 5a,b some examples of CNTs (marked with black arrows) inside the grains of the matrix can be observed. HRTEM images of Figure5c revealed a CNT well-bonded to the metallic matrix. In a previous work [29], the formation of Al4C3
by reaction of the CNTs with the aluminum matrix was observed by HRTEM in a nanocomposite produced by this method. The reaction of the CNTs with the aluminum matrix was also reported by
Metals 2017, 7, 279 5 of 11
other researchers [32,33]. In contrast, there was no evidence of any type of reaction between nickel and CNTs.
Metals 2017, 7, 279 5 of 11
this method. The reaction of the CNTs with the aluminum matrix was also reported by other researchers [32,33]. In contrast, there was no evidence of any type of reaction between nickel and CNTs.
(a) (b)
(c) (d)
Figure 3. Optical microscopy (OM) images of the nanocomposites produced with 1.00 vol % of CNTs: (a) and (b) Al/CNTs and (c) and (d) Ni/CNTs.
Figure 4. SEM image of the Al/CNT nanocomposites produced with 1.00 vol % of CNTs .
The number and size of the CNT clusters depends on the content of reinforcement. For both matrices, it is observed that a better dispersion, of smaller cluster size, is obtained for the nanocomposites produced with 1.00 vol % of CNTs. The increase in the content of CNTs promotes the increase in the size of the clusters and a non-uniform dispersion, measured by OM (Table 1).
Figure 3.Optical microscopy (OM) images of the nanocomposites produced with 1.00 vol % of CNTs: (a) and (b) Al/CNTs and (c) and (d) Ni/CNTs.
Metals 2017, 7, 279 5 of 11
this method. The reaction of the CNTs with the aluminum matrix was also reported by other researchers [32,33]. In contrast, there was no evidence of any type of reaction between nickel and CNTs.
(a) (b)
(c) (d)
Figure 3. Optical microscopy (OM) images of the nanocomposites produced with 1.00 vol % of CNTs: (a) and (b) Al/CNTs and (c) and (d) Ni/CNTs.
Figure 4. SEM image of the Al/CNT nanocomposites produced with 1.00 vol % of CNTs .
The number and size of the CNT clusters depends on the content of reinforcement. For both matrices, it is observed that a better dispersion, of smaller cluster size, is obtained for the nanocomposites produced with 1.00 vol % of CNTs. The increase in the content of CNTs promotes the increase in the size of the clusters and a non-uniform dispersion, measured by OM (Table 1).
Figure 4.SEM image of the Al/CNT nanocomposites produced with 1.00 vol % of CNTs .
The number and size of the CNT clusters depends on the content of reinforcement. For both matrices, it is observed that a better dispersion, of smaller cluster size, is obtained for the nanocomposites produced with 1.00 vol % of CNTs. The increase in the content of CNTs promotes the increase in the size of the clusters and a non-uniform dispersion, measured by OM (Table1). These
Metals 2017, 7, 279 6 of 11
two parameters are essential in order to understand the effect of the dispersion process and of the content of CNTs in the production of the nanocomposites.
Metals 2017, 7, 279 6 of 11
These two parameters are essential in order to understand the effect of the dispersion process and of the content of CNTs in the production of the nanocomposites.
(a) (b)
(c)
Figure 5. TEM images of the (a) Al/CNTs and (b) Ni/CNTs with the selected area electron diffraction (SAED) of the matrix and (c) HRTEM image showing a CNT.
The powder metallurgy process is characterized by the production of samples with some porosity. The aluminum and nickel samples exhibit a porosity of around 1% (Table 1). This porosity hinders the identification of clusters in nanocomposites. The SEM observations of the microstructures reveal that the pores are filled by CNTs, though it is not guaranteed that all pores will have been filled. In this context, the percentage of pores and CNT clusters was measured jointly. Table 1 shows the values as well as the maximum size of the CNT clusters. The effect of the CNT content on the percentage of pores, plus CNT clusters for the Al/CNT and Ni/CNT nanocomposites is evident. As expected, the increase in the content of CNTs leads to an increase in the number of pores plus CNT clusters. The best dispersion is obtained for the nanocomposites produced with 1.00 vol % of CNTs as for this composition the nanocomposites revealed the smaller size of the CNT clusters.
In order to evaluate the influence of the introduction of the CNTs on the microstructure of aluminum and nickel matrices, the grain size and crystallographic orientation were investigated by Figure 5.TEM images of the (a) Al/CNTs and (b) Ni/CNTs with the selected area electron diffraction (SAED) of the matrix and (c) HRTEM image showing a CNT.
The powder metallurgy process is characterized by the production of samples with some porosity. The aluminum and nickel samples exhibit a porosity of around 1% (Table1). This porosity hinders the identification of clusters in nanocomposites. The SEM observations of the microstructures reveal that the pores are filled by CNTs, though it is not guaranteed that all pores will have been filled. In this context, the percentage of pores and CNT clusters was measured jointly. Table1shows the values as well as the maximum size of the CNT clusters. The effect of the CNT content on the percentage of pores, plus CNT clusters for the Al/CNT and Ni/CNT nanocomposites is evident. As expected, the increase in the content of CNTs leads to an increase in the number of pores plus CNT clusters. The best dispersion is obtained for the nanocomposites produced with 1.00 vol % of CNTs as for this composition the nanocomposites revealed the smaller size of the CNT clusters.
In order to evaluate the influence of the introduction of the CNTs on the microstructure of aluminum and nickel matrices, the grain size and crystallographic orientation were investigated by
Metals 2017, 7, 279 7 of 11
EBSD. Figure6shows the grain size maps and distributions of samples produced with 0.00 vol % and 1.00 vol % of CNTs.
Table 1.Maximum size of CNT clusters, percentage of porosity and CNT clusters and average grain size as a function of the CNT content.
Composites CNT Content (vol
%) Porosity and CNT Clusters (vol %) Maximum Size of CNT Clusters (µm) Average Grain Size (µm) Al/CNT 0 1.001 - 17 0.50 4.88 89 16 0.75 6.53 102 15 1.00 5.95 78 16 1.50 7.38 177 16 Ni/CNT 0 1.051 - 15 0.50 3.22 83 14 0.75 3.96 155 13 1.00 6.67 137 14 1.50 12.47 310 16
1This value only represents the vol % of pores.
Metals 2017, 7, 279 7 of 11
EBSD. Figure 6 shows the grain size maps and distributions of samples produced with 0.00 vol % and 1.00 vol % of CNTs.
(a) (b)
(c) (d)
Figure 6. Grain size maps and distributions of the (a) aluminum and (b) nickel matrices and (c) Al/CNTs and (d) Ni/CNTs nanocomposites.
All nanocomposites had an average grain size similar to the sample produced without CNTs (pure metallic matrix subject to the same production conditions). Table 1 presents the average grain sizes for the pure metal and nanocomposites. Contrary to what has been reported by other authors [34], grain refinement is not clearly observed for Al/CNT and Ni/CNT nanocomposites.
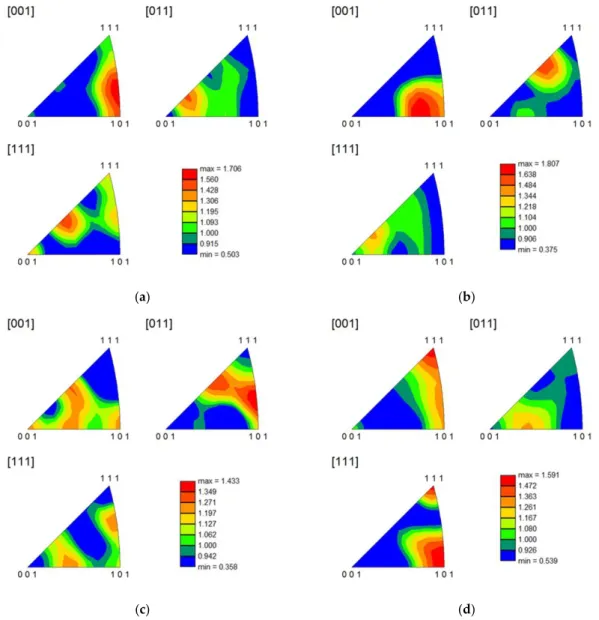
The inverse pole figures of the two metallic matrices and nanocomposites can be seen in Figure 7. The analysis of this figure showed that the addition of CNTs affects the crystallographic orientation of the grains. However, the pure matrices and the Al/CNT and Ni/CNT nanocomposites do not have a strong preferred crystallographic orientation (texture); i.e., the incorporation of CNTs in the metallic matrices does not promote the formation of a strong texture. This aspect is very important, since a strong texture can significantly affect the mechanical properties.
Figure 6. Grain size maps and distributions of the (a) aluminum and (b) nickel matrices and (c) Al/CNTs and (d) Ni/CNTs nanocomposites.
Metals 2017, 7, 279 8 of 11
All nanocomposites had an average grain size similar to the sample produced without CNTs (pure metallic matrix subject to the same production conditions). Table1presents the average grain sizes for the pure metal and nanocomposites. Contrary to what has been reported by other authors [34], grain refinement is not clearly observed for Al/CNT and Ni/CNT nanocomposites.
The inverse pole figures of the two metallic matrices and nanocomposites can be seen in Figure7. The analysis of this figure showed that the addition of CNTs affects the crystallographic orientation of the grains. However, the pure matrices and the Al/CNT and Ni/CNT nanocomposites do not have a strong preferred crystallographic orientation (texture); i.e., the incorporation of CNTs in the metallic matrices does not promote the formation of a strong texture. This aspect is very important, since a strong texture can significantly affect the mechanical properties.
Metals 2017, 7, 279 8 of 11
Table 1. Maximum size of CNT clusters, percentage of porosity and CNT clusters and average grain size as a function of the CNT content.
Composites
CNT Content
(vol %)
Porosity and
CNT Clusters
(vol %)
Maximum Size of
CNT Clusters (
m)
Average Grain
Size (
m)
Al/CNT 0 1.00 1 - 17 0.50 4.88 89 16 0.75 6.53 102 15 1.00 5.95 78 16 1.50 7.38 177 16 Ni/CNT 0 1.05 1 - 15 0.50 3.22 83 14 0.75 3.96 155 13 1.00 6.67 137 14 1.50 12.47 310 161 This value only represents the vol % of pores.
(a) (b)
(c) (d)
Figure 7. Inverse pole figures of the (a) aluminum and (b) nickel matrices and (c) Al/CNTs and (d) Ni/CNTs nanocomposites.
Figure 7. Inverse pole figures of the (a) aluminum and (b) nickel matrices and (c) Al/CNTs and (d) Ni/CNTs nanocomposites.
Microstructural characterization has shown that it is possible to produce nanocomposites of different matrices (aluminum and nickel) by powder metallurgy, using ultrasonication as a process for dispersing and mixing the powders and CNTs in a single step. The behavior of the two matrices is quite similar. In both cases, the content of CNTs seems to significantly affect their dispersion. Summing up, the results indicate that to obtain the best CNT dispersion, 1.00 vol % of CNTs must be used
Metals 2017, 7, 279 9 of 11
for both matrices. Higher contents of CNTs only promote the formation of larger clusters and a less uniform dispersion. The CNTs introduction does not promote significant microstructural changes, either in grain size or in the formation of textures.
3.2. Mechanical Characterization of Nanocomposites
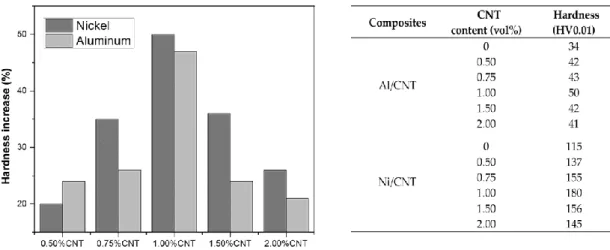
The mechanical characterization of the nanocomposites was performed by Vickers hardness tests. Figure 8shows the results of the hardness for the Al/CNT and Ni/CNT nanocomposites reinforced with different contents of CNTs; the bar chart shows the increase in the hardness of the nanocomposites relative to the samples without CNTs produced for comparison purposes. For both metal matrix composites, the highest hardness values were observed for 1.00 vol % of CNTs; these values correspond to an increase in 50% when compared to the hardness of pure metallic matrices.
Metals 2017, 7, 279 9 of 11
Microstructural characterization has shown that it is possible to produce nanocomposites of different matrices (aluminum and nickel) by powder metallurgy, using ultrasonication as a process for dispersing and mixing the powders and CNTs in a single step. The behavior of the two matrices is quite similar. In both cases, the content of CNTs seems to significantly affect their dispersion. Summing up, the results indicate that to obtain the best CNT dispersion, 1.00 vol % of CNTs must be used for both matrices. Higher contents of CNTs only promote the formation of larger clusters and a less uniform dispersion. The CNTs introduction does not promote significant microstructural changes, either in grain size or in the formation of textures.
3.2. Mechanical Characterization of Nanocomposites
The mechanical characterization of the nanocomposites was performed by Vickers hardness tests. Figure 8 shows the results of the hardness for the Al/CNT and Ni/CNT nanocomposites reinforced with different contents of CNTs; the bar chart shows the increase in the hardness of the nanocomposites relative to the samples without CNTs produced for comparison purposes. For both metal matrix composites, the highest hardness values were observed for 1.00 vol % of CNTs; these values correspond to an increase in 50% when compared to the hardness of pure metallic matrices.
The observed strengthening cannot be explained by a Hall–Petch or texture effect, since nanocomposites and metallic samples produced by the same method have similar grain sizes and weak textures. The CNTs embedded in the matrices form continuous and bonded interfaces with them (as can be observed in the HRTEM image presented in Figure 5c), thus assuring the effective load transfer, reinforcing the nanocomposites. The formation of carbides can also contribute to the strengthening; as previously mentioned, this was only observed in Al/CNT nanocomposites [29]. However, not all CNTs contribute to the strengthening of nanocomposites; the CNTs of the clusters observed in the grain junctions are not bonded to the matrix and cannot assure the load transfer. The increase of CNT content above 1 vol % leads to the formation of larger clusters, increasing the heterogeneous distribution of CNTs and thus leading to a softening.
Figure 8. The increase in the hardness (HV 0.01) of the nanocomposites relative to pure metallic matrices. The hardness values of all samples are listed in the table.
4. Conclusions
Aluminum and nickel nanocomposites reinforced by CNTs were successfully produced via a classical powder metallurgy route using ultrasonication as the dispersion/mixture process.
Individual CNTs dispersed and embedded in the matrix were observed through HRTEM, which is an essential factor for reinforcement. This observation confirms that the use of the ultrasonication method to disperse and mix is effective in the production of CNTs reinforced nanocomposites. However, the CNTs are also observed in clusters, mainly at grain boundary junctions. The better dispersion results were observed for the nanocomposites produced with 1.00 vol % of CNTs leading to the highest hardness values. The 50% hardness increase demonstrated the
Figure 8. The increase in the hardness (HV 0.01) of the nanocomposites relative to pure metallic matrices. The hardness values of all samples are listed in the table.
The observed strengthening cannot be explained by a Hall–Petch or texture effect, since nanocomposites and metallic samples produced by the same method have similar grain sizes and weak textures. The CNTs embedded in the matrices form continuous and bonded interfaces with them (as can be observed in the HRTEM image presented in Figure5c), thus assuring the effective load transfer, reinforcing the nanocomposites. The formation of carbides can also contribute to the strengthening; as previously mentioned, this was only observed in Al/CNT nanocomposites [29]. However, not all CNTs contribute to the strengthening of nanocomposites; the CNTs of the clusters observed in the grain junctions are not bonded to the matrix and cannot assure the load transfer. The increase of CNT content above 1 vol % leads to the formation of larger clusters, increasing the heterogeneous distribution of CNTs and thus leading to a softening.
4. Conclusions
Aluminum and nickel nanocomposites reinforced by CNTs were successfully produced via a classical powder metallurgy route using ultrasonication as the dispersion/mixture process.
Individual CNTs dispersed and embedded in the matrix were observed through HRTEM, which is an essential factor for reinforcement. This observation confirms that the use of the ultrasonication method to disperse and mix is effective in the production of CNTs reinforced nanocomposites. However, the CNTs are also observed in clusters, mainly at grain boundary junctions. The better dispersion results were observed for the nanocomposites produced with 1.00 vol % of CNTs leading to the highest hardness values. The 50% hardness increase demonstrated the strengthening effect of the CNTs. Above this, CNT content larger clusters are formed, which decreases the strengthening effect.
Metals 2017, 7, 279 10 of 11
Acknowledgments: This research is sponsored by FEDER funds through the program COMPETE-Programa Operacional Factores de Competitividade and by national funds through FCT-Fundação para a Ciência e a Tecnologia-under the project PEst-C/EME/UI0285/2013. The authors are grateful to CEMUP-Centro de Materiais da Universidade do Porto for expert assistance with SEM and EBSD.
Author Contributions: Sónia Simões produced and characterized the nanocomposites; Sónia Simões, Filomena Viana and Manuel F. Vieira discussed the microstructural and mechanical results. Marcos A. L. Reis and Manuel F. Vieira performed the mechanical tests. All the authors participated in the design of the experiments and cooperated in writing this paper.
Conflicts of Interest:The authors declare no conflict of interest. References
1. Kainer, K.U. Custom-made materials for automative and aerospace engineering. In Metal Matrix Nanocomposites; WILLEY-VCH Verlag GmbH & Co. KGaA: Weinheim, Germany, 2006; pp. 1–48.
2. Shirvanimoghaddam, K.; Hamim, S.U.; Akbari, M.K.; Fakhrhoseini, S.M.; Pakseresht, A.H.; Ghasali, E.; Zabet, M.; Munir, K.S.; Jia, S.; Davim, J.P.; et al. Carbon fiber reinforced metal matrix composites: Fabrication processes and properties. Compos. Part A 2017, 92, 70–96. [CrossRef]
3. Casati, R.; Vedani, M. Metal matrix composites reinforced by nano-particles-A review. Metals 2014, 4, 65–83. [CrossRef]
4. Zhang, Z.; Chen, D.L. Contribution of Orowan strengthening effect in particulate-reinforced metal matrix nanocomposites. Mater. Sci. Eng. A 2008, 483–484, 148–152. [CrossRef]
5. Zhang, Z.; Chen, D.L. Consideration of Orowan strengthening effect in particulate-reinforced metal matrix nanocomposites: A model for predicting their yield strength. Scr. Mater. 2006, 54, 1321–1326. [CrossRef] 6. Mansoor, M.; Shahid, M. Carbon-nanotube-reinforced aluminum composite by induction melting. J. Appl.
Res. Technol. 2016, 14, 215–225. [CrossRef]
7. Ostovan, F.; Matori, K.A.; Toozandehjani, M.; Oskoueian, A.; Yusoff, H.M.; Yunjus, R.; Ariff, A.H.M. Nanomechanical behavior of multi-walled carbon nanotubes particulate reinforced aluminum nanocomposites prepared by ball milling. Materials 2016, 9, 140. [CrossRef]
8. Jeon, Y.S.; Byun, J.Y.; Oh, T.S. Electrodeposition and mechanical properties of Ni-carbon nanotube nanocomposite coatings. J. Phys. Chem. Solids 2008, 69, 1391–1394. [CrossRef]
9. Suárez, S.; Soldera, F.; Oliver, C.G.; Acevedo, D.; Mucklich, F. Thermomechanical behavior of bulk Ni/MWNT composites produced via powder metallurgy. Adv. Eng. Mater. 2012, 14, 499–502. [CrossRef]
10. Kim, B.J.; Oh, S.Y.; Yun, H.S.; Ki, J.H.; Kim, C.J.; Baik, S.; Lim, B.S. Synthesis of Cu-CNT nanocomposite powder by ball milling. J. Nanosci. Nanotechnol. 2009, 9, 7393–7397. [CrossRef] [PubMed]
11. Bor, A.; Ichinkhorloo, B.; Uyanga, B.; Lee, J.; Choi, H. Cu/CNT nanocomposite fabrication with different raw material properties using a planetary ball milling process. Powder Technol. 2016. In Press. [CrossRef] 12. Li, S.; Sun, B.; Imai, H.; Mimoto, T.; Kondoh, K. Powder metallurgy titanium metal matrix composites
reinforced with carbon nanotubes and graphite. Compos. Part A 2013, 48, 57–66. [CrossRef]
13. Goh, C.S.; Wei, J.; Lee, L.C.; Gupta, M. Ductility improvement and fatigue studies in Mg-CNT nanocomposites. Compos. Sci. Technol. 2008, 68, 1432–1439. [CrossRef]
14. Han, G.Q.; Du, W.B.; Wang, Z.H.; Liu, K.; Li, S.B.; Du, X. Effective dispersion of CNTs to fabricate CNT/Mg nanocomposites. Mater. Sci. Forum 2015, 816, 470–475. [CrossRef]
15. Lei, X.; Natsuki, T.; Shi, J.; Ni, Q.Q. Analysis of carbon nanotubes on the mechanical properties at atomic scale. J. Nanomater. 2011, 2011, 805313. [CrossRef]
16. Demczyk, B.G.; Wang, Y.M.; Cumings, J.; Hetman, M.; Han, W.; Zettl, A.; Ritchie, R.O. Direct mechanical measurement of the tensile strength and elastic modulus of multiwalled carbon nanotubes. Mater. Sci. Eng. A Struct. 2002, 334, 173–178. [CrossRef]
17. Pérez-Bustamante, R.; Estrada-Guel, I.; Antúnez-Flores, L.; Miki-Yoshida, M.; Ferreira, P.J.; Martínez-Sánchez, R. Novel Al-matrix nanocomposites reinforced with multi-walled carbon nanotubes. J. Alloys Compd. 2008, 450, 323–326. [CrossRef]
18. Kuzumaki, T.; Miyazawa, K.; Ichinose, H.; Ito, K. Processing of carbon nanotube reinforced aluminum composite. J. Mater. Res. 1998, 13, 2445–2449. [CrossRef]
19. Xu, C.L.; Wei, B.Q.; Ma, R.Z.; Liang, J.; Ma, X.K.; Wu, D.H. Fabrication of aluminum–carbon nanotube composites and their electrical properties. Carbon 1999, 37, 855–858. [CrossRef]
Metals 2017, 7, 279 11 of 11
20. Deng, C.; Zhang, X.; Ma, Y.; Wang, D. Fabrication of aluminum matrix composite reinforced with carbon nanotubes. Rare Metals 2007, 26, 450–455. [CrossRef]
21. Kwon, H.; Leparoux, M. Hot extruded carbon nanotube reinforced aluminum matrix composite materials. Nanotechnology 2012, 23, 415701. [CrossRef] [PubMed]
22. Kwon, H.; Park Dae, H.; Silvain Jean, F.; Kawasak, A. Investigation of carbon nanotube reinforced aluminum matrix composite materials. Compos. Sci. Technol. 2010, 70, 546–550. [CrossRef]
23. Laha, T.; Chen, Y.; Lahiri, D.; Agarwal, A. Tensile properties of carbon nanotube reinforced aluminum nanocomposite fabricated by plasma spray forming. Compos. Part A 2009, 40, 589–594. [CrossRef]
24. Nguyen, J.; Holland, T.B.; Wen, H.; Fraga, M.; Mukherjee, A.; Lavernia, E. Mechanical behavior of ultrafine-grained Ni–carbon nanotube composite. J. Mater. Sci. 2014, 49, 2070–2077. [CrossRef]
25. Kim, S.K.; Oh, T.S. Electrodeposition behavior and characteristics of Ni-carbon nanotube composite coatings. Trans. Nonferr. Metal Soc. 2011, 21, s68–s72. [CrossRef]
26. Arai, S.; Saito, T.; Endo, M. Cu-MWCNT composite films fabricated by electrodeposition. J. Electrochem. Soc. 2010, 157, D147–D153. [CrossRef]
27. Smart, S.K.; Ren, W.C.; Cheng, H.M.; Lu, G.Q.; Martin, D.J. Shortened double-walled carbon nanotubes by high-energy ball milling. Int. J. Nanotechnol. 2007, 4, 618–633. [CrossRef]
28. Simões, S.; Viana, F.; Vieira, M.F. Carbon Nanotubes and their Nanocomposites. In Nanomaterials and Nanocomposites-Zero- to Three-Dimensional Materials and Their Composites; Wiley-VCH Verlag GmbH: Weinheim, Germany, 2016; pp. 75–101.
29. Simões, S.; Viana, F.; Reis, M.A.L.; Vieira, M.F. Improved dispersion of carbon nanotubes in aluminum composites. Compos. Struct. 2014, 108, 992–1000. [CrossRef]
30. Simões, S.; Viana, F.; Reis, M.A.L.; Vieira, M.F. Influence of dispersion/mixture time on mechanical properties of Al-CNTs nanocomposites. Compos. Struct. 2015, 126, 114–122. [CrossRef]
31. Simões, S.; Viana, F.; Reis, M.A.L.; Vieira, M.F. Microstructural characterization of aluminum-carbon nanotube nanocomposites produced using different dispersion methods. Microsc. Microanal. 2016, 22, 725–732. [CrossRef] [PubMed]
32. Chen, B.; Li, S.; Imai, H.; Jia, L.; Umeda, J.; Takahashi, M.; Kondoh, K. An approach for homogeneous carbon nanotube dispersion in Al matrix composites. Mater. Des. 2015, 72, 1–8. [CrossRef]
33. Chen, B.; Shen, J.; Ye, X.; Imai, H.; Umeda, J.; Takahashi, M.; Kondoh, K. Solid-state interfacial reaction and load transfer efficiency in carbon nanotubes (CNTs)-reinforced aluminum matrix composites. Carbon 2017, 114, 198–208. [CrossRef]
34. Suárez, S.; Lasserre, F.; Mucklich, F. Mechanical properties of MWNT/Ni bulk composites: Influence of the microstructural refinement on the hardness. Mater. Sci. Eng. A Struct. 2013, 587, 381–386. [CrossRef]
© 2017 by the authors. Licensee MDPI, Basel, Switzerland. This article is an open access article distributed under the terms and conditions of the Creative Commons Attribution (CC BY) license (http://creativecommons.org/licenses/by/4.0/).