DO:
D 10.1590/S1516-14392011005000084
*e-mail: [email protected]
Hydrolytic Degradation of a Resin Composite as a Function of the
Curing Tip Distance and Aging
Nádia da Rocha Svizeroa, Vanessa de Freitas Carvalhoa, Janaina Bechtoldb,
Roberta Caroline Bruschi Alonsoc, Maria Teresa Attad, Paulo Henrique Perlatti D’Alpinoc*
a
Hospital de Reabilitação de Anomalias Craniofaciais, University of São Paulo – USP,
São Paulo, SP, Brazil
b
Anhanguera-Uniban University, São Paulo, SP, Brazil
c
Biomaterials Research Group, Anhanguera-Uniban University, São Paulo, SP, Brazil
dDepartment of Operative Dentistry, Endodontics and Dental Materials,
Bauru School of Dentistry, University of São Paulo – USP, Bauru, SP, Brazil
Received: May 2, 2011; Revised: August 2, 2011
The inluence of curing tip distance and storage time on the hardness of a composite was evaluated. Composite samples (Filtek Z250) were polymerized at different distances (5, 10, and 15 mm), compared with a control group (0 mm), and stored in distilled water at 37 ° C for 24 hours. The Knoop-hardness of top and bottom surfaces was assessed (25 g/30 s). Specimens were stored in distilled water for 6 and 12 months and were retested. Hardness was found to be negatively inluenced by both curing tip distance and storage time. Despite similar values at 24 hours, differences in hardness values compared with the control group appeared over time. In comparing both surfaces, hardness proved to be greater at the top surface for all groups. Composites with similar initial hardness values can degrade very differently after water storage. The higher the photoactivation distance and storage time, the worse the mechanical property.
Keywords: knoop hardness, dental composite, aging
1. Introduction
A minimum light intensity has been reported to ensure an adequate polymerization of composites1. In contrast, no agreement has been reached regarding the ideal power density required to yield acceptable levels of polymerization and hardness in resin composites2. Such parameters as energy density, irradiance, light source, and exposure time are of particular interest as, in practice, they are under the clinician’s control3. Ideally, the light tip should
be kept as close as possible to the composite surface in order to avoid light dissipation. However, certain clinical situations present a challenge to the utilization of this recommended polymerization technique, such as the accessibility of the light source, the direction of the light, the preparation depth, and the surrounding tissues/ materials4. In these instances, a reduced monomer conversion may
occur. Resin conversion is an essential component to ensuring optimal mechanical properties that resist mechanical and chemical deterioration5, 6. Depending on the clinical scenario, the amount
of light that penetrates the bulk material can be attenuated or scattered; as a consequence, fewer molecules of camphorquinone are activated, reducing the extent of the reaction and also limiting the depth of the cure7. Underperforming the polymerization of a resin
composite adversely affects its physical properties8, 9, 10, reduces the bond strength9,10, increases the marginal wear8, increases bacterial colonization of the composite11, and decreases the biocompatibility by potentially increasing the DNA damage that results from monomer leaching11,12.
Clinical concerns have also been expressed about the depth of proximal boxes in Class II preparations, for which the distance
between the light guide and the material surface is generally quite considerable13. An incomplete curing of the restoration at the deepest
areas in that particular clinical situation may lead to the development of secondary caries and marginal failures14. Inappropriately
polymerized composites may also induce increased rates of water sorption and the releasing of various components15. Water molecules are known to serve as precursors to a variety of chemical and physical processes and to have deleterious effects on the structure and function of the resin matrix16. Composite hardness may be permanently altered
by these events17. In addition, it may also lead to advanced restoration
failure18. Clinically, it is impossible to evaluate the hardness at the lower surface but it is therefore claimed to be more relevant to composite longevity6. On the other hand, water may have a beneicial effect on resin composites, as water molecules are absorbed into the resin matrix, making the composite more lexible, resulting in an apparent increase in mechanical properties19.
This study evaluated the influence of different curing tip distances on the microhardness of a commercial BisEMA-based resin composite, known to contain camphorquinone as a photoinitiator. The results were compared to the values obtained when the curing tip was positioned as close as possible to the composite surface. The microhardness assessment was repeated after 6 and 12 months of storage in distilled water. The irst research hypothesis to be tested was that the hardness values for the top surface would be similar to the values of the control group (0 mm distance) when different curing tip distances are used to polymerize the composite. The second research hypothesis was that the values obtained for the bottom surface when using different curing tip distances would be equivalent to the values obtained for the control group. The third research hypothesis to be tested was that no difference in hardness would be found when values for the top surface are compared with those for the bottom surface, irrespective of the curing tip distances tested. Finally, a fourth hypothesis, namely that no difference would be found in microhardness values after 6 and 12 months of storage in distilled water, was tested.
2. Material and Methods
3M ESPE Filtek Z250 (St. Paul, MN, USA) resin composite was the restorative material tested (shade A3, lot # 8NW). Material was inserted into a Telon mold (2.5 mm thick, 6 mm in diameter) and photoactivated according to the manufacturer’s directions (20 seconds curing time). A pilot study was conducted in order to calibrate the operator and determine the sample size, as repeated indentations would be obtained after 6 and 12 months. The material was photoactivated, simulating the curing scenario in a 2.5-mm deep preparation, in which different curing tip distances (5, 10, and 15 mm) were used to polymerize the composite. The results were compared to the mean microhardness values obtained for the control group (0 mm). After insertion, a polyester strip was applied to the surface of the unpolymerized material, and a microscope slide was pressed against the composite surface in order to form the material into the shape of the inner portion of the mold. The same restorative material volume was obtained along lat top and bottom surfaces. The excess material was removed, and the specimens were then photoactivated at the top surface. A quartz-tungsten-halogen (QTH) curing light was used to polymerize the specimens (Ivoclar Vivadent Astralis 3, Liechtenstein). The spectral irradiant distribution of the light was measured using a laboratory-grade spectral radiometer (Spectrometer Ocean Optics, Inc., USB 2000, Dunedin, FL, USA). The area under the spectral proile was integrated from 350 to 600 nm in order to determine the total power emitted. The power was then divided by the cross sectional area of the iberoptic tip (cm2). Light intensity was monitored throughout the experiment in order to ensure that a consistent intensity was maintained.
Cylindrical specimens were divided into 4 groups, with ive specimens in each group, according to the different curing tip distances used. After photoactivation, the specimens were removed from the molds and the top surface was identiied with an indelible mark. A single operator prepared the specimens. The specimens were then stored in lightproof recipients for 24 hours. After this period, a microhardness test was performed into a digital Knoop hardness-measuring instrument under load (Shimadzu HMV-M Microhardness Tester; Newage Testing Instruments, Inc., Southampton, PA, USA). Ten randomized indentations (5 on both the top and bottom surfaces) were made with a 25 g load for 30 seconds with a dwell time of 15 seconds. For randomization purposes, specimens were arbitrarily rotated prior to indentations being made. The microhardness assessment was repeated after 6 and 12 months of storage in distilled water.
2.1. Statistical analysis
Statistical analysis was conducted using a three-way ANOVA and Tukey’s post hoc test for pair-wise comparisons. All statistical testing was performed at a preset alpha of 0.05. A normal distribution of data was conirmed by the Komogorov–Smirnov test and the Shapiro-Wilk test. Three-way ANOVA was performed in order to evaluate the inluence of the three variables tested: light-curing tip distance (0, 5, 10, and 15 mm), evaluation time (24 hours, 6 months, and 12 months), and surfaces (top and bottom).
3. Results
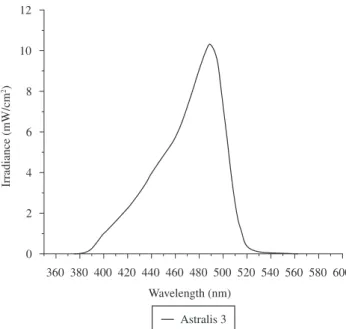
The spectral emission proile of light unit used in this study is presented in Figure 1. The QTH light generated a relatively wide spectral emission proile, and a moderate power density level (600 mW.cm–2).
A pronounced peak was observed at 490 nm, demonstrating the effectiveness of the ilter required to restrict the emitted light to the blue region of the spectrum, in which the photoinitiator camphorquinone characteristically absorbs energy (425 to 490 nm, with a peak at approximately 465 nm)2. The power density and energy dose assessed were as follows: at 0 mm, 600 mW.cm–2 (12 J.cm–2); at 5 mm,
320 mW.cm–2 (6.4 J.cm–2); at 10 mm, 150 mW.cm–2 (3 J.cm–2); and at
15 mm, 100 mW.cm–2 (2 J.cm–2).
Figures 2 and 3 display the microhardness mean values of the top and bottom surfaces according to evaluation times. After 24 hours, at the top surface, the highest microhardness mean values were observed in the 0-, 5-, and 10-mm groups (75.9 ± 2.9; 76.5 ± 2.2; and 77.5 ± 2.5, respectively). The 15-mm group demonstrated the lowest mean value (70.5 ± 2.8). Statistical analysis indicated a statistically signiicant difference (p < 0.05) when the hardness mean values for the 15-mm group were compared with those obtained for the control group (0 mm). After 6 and 12 months, all of the groups demonstrated reduced hardness values. At these evaluation times, the highest values were observed for the control group at the top surface (71.0 ± 0.7 and 67.6 ± 1.3, respectively). In both cases, a statistically signiicant difference was found when the mean values obtained for the control group were compared to the values for the 10-mm group (65.2 ± 2.4 and 58.9 ± 3.3 for 6 and 12 months, respectively) and the 15-mm group (55.1 ± 1.0 and 53.1 ± 0.7 for 6 and 12 months, respectively).
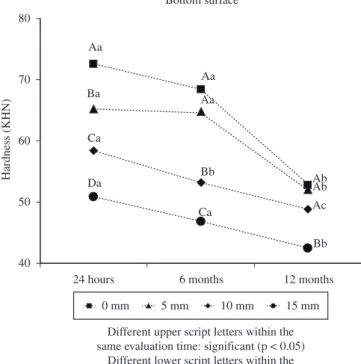
when the mean values were compared with the hardness values for the 10-mm group and the 15-mm group (p < 0.05). After 12 months, the microhardness mean values of the 0-mm group also decreased (after 6 months, from 72.6 to 68.4; and after 12 months, to 52.8), and a statistically signiicant difference was only observed when the values for the control group were compared with the hardness values for the 15-mm group (p < 0.05).
When the hardness values at different evaluation times were compared (using 24 hours as the control), signiicantly lower hardness mean values were observed for the top surface after 6 and 12 months (Figure 2), irrespective of the experimental groups tested (p < 0.05). For the bottom surface (Figure 3), statistically equivalent mean values were only observed after 6 months for 0- and 5-mm groups, as opposed to the values obtained at 24 hours (p > 0.05).
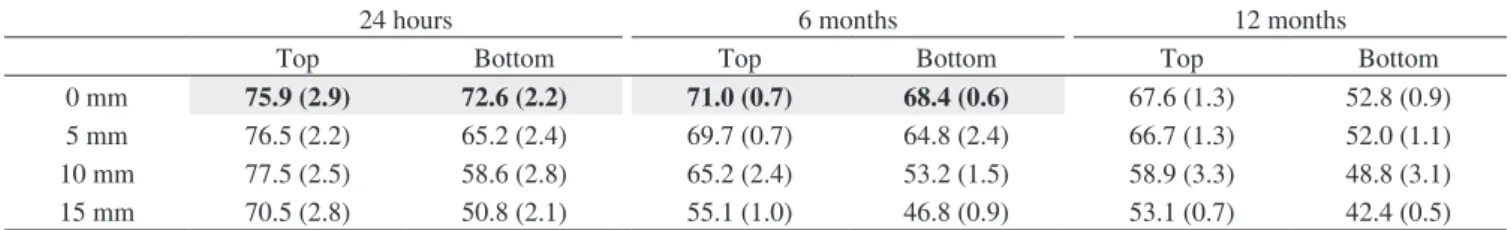
Table 1 presents the top-to-bottom variation in the microhardness mean values for each material/curing unit combination. Statistically signiicant top-to-bottom differences were observed for all of the groups, aside from the 0-mm group at 24 hours and 6 months (p > 0.05). Statistical analysis also demonstrated that the interaction tip distance x evaluation time x surface signiicantly inluenced the microhardness values (p = 0.0001).
4. Discussion
The irst and second hypotheses, namely that the microhardness values observed for both the top and bottom surfaces when different curing tip distances are used to polymerize a commercial resin composite would be similar to the values observed for the control group (0 mm), were not validated.For the top surface, after 24 hours, signiicantly lower hardness values were observed when the curing tip was positioned 15 mm from the composite surface (70.5 ± 2.8), compared with the values observed for the control group (75.9 ± 2.9). After 6 months, the mean hardness values decreased for all of the groups; signiicantly lower values were observed for the 10- and 15-mm groups (65.2 ± 2.4 and 55.1 ± 1.0, respectively) than for the 0-mm group (71.0 ± 0.7). The values obtained after 12 months were even lower for all of the groups, but a statistically signiicant difference between the 10- and 15-mm groups and the control group remained. For the bottom surface, after 24 hours, the hardness mean values were lower, the farther away the curing tip was positioned. Statistical analysis demonstrated a statistically signiicant difference when the values for all of the experimental groups were compared with the values the 0-mm group. After 6 months, the hardness values were statistically equivalent to the values observed at the 24 hours evaluation time (with the exception of the 10-mm group); however, after 12 months, all of the values were signiicantly lower than the 24 hours hardness values.
Hardness values decreased for both surfaces as the curing tip was positioned farther away from the composite. The difference in hardness values among these groups appeared over time. As the 0-, 5- and 10-mm groups exhibited similar hardness mean values at 24 hours, equivalent behavior with respect to this particular mechanical property tested after 6 and 12 months among these groups might be expected. However, the reductions in hardness values in the 5- and 10-mm groups after 6 and 12 months were greater than those in the control group. The present study indicates that, although hardness tests have been used to evaluate the physical properties of composite dental materials and to predict the clinical performance22, the initial mean values do not discriminate between polymers of different extents of crosslinking. Although the physical and mechanical properties of resin composites are also strongly inluenced by the degree of conversion23, increased crosslink density has also been associated
with increased physical properties and stability24. The degree of
For the bottom surface, the 0-mm group demonstrated the highest hardness mean value (72.6 ± 2.2), while the 15-mm group displayed the lowest hardness mean value (50.8 ± 2.1) after 24 hours. The hardness of the control group proved to be signiicantly higher (p < 0.05) when compared with all of the tip distances tested. On the other hand, as the hardness values for the 0-mm group decreased after 6 months, a statistically signiicant difference was determined Figure 2. Results and statistical analysis for the top surface.
Table 1. Top-to-bottom variation in the microhardness mean values (mean ± sd).
24 hours 6 months 12 months
Top Bottom Top Bottom Top Bottom
0 mm 75.9 (2.9) 72.6 (2.2) 71.0 (0.7) 68.4 (0.6) 67.6 (1.3) 52.8 (0.9)
5 mm 76.5 (2.2) 65.2 (2.4) 69.7 (0.7) 64.8 (2.4) 66.7 (1.3) 52.0 (1.1)
10 mm 77.5 (2.5) 58.6 (2.8) 65.2 (2.4) 53.2 (1.5) 58.9 (3.3) 48.8 (3.1)
15 mm 70.5 (2.8) 50.8 (2.1) 55.1 (1.0) 46.8 (0.9) 53.1 (0.7) 42.4 (0.5)
Highlighted cells: top-to-bottom variation: no signiicant (p > 0.05).
conversion is well correlated with the quantity of double bonds remaining in the polymer, a factor of considerable importance, as it inluences the mechanical properties of a given composite25. However, the extent of crosslinking of the matrix appears to be more important in predicting composite hardness behavior over time. Care must be taken when considering hardness to be indicative of the degree of conversion, as in some cases, samples with similar conversions can have different cross-linking densities, which, in turn, can affect hardness26. Conversion is an average measure and fails to take into
account the fact that a material with non-uniform conversion may demonstrate the same quantity of remaining double bonds as a more homogeneously polymerized material27. In addition, polymers
differing in linearity and therefore having different crosslink densities may possess similar conversion values28.
An initial microhardness test was performed after 24 hours, as the increase in post irradiation hardness is rapid over the irst hour slowing to achieving a maximum value within 24 hours29. It has been demonstrated that at early stages of polymerization, pendant carbon double bonds are preferentially consumed in so-called primary cyclization reactions, and high degrees of conversion are reached, substantially increasing crosslinking30. In these reactions, microgels
are created, resulting in a heterogeneous polymer network in which crosslinked areas and more highly crosslinked microgel regions coexist27. Thereafter, a secondary cycle occurs, and radicals react
with pendant double bonds on different kinetic chains with which they are already crosslinked27.
The third hypothesis, which states that there is no difference in microhardness when the hardness values for the top surface are compared with values observed for the bottom surface, was also rejected. The polymerization process explains the results obtained for the top and bottom surfaces. The resin composite at the surface receives the full power density with minimal light attenuation during irradiation. At the irradiated surface the polymerization process proceeds very quickly because virtually all of the photoinitiator is activated31. However, deeper in the resin-based photoactivated
material, light attenuation and scattering cause a decrease in conversion, as fewer molecules of camphorquinone are activated due to the absorption and scattering of the light, leading to a considerable reduction in the extent of the reaction32. The rate of polymerization is
thus reduced, compared with the rate at the surface33. Depending on
the number of photons, less light will be able to penetrate to deeper depths of the restorative material, thereby decreasing the probability of raising a large number of photoabsorbing molecules to an excited state, thus decreasing the total conversion32.
The results of the present study indicated a sensitivity to curing tip distance. Comparing the hardness values of both surfaces, only the 0-mm group exhibited a signiicantly equivalence between the surfaces, with equivalent values remaining after 6 months of storage in distilled water (Table 1). Thus, the fourth research hypothesis was not accepted. Lower light intensity at different distances possibly activates a smaller quantity of initiators, generating a greater number
of unreacted monomers and a less crosslinked polymer with linear characteristics.
In an aqueous environment, composites absorb water and not only elute unreacted monomers34, but elements from iller particles and
polymerization promoters35 as well. These uncured monomers may
be leached at a higher rate in the mouth due to the greater solubility36
of these monomers in saliva, compared with the rate observed when they are exposed to water molecules. Depending on the material, a larger number of air voids can form during the polymerization of resin composites due to shrinkage37. Clinically, the release of the
composite components inluences the initial dimensional change of the composite as well as the clinical performance and the long-term esthetic of the restorations34. The water is primarily absorbed by the
resin matrix38. The sorption of water is described by a dual-mode
theory, which assumes that dissolution may occur in the polymer matrix and/or entrapment as a result of clustering water molecules39
in polymer voids by breaking down the chemical bonds in the resin or softening through the plasticizing action of water40. In light of the
fact the iller particles do not absorb a signiicant amount of water, the most probable site at which additional water is accommodated is in the interface between the inorganic iller particle and the polymer matrix39. The indings of Toledano et al.37 suggest that the matrix
and the iller particles are not always effectively coupled. In general, water sorption is a diffusion-controlled process37, and the diffusion
coeficient of water in resin composites tends to increase, followed by an equilibrium in water sorption values34.
New formulations of monomers were developed by modifying the chemical structure of certain monomers and/or replacing them. The structure of BisEMA is nearly identical to that of BisGMA, aside from the absence of hydroxyl groups5. Replacing BisGMA with BisEMA in composites containing TEGDMA resulted in a higher conversion but no improvement in lexural and diametral tensile strengths41.
Another study5 also demonstrated that mixtures of BisGMA and TEGDMA present an increased crosslink density and a higher degree of conversion than what is observed for mixtures of BisGMA and BisEMA. The lower molecular weight of TEGDMA and the synergic effect with BisGMA have been explained to inluence the kinetic parameters contributing to a higher conversion. Furthermore, an internal plasticizing effect has been attributed to BisEMA as a result of its high molecular weight, which reduces the crosslink density of the polymer42. Findings of the present study demonstrate that an
extreme curing tip distance results in signiicantly higher softening than for the control group. The authors of previous studies testing different curing tip distances speculate that the higher softening may be associated with relatively few centers of polymer growth that favor the formation of a relatively linear polymer structure33. Crosslinked
dimethacrylate networks swell when exposed to solvents that penetrate the resin matrix and expand the openings among chains43.
This study also demonstrates that, in spite of similar initial hardness values, the composite can degrade very differently after water storage. It also agreed with previous indings, indicating that signiicant reductions in the mechanical properties of composites occur only after 7 days of solvent immersion44. While the ideal
curing tip position appears to be as close to the material as possible45
this position is not possible in all situations. Certain cavity designs and restorative procedures do not allow polymerization within this distance. In these cases, the tip of the appliance cannot be positioned close to the resin composite during polymerization due to such factors as cuspal tips, proximal restorations, or the position of the tooth in the arch. Deeper in these cavities, the restoration must be built up in increments. Each increment should not exceed 2.0-2.5 mm and must be properly cured prior to insertion of the next increment13. Although
limitations exist, the mechanical properties can be maintained while the cavity is illed and cured.
5. Conclusions
It can be concluded that, within the conditions of this study, different curing tip distances used to polymerize a BisEMA-based composite inluence the microhardness. The synergic effect between curing tip distance and water storage was also determined to negatively affect the composite hardness. Also proven was the fact that despite similar initial hardness values, the composite can degrade very differently during water storage. The best compromise between hardness and curing tip distance was observed when the tip was placed close to the composite.
References
1. Felix CA and Price RB. The effect of distance from light source on light intensity from curing lights. Journal of Adhesive Dentistry.2003; 5(4):283-91. PMid:15008335.
2. D’Alpino PH, Svizero NR, Pereira JC, Rueggeberg FA, Carvalho RM and Pashley DH. Inluence of light-curing sources on polymerization reaction kinetics of a restorative system. American Journal of Dentistry. 2007; 20(1):46-52. PMid:17380808.
3. Halvorson RH, Erickson RL and Davidson CL. Energy dependent polymerization of resin-based composite. Dental Materials.2002; 18(6):463-9. http://dx.doi.org/10.1016/S0109-5641(01)00069-0 4. Emami N, Soderholm KJ and Berglund LA. Effect of light power density
variations on bulk curing properties of dental composites. Journal of Dentistry.2003; 31(3):189-96. http://dx.doi.org/10.1016/S0300-5712(03)00015-0
5. Goncalves F, Kawano Y, Pfeifer C, Stansbury JW and Braga RR. Inluence of bisgma, tegdma, and bisema contents on viscosity, conversion, and lexural strength of experimental resins and composites. European Journal of Oral Sciences.2009; 117(4):442-6. PMid:19627357. http://dx.doi. org/10.1111/j.1600-0722.2009.00636.x
6. Quance SC, Shortall AC, Harrington E and Lumley PJ. Effect of exposure intensity and post-cure temperature storage on hardness of contemporary photo-activated composites. Journal of Dentistry.2001; 29(8):553-60. http://dx.doi.org/10.1016/S0300-5712(01)00045-8
7. Rueggeberg F. Contemporary issues in photocuring. Compendium of Continuim Education in Dentistry.1999; 25:S4-S15.
8. Ferracane JL, Mitchem JC, Condon JR and Todd R. Wear and marginal breakdown of composites with various degrees of cure. Journal of Dental Research.1997; 76(8):1508-16. PMid:9240388. http://dx.doi.org/10.11 77/00220345970760081401
9. Xu X, Sandras DA and Burgess JO. Shear bond strength with increasing light-guide distance from dentin. Journal of Esthetic and Restorative Dentistry.2006; 18(1):19-27; discussion 28. PMid:16426505. http:// dx.doi.org/10.2310/6130.2006.00007
10. Staudt CB, Krejci I and Mavropoulos A. Bracket bond strength dependence on light power density. Journal of Dentistry.2006; 34(7):498-502. PMid:16386827. http://dx.doi.org/10.1016/j.jdent.2005.11.006 11. Brambilla E, Gagliani M, Ionescu A, Fadini L and Garcia-Godoy F.
The inluence of light-curing time on the bacterial colonization of resin composite surfaces. Dental Materials.2009; 25(9):1067-72. PMid:19375790. http://dx.doi.org/10.1016/j.dental.2009.02.012 12. Knezevic A, Zeljezic D, Kopjar N and Tarle Z. Cytotoxicity of
composite materials polymerized with led curing units. Oper Dent.2008; 33(1):23-30. PMid:18335729. http://dx.doi.org/10.2341/07-16 13. Cenci M, Demarco F and de Carvalho R. Class ii composite resin
restorations with two polymerization techniques: Relationship between microtensile bond strength and marginal leakage. Journal of Dentistry. 2005; 33(7):603-10. PMid:16005800. http://dx.doi.org/10.1016/j. jdent.2005.01.001
14. Neme AM, Maxson BB, Pink FE and Aksu MN. Microleakage of class ii packable resin composites lined with lowables: An in vitro study. Operative Dentistry.2002; 27(6):600-5. PMid:12413226.
15. Pearson GJ and Longman CM. Water sorption and solubility of resin-based materials following inadequate polymerization by a visible-light curing system. Journal of Oral Rehabilitation.1989; 16(1):57-61. PMid:2526208. http://dx.doi.org/10.1111/j.1365-2842.1989.tb01317.x 16. Ferracane JL. Hygroscopic and hydrolytic effects in dental polymer
networks. Dental Materials.2006; 22(3):211-22. PMid:16087225. http:// dx.doi.org/10.1016/j.dental.2005.05.005
17. Moon HJ, Lee YK, Lim BS and Kim CW. Effects of various light curing methods on the leachability of uncured substances and hardness of a composite resin. Journal of Oral Rehabilitation.2004; 31(3):258-64. PMid:15025659. http://dx.doi.org/10.1111/j.1365-2842.2004.01172.x 18. Fan PL, Wozniak WT, Reyes WD and Stanford JW. Irradiance of visible
light-curing units and voltage variation effects. Journal of American Dental Association.1987; 115(3):442-5. PMid:3476666.
19. Drummond JL. Degradation, fatigue, and failure of resin dental composite materials. Journal of Dental Research.2008; 87(8):710-9. PMid:18650540. PMCid:2561305. http://dx.doi.org/10.1177/154405910808700802 20. Kerby RE, Knobloch LA, Schricker S and Gregg B. Synthesis and
evaluation of modiied urethane dimethacrylate resins with reduced water sorption and solubility. Dental Materials.2009; 25(3):302-13. PMid:18799211. http://dx.doi.org/10.1016/j.dental.2008.07.009 21. Shobha HK, Sankarapandian M, Kalachandra S, Taylor DF and McGrath
JE. Structure property relationship among novel dental composite matrix resins. Journal of Materials Science: Materials in Medicine.1997; 8(6):385-9. PMid:15348741. http://dx.doi.org/10.1023/A:1018541102275 22. Yoldas O, Akova T and Uysal H. Inluence of different indentation load
and dwell time on knoop microhardness tests for composite materials. Polymer Testing.2004; 23:343-46.
23. Ferracane JL. Correlation between hardness and degree of conversion during the setting reaction of unfilled dental restorative resins. Dental Materials.1985; 1(1):11-4. http://dx.doi.org/10.1016/S0109-5641(85)80058-0
24. Asmussen E and Peutzfeldt A. Inluence of selected components on crosslink density in polymer structures. European Journal of Oral Sciences.2001; 109(4):282-5. PMid:11531075. http://dx.doi.org/10.1034/ j.1600-0722.2001.00057.x
25. Munksgaard EC, Peutzfeldt A and Asmussen E. Elution of tegdma and bisgma from a resin and a resin composite cured with halogen or plasma light. European Journal of Oral Sciences.2000; 108(4):341-5. PMid:10946770. http://dx.doi.org/10.1034/j.1600-0722.2000.108004341.x
26. Obici AC, Sinhoreti MA, Frollini E, Correr-Sobrinho L and Consani S. Degree of conversion and knoop hardness of z250 composite using different photo-activation methods. Polymer Testing.2005; 24(814-18. 27. Soh MS and Yap AU. Inluence of curing modes on crosslink density
28. Asmussen E and Peutzfeldt A. Influence of pulse-delay curing on softening of polymer structures. Journal of Dental Research.2001; 80(6):1570-3. PMid:11499515. http://dx.doi.org/10.1177/0022034501 0800061801
29. Pilo R and Cardash HS. Post-irradiation polymerization of different anterior and posterior visible light-activated resin composites. Dental Materials.1992; 8(5):299-304. http://dx.doi.org/10.1016/0109-5641(92)90104-K
30. Watts DC and Cash AJ. Determination of polymerization shrinkage kinetics in visible-light-cured materials: Methods development. Dental Materials.1991; 7(4):281-7. http://dx.doi.org/10.1016/S0109-5641(05)80030-2
31. Stansbury JW, Trujillo-Lemon M, Lu H, Ding X, Lin Y and Ge J. Conversion-dependent shrinkage stress and strain in dental resins and composites. Dental Materials.2005; 21(1):56-67. PMid:15681003. http:// dx.doi.org/10.1016/j.dental.2004.10.006
32. Silikas N, Eliades G and Watts DC. Light intensity effects on resin-composite degree of conversion and shrinkage strain. Dental Materials. 2000; 16(4):292-6. http://dx.doi.org/10.1016/S0109-5641(00)00020-8 33. Asmussen E and Peutzfeldt A. Polymer structure of a light-cured resin
composite in relation to distance from the surface. European Journal of Oral Sciences.2003; 111(3):277-9. PMid:12786961. http://dx.doi. org/10.1034/j.1600-0722.2003.00044.x
34. Sideridou I, Achilias DS, Spyroudi C and Karabela M. Water sorption characteristics of light-cured dental resins and composites based on bis-ema/pcdma. Biomaterials.2004; 25(2):367-76. http://dx.doi.org/10.1016/ S0142-9612(03)00529-5
35. Ferracane JL. Elution of leachable components from composites. Journal of Oral Rehabilitation.1994; 21(4):441-52. PMid:7965355. http://dx.doi. org/10.1111/j.1365-2842.1994.tb01158.x
36. Larsen IB and Munksgaard EC. Effect of human saliva on surface degradation of composite resins. Scandinavian Journal of Dental Research.1991; 99(3):254-61. PMid:1831287.
37. Toledano M, Osorio R, Osorio E, Fuentes V, Prati C and Garcia-Godoy F. Sorption and solubility of resin-based restorative dental materials.
Journal of Dentistry.2003; 31(1):43-50. http://dx.doi.org/10.1016/ S0300-5712(02)00083-0
38. Braden M and Clarke RL. Water absorption characteristics of dental microfine composite filling materials. I. Proprietary materials. Biomaterials.1984; 5(6):369-72. http://dx.doi.org/10.1016/0142-9612(84)90038-3
39. Kalachandra S and Turner DT. Water sorption of polymethacrylate networks: Bis-gma/tegdm copolymers. Journal of Biomedical Materials Research.1987; 21(3):329-38. PMid:2951387. http://dx.doi.org/10.1002/ jbm.820210306
40. Mohsen NM and Craig RG. Hydrolytic stability of silanated zirconia-silica-urethane dimethacrylate composites. Journal of Oral Rehabilitation.1995; 22(3):213-20. PMid:7769516. http://dx.doi. org/10.1111/j.1365-2842.1995.tb01566.x
41. Stansbury JW. Synthesis and evaluation of new oxaspiro monomers for double ring-opening polymerization. Journal of Dental Research.1992; 71(7):1408-12. PMid:1629456. http://dx.doi.org/10.1177/00220345920 710070901
42. Sideridou I, Tserki V and Papanastasiou G. Study of water sorption, solubility and modulus of elasticity of light-cured dimethacrylate-based dental resins. Biomaterials.2003; 24(4):655-65. http://dx.doi. org/10.1016/S0142-9612(02)00380-0
43. Peutzfeldt A. Resin composites in dentistry: The monomer systems. European Journal of Oral Science.1997; 105(2):97-116. PMid:9151062. http://dx.doi.org/10.1111/j.1600-0722.1997.tb00188.x
44. Lin CT, Lee SY, Keh ES, Dong DR, Huang HM and Shih YH. Inluence of silanization and iller fraction on aged dental composites. Journal of Oral Rehabilitation.2000; 27(11):919-26. PMid:11106982. http://dx.doi. org/10.1046/j.1365-2842.2000.00573.x