http://www.scirp.org/journal/tel
ISSN Online: 2162-2086 ISSN Print: 2162-2078
DOI: 10.4236/tel.2018.85075 Apr. 19, 2018 1083 Theoretical Economics Letters
A Matrix Approach to the Socioeconomic
Activity of a Country
Susana Santos
UECE (Research Unit on Complexity and Economics) and DE (Department of Economics), ISEG—Lisbon School of Economics and Management, Universidade de Lisboa, Lisboa, Portugal
Abstract
A Social Accounting Matrix (SAM) is presented as a tool to study the socio-economic activity of a country. This activity involves the monetary or nominal flows that are measured by the National Accounts, as well as production (or-ganized in factors, industries and goods and services) and institutions (organ-ized in households, general government, non-financial and financial corpora-tions, non-profit institutions serving households, and rest of the world). In order to contribute to the definition of a methodology that can improve the knowledge of the different aspects of this activity, the potentialities of a SAM for its reading and interpreting are explored, as well as for carrying out ex-periments regarding its functioning. Through a SAM-based approach, how to construct more or less complex networks of linkages of the above mentioned flows is shown, from which structural features can be evidenced and the asso-ciated multiplier effects studied. Following an application to Portugal, it is shown that a numerical version of a SAM, enables an empirical description of the origin, use, and distribution of income, whereas, an algebraic version of a SAM allows one to carry out, for example, a deeper study of the multiplier ef-fects associated with the institutional distribution of income. The crucial role of the factors of production accounts is identified in this study, namely when they establish the link between the generation and the distribution and use of income. In this process, the important role the complementary details that the Input-Output Matrix (IOM) can add is also identified. Thus, being the gen-eration of income, the result of the output of goods and services and the asso-ciated costs, on the one hand, an industry by industry IOM can add details regarding domestic and imported intermediate consumption by and between industries and, on the other hand, a product by product IOM can add details regarding the domestic and imported intermediate consumption of goods and services.
How to cite this paper: Santos, S. (2018) A Matrix Approach to the Socioeconomic Activity of a Country. Theoretical Econom-ics Letters, 8, 1083-1135.
https://doi.org/10.4236/tel.2018.85075 Received: October 23, 2017 Accepted: April 16, 2018 Published: April 19, 2018 Copyright © 2018 by author and Scientific Research Publishing Inc. This work is licensed under the Creative Commons Attribution International License (CC BY 4.0).
http://creativecommons.org/licenses/by/4.0/
DOI: 10.4236/tel.2018.85075 1084 Theoretical Economics Letters
Keywords
Social Accounting Matrix, Input-Output Matrix, National Accounts, Socioeconomic Structure, Income Distribution, Multiplier Effects
1. Introduction
1The activity of a country that involves monetary or nominal flows is complex and its knowledge depends on the use of tools, or working instruments. In this article, this activity, which involves production and institutions, will be desig-nated as “socioeconomic activity”, these flows will be all the measured by the National Accounts, and a Social Accounting Matrix (SAM) will be the working instrument, or tool. The research on the potentialities of this tool will be ori-ented in such a way as to show that it enables the reading and interpretation, the multiple aspects of the reality under study, as well as carry out experiments with its functioning.
The option of working with the National Accounts has behind a research purpose of defining a methodology that could be adopted by as many users as possible, and which could contribute to improving the knowledge about differ-ent aspects of the so-called socioeconomic activity of a country. This resulted from the perception that the National Accounts, on one hand, are aligned to a system that has progressively been adjusted with the aim of being improved, which conveys some confidence, mainly regarding alternative sources of infor-mation. On the other hand, the National Accounts have been produced in a more or less complete and adapted way, by almost every country in the world. Thus, since its disclosure is regular, (at least partially) free, and credible, its adoption becomes accessible to a greater number of users and uses.
Therefore, the adoption of National Accounts as a base source of information of the SAM could contribute to producing better studies in different areas, as well as useful results for the process of policy evaluation and decision making.
This explains why the rules and the nomenclatures of the latest version of the SNA [1] will underlie the methodology proposed for a work at a macroeconomic level of analysis. As done previously, I will present this methodology in this arti-cle always from a progressively better systematized perspective. This methodol-ogy is my own version, and is a result of a research based on the studies of R. Stone, G. Pyatt, and J. Round2, which started with Santos [9].
A SAM-based approach will be adopted, according to which empirical and theoretical descriptions of the activity of a country are possible with, respec-tively, numerical and algebraic versions of the SAM. Each cell of a SAM will be a number if it is in a numerical version, and will be an equation or system of equa-1This article is a version of the Munich Personal RePEc Archive Paper No. 79742.
2Among the works of those authors I would like to highlight the following: Pyatt [2] [3] [4]; Pyatt and Round [5]; Stone [6] [7] [8].
DOI: 10.4236/tel.2018.85075 1085 Theoretical Economics Letters
tions, if it is in an algebraic version, or a SAM-based model. The SAM will, therefore, enable simultaneous research on the empirical and theoretical evi-dence of the activity of a country, which in this case is provided by the National Accounts.
As will be seen in Chapter 2, the SAM is a square matrix, in which the sum of the rows is equal to the corresponding sum of the columns. These rows and columns represent, respectively, the inflows and outflows of accounts in which production and institutions are worked together at a level of detail that depends on the corresponding disaggregation, extension, and complements [namely, the Input-Output Matrix (IOM)]. Thus, more or less complex networks of linkages of flows with different intensities can be constructed for specific periods and geographical areas, as will be seen in Chapter 3. Structural features of the under-lying activity of that network of linkages can be evidenced, and the associated multiplier effects can be studied, as will be seen in Chapters 4 and 5, respectively. Chapters 2 and 3 will show that with the SAM, the value of production and the associated costs as well as the demand and supply of goods and services can be worked together with various types of income, namely, generated, disposable, and accumulated income. This work, which involves production and institutions and a matrix format when based in a numerical version of a SAM, enables an empirical description of the origin, use, and distribution of this income, as will be shown in Chapter 4. In Chapter 5, an algebraic version will be used to illus-trate a possible deeper study of the institutional distribution of income, using some of the potentialities of the SAM.
A summary and some concluding remarks are presented in Chapter 6, which will systematize how a matrix form and a specific organisation of the National Accounts, materialized in a SAM, can evidence and provide conditions for re-search on the structural features of the socioeconomic activity of a country.
2. A SAM Base Form
In a SAM, the monetary or nominal flows between production and institutions, occurring in a particular geographical space, in a given time period are repre-sented and can be studied.
The SAM is a square matrix, in which the sum of the rows is equal to the cor-responding sum of the columns. The entries in rows represent resources, in-comes, receipts or changes in liabilities, and net worth. In the columns the en-tries are outlays, expenditures or changes in assets.
The way how the accounts (rows and columns) are organized and the corre-sponding details included depends on the purposes of the study for which it will be used and on the available information.
2.1. Schematic Representation
Using a top-down methodology, I will first present a SAM base form, associated to a zero level of disaggregation, which is a summary of the flows measured by
DOI: 10.4236/tel.2018.85075 1086 Theoretical Economics Letters
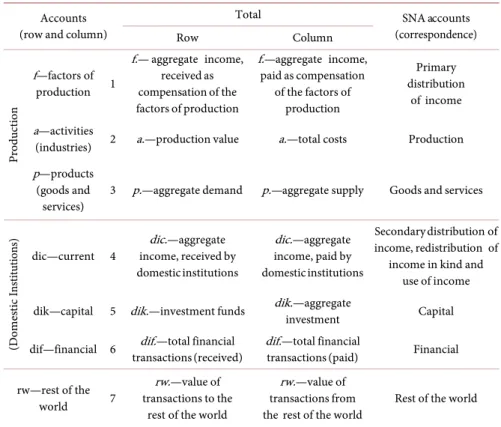
the National Accounts. Table 1 shows that form, with seven rows and columns (1 to 7), each of which represent the main SAM accounts—described by the cor-responding initials, and the cells represent the above mentioned monetary or nominal flows (also mentioned as transactions) “T”. The location of “T” is de-scribed by two initials between brackets, the first of which represents the row account, whilst the second represents the column account. Table 2 identifies and describes these accounts and the corresponding totals, and Table 3 identifies and describes these flows and the corresponding codes in the latest version of the SNA [1].
Table 1. A SAM base form (level of disaggregation 0).
f a p dic dik dif rw
total
1 2 3 4 5 6 7
f 1 T(f,a) T(f,rw) f.
a 2 T(a,p) a.
p 3 T(p,a) T(p,p) T(p,dic) T(p,dik) T(p,rw) p. dic 4 T(dic,f) T(dic,a) T(dic,p) T(dic,dic) T(dic,rw) dic.
dik 5 T(dik,dic) T(dik,dik) T(dik,rw) dik.
dif 6 T(dif,dik) T(dif,dif) T(dif,rw) dif.
rw 7 T(rw,f) T(rw,a) T(rw,p) T(rw,dic) T(rw,dik) T(rw,dif) rw.
total .f .a .p .dic .dik .dif .rw
Source: Own construction, based on Santos [10] and [11].
Table 2. A SAM base form (level of disaggregation 0)—accounts and totals description.
Accounts (row and column)
Total SNA accounts
(correspondence) Row Column Pr od uc tio n f—factors of production 1 f.— aggregate income, received as compensation of the factors of production f.—aggregate income, paid as compensation of the factors of production Primary distribution of income a—activities
(industries) 2 a.—production value a.—total costs Production p—products
(goods and
services) 3 p.—aggregate demand p.—aggregate supply Goods and services
(Do me sti c I ns tit ut io ns ) dic—current 4 dic.—aggregate income, received by domestic institutions dic.—aggregate income, paid by domestic institutions Secondary distribution of income, redistribution of
income in kind and use of income dik—capital 5 dik.—investment funds dik.—aggregate investment Capital dif—financial 6 transactions (received) dif.—total financial dif.—total financial transactions (paid) Financial rw—rest of the
world 7
rw.—value of transactions to the
rest of the world
rw.—value of transactions from
the rest of the world Rest of the world
DOI: 10.4236/tel.2018.85075 1087 Theoretical Economics Letters Table 3. A SAM base form (level of disaggregation 0)—flows description.
Transactions
(cells) Description SNA Code
T(f,a) Compensation of factors of production3
consists of the income of the institutional sectors originating from the compensation of employees and the compensation of employers and own account (or self-employed)
workers, as well as the compensation of capital, including property income
D1 D4 B2g B3g T(f,rw)
T(dic,f) T(rw,f)
T(a,p) Production (basic prices) represents the output of goods and services P1 T(p,a)
Intermediate consumption (purchasers’ prices)
consists of the value of the goods and services consumed as inputs of the process of production, excluding those fixed assets whose
consumption is recorded as consumption of fixed capital
P2
T(p,p) amount to zero and, when it is disaggregated and takes the form of a submatrix, it allocates Trade and transport margins the output of the trade and transport services used in the domestic trade to the supplied products T(p,dic) consists of the expenditure incurred by resident institutional units on goods or services which are used for Final consumption (purchasers’ prices)
the direct satisfaction of individual needs or wants, or the collective needs of members of the community P3 T(p,dik) includes gross fixed capital formation, changes in inventories, and acquisitions less disposals of valuables Gross capital formation (purchasers’ prices) P5 T(p,rw) include the transactions in goods and services from residents to non-residents Exports (purchasers’ prices) P6 (part of) T(rw,p) include the transactions in goods and services from non-residents to residents Imports (purchasers’ prices) P7
T(dic,p) Net taxes on products
represent the taxes on products minus the subsidies on products D21-D31 (part of) T(rw,p)
T(dic,a) Net taxes on production
represent the (other) taxes on production minus the (other) subsidies to production D29-D39 T(rw,a)
T(dic,dic) Current transfers4
include: current taxes on income, wealth, etc.; net social contributions; social benefits other than social transfers in kind; other current transfers, and; the adjustment made for the change in pension entitlements
D5 D61 D62 D7 D8 T(dic,rw) T(rw,dic) T(dik,dik) Capital transfers
include: capital taxes; investment grants; and other capital transfers
D91
T(dik,rw) D92
T(rw,dik) D99
T(dik,dic) measures the portion of aggregate income that is not used for final consumption expenditure Gross saving
and current transfers to domestic institutions or to the rest of the world B8g T(dif,dik) the net lending or borrowing of the total economy is the sum of the Net lending(+)/borrowing(−)
net lending or borrowing of the institutional sectors B9
T(dif,dif) Financial transactions
include: monetary gold and special drawing rights; currency and deposits; debt securities; loans; equity and investment fund shares or units; insurance, pension and standardised guarantee schemes;
financial derivatives and employee stock options; and other accounts receivable/payable
F1 to F8 T(dif,rw)
T(rw,dif)
Source: Own construction, based on Santos [10] and [11]. Note: A description on the levels of valuation of the flows associated to the production accounts can be found in the Appendix of Santos [12].
3Also referred to as gross added value in T(f,a).
4The adjustment made for the change in pension entitlements (D8), included in T(dic,dic), is not a current transfer but, due to its insignificance (0.3% of the total current transfers within domestic institutions in 2013), I did not change the designation of this part of the SAM.
DOI: 10.4236/tel.2018.85075 1088 Theoretical Economics Letters Outline 1 schematically represents the above described flows, in which the smaller circle represents the (domestic) economy and the bigger one the world. With the direction of the arrows representing the direction of the flows that are being studied, within the smaller circle are all the flows within the domestic economy with the flows between this and the rest of the world being represented by the arrows that cut over its boundaries. This representation helps us to un-derstand how important the study of the direct and induced effects of any change in any nominal flow is in the whole economy, for which the SAM-based modelling is an alternative. That importance is reinforced if we consider that, on one hand, the intensity of those flows is determined by their values, as shown in
Table 4 for Portugal in 2013, and, on the other hand, the network of linkages can be extended or disaggregated, as will be seen in Chapter 3.
2.2. Application
In the SNA, the Integrated Economic Accounts (IEA) Table is a summary of all the detail observed by that System, including the full sequence of accounts for (domestic) institutional sectors, the rest of the world and the total economy. Based on this table, and taking into consideration the previous descriptions, it
Outline 1. A SAM base form (level of disaggregation 0)—schematic representation of the nominal flows between the accounts, presented and described in Table 1 and Table 3. Source: Own construction, based on Santos [13].
DOI: 10.4236/tel.2018.85075 1089 Theoretical Economics Letters Table 4. A SAM of Portugal in 2013—level of disaggregation. (In millions of Euros).
f a p dic dik dif rw
total 1 2 3 4 5 6 7 f 1 149,733 6739 156,472 a 2 307,861 307,861 p 3 158,093 0 143,644 24,914 67,284 393,935 dic 4 145,686 1682 20,607 88,074 7110 263,158 dik 5 26,164 2131 2852 31,148 dif 6 3946 −7804 −10,400 −14,259 rw 7 10,786 −1647 65,467a) 5276 157 −6455 73,584 total 156,472 307,861 393,935 263,158 31,148 −14,259 73,584
Source: Appendice Table A.1. a)65,573 (imports) less 106 (net taxes on products sent to the institutions of the European Union).
was possible to construct an illustrative SAM base form that is presented in Ta-ble 4, which represents the level of disaggregation 0 of the activity of Portugal as observed in the National Accounts of 2013 (at current prices).
Considering the description given in Table 2 and Table 3 about Table 1, and based on the reading of the rows and columns of Table 4 we can take a first snapshot of the activity of Portugal in 2013, as described below.
At the level of production accounts, through the factors of production account – row and column f (number 1), show the aggregate or primary income generated in 2013, also designated as compensation of the factors of production, namely of labour and capital, which was in the sum of 156,472 million Euros. Reading in row, this amount was composed of 149,733 (95.7%) and 6739 (4.3%) million Euros, received from domestic activities5 and from the rest of the world6,
respec-tively. Reading in column, this amount was composed of 145,686 (93.1%) and 10,786 (6.9%) million Euros, paid to domestic institutions7 and to the rest of the
world, respectively.
In turn, continuing at the level of the production accounts, in the activities account row and column a (number 2) show, respectively, the production value and the total costs associated with the process of production, which totalled 307,861 million Euros. In row, that amount represented the output of goods and services. In column, it was composed of 149,733 (48.3%) million Euros of com-pensation of factors of production, 158,093 (51.4%) million Euros of intermedi-ate consumption, 1682 (0.5%) million euros of net taxes on production received by the Portuguese Government and –1647 (−0.5%) million Euros of net taxes on production received by the institutions of the European Union8.
5Received by residents and non-residents working in the Portuguese economic territory. This amount is the gross added value and does not include taxes and subsidies on production and imports. 6Received by residents working in the rest of the world.
7Paid to residents in the Portuguese economic territory. This amount is the gross national income and does not include taxes and subsidies on production and imports.
8Due to the conventions underlying the SAM structure, this negative (net) amount represents a receipt and not an expenditure, that is, the amount received by activities as subsidies on production was greater than the amount expended in taxes on production.
DOI: 10.4236/tel.2018.85075 1090 Theoretical Economics Letters
Finally, still at the level of the production accounts, through the products ac-count—row and column p (number 3) show the main components of the aggre-gate demand and supply of the goods and services in the Portuguese economy in 2013, which amounted to 393,935 million Euros. Reading in row, the aggregate demand was composed of 158,093 (40.1%) million Euros of intermediate con-sumption, 143,644 (36.5%) million Euros of final concon-sumption, 24,914 (6.3%) million Euros of gross capital formation, and 67,284 (17.1%) million Euros of exports. Reading in column, the aggregate supply was composed of 307,861 (78.2%) million Euros of the output of goods and services, 20,607 (5.2%) million Euros of net taxes on products received by the Portuguese Government, −106 million Euros of net taxes on received by the institutions of the European Union8, and 65,573 (16.6%) million Euros of imports, the last two added in the
same cell (T(rw,p)). The trade and transport margins are also a component in account p, which amounts to zero at this level of disaggregation, as mentioned in
Table 3.
At the level of the domestic institutions accounts, in the current account – row and column dic (number 4) the aggregate income of the Portuguese institutions in 2013 is shown, which amounted to 263,158 million Euros. In row we have the origin of that income, represented as follows: 145,686 (55.4%) million Euros, re-ceived as compensation of the factors of production by domestic institutions; 1682 (0.6%) and 20,607 (7.8%) million Euros of net taxes on production and net taxes on products, respectively—both received by the Portuguese government; 88,074 (33.5%) and 7110 (2.7%) million Euros of current transfers within do-mestic institutions and from the rest of the world, respectively. In column we have the destination or use of the same income, with the following composition: 143,644 (54.6%) million Euros, in final consumption; 88,074 (33.5%) and 5276 (2.0%) million Euros in current transfers within domestic institutions and to the rest of the world; 26,164 (9.9%) million Euros in gross savings.
In the capital account row and column dik (number 5), apart from showing the net lending (or borrowing) of the Portuguese institutions in 2013, informa-tion is also shown regarding acquisiinforma-tions, less disposals of non-financial assets (or the various types of investment in non-financial assets) and capital transfers, which amounted to 31,148 million Euros. Reading in row, this amount repre-sents investment funds, and was composed of: 26,164 (84%) million Euros of gross savings; 2131 (6.8%) and 2852 (9.2%) million Euros of capital transfers within domestic institutions and from the rest of the world. Reading in column, this amount represents aggregate investment and was composed of: 24,914 (80%) million Euros of gross capital formation; 2131 (6.8%) and 157 (0.5%) mil-lion Euros of capital transfers within domestic institutions and to the rest of the world, respectively, and 3946 (12.7%) million Euros of net lending.
The financial account row and column dif (number 6), represents the net flows associated with the acquisition of financial assets and the incurrence of li-abilities, underlying which there is the above mentioned net lending. These flows
DOI: 10.4236/tel.2018.85075 1091 Theoretical Economics Letters
amounted to −14,259 million Euros. Reading in row, this amount is composed of 3946 million Euros of net lending, −7804 million Euros of net financial trans-actions between domestic institutions, and −10,400 million Euros of net finan-cial transactions from the rest of the world. Reading in column, besides the net financial transactions between domestic institutions (−7804 million Euros), this amount also includes −6455 million Euros of net financial transactions to the rest of the world.
The rest of the world account row and column rw (number 7) show all the transactions between resident and non-resident actors in the accounts described above (production and domestic institutions), or between the Portuguese economy and the rest of the world in 2013, which amounted to 73,584 million Euros. Thus, the row represents the flows from residents to non-residents, or the value of transactions to the rest of the world, with the following composition: 10,786 (14.7%) million Euros of compensation of factors of production, −1647 (−2.2%) million Euros of net taxes on production (received by European Union institutions)8 65,467 (89%) million Euros of imports (65,573 million Euros), to
which is added net taxes on products (−106 million Euros, received by the insti-tutions of the European Union8), 5276 (7.2%) million Euros of current transfers,
157 (0.2%) million Euros of capital transfers, and −6455 (−8.8%) million Euros of net financial transactions. In turn, the column shows the decomposition of the value of transactions from the rest of the world, or the flows from non-residents to residents, as follows: 6739 (9.2%) million Euros of compensation of factors of production, 67,284 (91.4%) million Euros of exports, 7110 (9.7%) million Euros of current transactions, 2852 (3.9%) million Euros of capital transfers, and −10,400 (−14.1%) million Euros of net financial transactions.
2.3. Macroeconomic Aggregates and Types of Income
As practically all the flows observed and measured by the National Accounts are included in the above presented SAM, it is possible to calculate and/or extract from it the main macroeconomic aggregates that are usually considered.
The following description is based on the four tables presented above.
Gross Domestic Product (GDP) can be calculated using the three known ap-proaches: the production approach—in which intermediate consumption [T(p,a)] is subtracted from the output of goods and services [T(a,p)], adding the net taxes on products [T(dic,p) + (part of) T(rw,p)]; the expenditure approach in which final consumption [T(p,dic)], gross capital formation [T(p,dik)], and net exports [T(p,rw) – (part of) T(rw,p)] are added; and the income approach in which net taxes on production and imports [T(dic,p) + (part of) T(rw,p) + T(dic,a) + T(rw,a)] are added to the gross added value [T(f,a)]. The Portuguese GDP in 2013 was 170,269 million Euros.
GDP is the income generated in the domestic economy by residents and non-residents, added to the total net taxes on production and imports, to be valued at market prices.
DOI: 10.4236/tel.2018.85075 1092 Theoretical Economics Letters
Gross Domestic Product can be converted into Gross National Product or In-come (GNI), by adding the compensation of factors of production (labour and capital) received from the rest of the world [T(f,rw)], and by deducting the compensation of factors of production (labour and capital) and net taxes on production and imports sent to the rest of the world [T(rw,f) – T(rw,a) – (part of) T(rw,p)], when these exist. Gross National Income can also be calculated di-rectly from the SAM by adding the compensation of factors received by domes-tic institutions to the net taxes on production and on products received by do-mestic institutions [T(dic,f) + T(dic,a) + T(dic,p)]. The corresponding amount for Portugal in 2013 was 167,975 million Euros.
GNI is the income generated in the domestic economy and in the rest of the world by residents, added to the part received by the general government of net taxes on production and imports, to be valued at market prices.
Disposable Income (DI) can be calculated by adding the net current transfers received by domestic institutions [(received, or row sum) T(dic,dic) + T(dic,rw) – (paid, or column sum) T(dic,dic) + T(rw,dic)] to Gross National Income. In our application for Portugal, this was 169,808 million Euros.
The following macroeconomic aggregates are usually presented with the above: Gross Saving (S) and Net Lending (NL), or Net Borrowing (NB), which are items that are provided directly by the SAM, through T(dik,dic) and T(dif,dik), respectively, which, in the case of Portugal in 2013, were 26,164 and 5276 million Euros, respectively. As explained in Table 3, the latter amount represents NL, if it represented NB it would then be positioned in the T(dik,dif) cell. As confirmed by its position in the SAM structure, these figures integrate the funds of investment, either in non-financial and in financial assets, which I call “accumulated income”.
Without considering NL and NB, the above mentioned gross aggregates can be converted into net aggregates (and S), by deducting the consumption of fixed capital. This lies outside the SAM base form, but is part of the Integrated Eco-nomic Accounts (IEA) Table, in which the above presented macroecoEco-nomic ag-gregates are balancing items (codes B)—Appendices Table A.1 is illustrative of the case of Portugal in 2013.
3. SAM Accounts Disaggregation, Extension and
Complements
From the presented base form, or level of disaggregation 0, depending on the aim of the study in which the SAM is being adopted and the available informa-tion, other SAMs can be constructed, with other levels of disaggregation in the production, institutions and rest of the world accounts, either within the scope of the SNA conventions, or not. Thus, each cell of the SAM base form (see Table 1 and Table 4, for the application to Portugal) will be converted into a sub-matrix, with the number of rows and columns corresponding to the level of disaggregation of the row and column accounts. The following description will
DOI: 10.4236/tel.2018.85075 1093 Theoretical Economics Letters
continue adopting the latest version of the SNA nomenclatures and the type of the flows after the disaggregation will continue to be the same, although with the due specifications. The consistency of the whole system will therefore be pre-served.
A first level of disaggregation (level of disaggregation 1) will be presented be-low. No other levels of disaggregation will be made in this article, and that will be adopted as the specification of what can be made from the base form pre-sented in the previous chapter.
I am aware that I am only making an introductory approach to the study of the structures of production and income distribution and that higher levels of disaggregation are required for more complete studies. However, as I stated in the Introduction, the purpose of this study is methodological, and as such, a co-herent and thorough treatment of this first level will facilitate the move to higher levels.
Before continuing, I would also like to mention the possibilities that Quarterly and Regional National Accounts provide in terms of disaggregation in time and in space9. In turn, the Satellite Accounts (and other extensions), as presented in
Chapter 29 of SNA (2008) can provide supplementary information in specific areas (such as: labour, health, unpaid household activity, household production) in a way that is consistent with the central framework [1], which can be useful to extend and/or complement the SAM.
3.1. Production Accounts and the IOMs
As shown by Table 2, in the base form, the SAM production account is divided into factors of production, activities (industries) and products. These accounts correspond, respectively to the following SNA accounts: primary distribution of income, production, and goods and services. The nominal flows associated to those accounts can be identified in Table 1 and are described in Table 3.
Within the SAM production accounts, one can see how the income resulting from the process of production and the ownership of assets is distributed within institutions and activities and how the available products (or goods and services) are used. These accounts also provide details about the process of production, regarding which the Input-Output Matrix (IOM) can add some more informa-tion on intermediate consumpinforma-tion of activities and products.
Considering the available information and the SNA nomenclatures, in this ar-ticle the disaggregation of the factors of production account was made in “la-bour” and “others”. The former (labour) includes the compensation of employ-ees. The later (others) includes the compensation of employers and own account (or self-employed) workers and also the compensation of capital, namely prop-erty income. Such information can be derived from the IEA Table if the prod-ucts and activities accounts are not disaggregated and from the Use Table, if the same accounts are disaggregated.
DOI: 10.4236/tel.2018.85075 1094 Theoretical Economics Letters
At the level of the SNA, the International Standard Industrial Classification of All Economic Activities (ISIC) Revision 4 (released on August 2008) is used to classify activities, which are organised into 21 sections, with the possibility of going as far as the fourth level of disaggregation. Identical organization is adopted by ESA, the Statistical Classification of Economic Activities in the European Community (NACE) Revision 2 (released on January 2008). The Sup-ply and Use Tables provide this information, usually at a third level of disaggre-gation.
Regarding products, the SNA uses the Central Product Classification (CPC) Version 2.1 (released on August 2015), which are organised into 10 sections, with the possibility of going as far as the fifth level of disaggregation within each of these. The ESA uses the Statistical Classification of Products by Activity (CPA) Version 2.1 (released on November 2012), which are organised in the same way as activities, as the name implies.
For the application to Portugal in 2013, in a first level of disaggregation, besides the two above mentioned sub-accounts, in the factors of production account (la-bour and others), ten activities (or industries) and ten products (or goods and ser-vices) were disaggregated into the activities and products accounts, respectively, which is described in Table 5. Such disaggregation were made from the Supply and Use Tables (see Appendices Table A.2 and Appendices Table A.3), as pre-sented in the SAM of Table 7. In turn, in Table 8 and Table 9 we can see IOMs
Table 5. Products (or goods and services) and activities (or industries) description for the level of disaggregation 1.
SAM Accounts National Accounts
Products of activity … (p) Activities (a) Description NACE Rev.2 Division p01 a01 Agriculture, forestry and fishing 01 - 03 p02 a02 Industry, energy, water supply and sewerage 05 - 39
p03 a03 Construction 41 - 43
p04 a04 Wholesale and retail trade, repair of motor vehicles and motorcycles; transportation and storage;
accommodation and food service activities 45 - 56
p05 a05 Information and communication 58 - 63
p06 a06 Financial and insurance activities 64 - 66
p07 a07 Real estate activities 68
p08 a08 Professional, scientific and technical activities; administrative and support service activities 69 - 82 p09 a09 Public administration and defence; compulsory social security; education; human
health and social work activities 84 - 88 p10 a10 Arts; entertainment; repair of household goods and other services 90 - 99
DOI: 10.4236/tel.2018.85075 1095 Theoretical Economics Letters
specifying the intermediate consumption of activities and products, respectively. This is the first time that I include IOMs in my research with SAMs. For now on, these matrices will only be used to increase the detail of the production structural features. Especially for the case of the “industry by industry” IOM, this should be considered as a first step for further research in order to explore the following Graham Pyatt’s statement:
“… SAMs and extended IO tables are not equivalent and one key difference can be explained by analogy. The essence of IO is not that production activity is disaggregated into different industries, but that these industries are related, one to other, through transactions between them, i.e. through the buying and selling of raw materials, and that the structure of production is conditioned by these linkages. By the same token, the essence of a SAM, in this context, is not the disaggregation of institutions into different household types plus various catego-ries of companies, government and the rest of the world, all of which is on offer through an extended IO approach. Rather, the essential detail is to be found in the matrix of transactions and transfers between different types of institutions. These details include the unrequited transfers which characterize the social secu-rity system and direct taxation, all types of private remittance and all property income flows. The pattern of these transfers conditions the distribution of in-come in exactly the same way as the pattern of inter industry transactions condi-tions the structure of production” [14].
3.2. Domestic Institutions and Rest of the World Accounts
The proposed SAM base form, presented in Table 1, disaggregates the domestic institutions accounts into current, capital and financial accounts. As is systema-tized by Table 2, the capital and financial accounts have a direct correspondence between SAM and SNA, whereas the SAM current account corresponds to the following SNA accounts: secondary distribution of income, redistribution of in-come in kind and use of inin-come. Once again, the flows associated with these ac-counts can be identified in Table 1, which are described in Table 3.
Depending on the adopted level of disaggregation, through the current ac-count we can see how national income is transformed into disposable income through the receipt and payment of current transfers, and how the latter is dis-tributed between final consumption and saving. On the other hand, through the capital account, we can see the flows linked to acquisitions less disposals of non-financial assets (or the various types of investment in non-financial assets), the capital transfers involving the redistribution of income, and the net lending or borrowing of domestic institutions. In the financial account we can see the net flows that involve financial assets and liabilities that take place between do-mestic institutions, and between these and the rest of the world.
Both in the SAM and in the SNA through the rest of the world account we can see all the linkages between the domestic economy and the rest of the world, i.e.
DOI: 10.4236/tel.2018.85075 1096 Theoretical Economics Letters
Chapter 4 of the 2008 SNA specifies the institutional sectors, including the rest of the world, as well as their possible disaggregation, which in some cases can be taken as far as the third level, although normally it cannot be taken be-yond the first level. In the case of the rest of the world, such disaggregation will certainly depend on the country, or group of countries, that adopt and adapt this system.
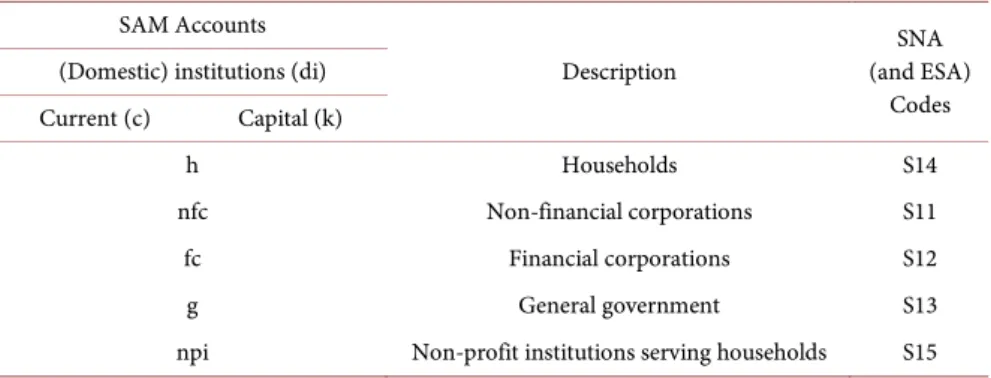
For the application to Portugal in 2013, in a first level of disaggregation, five institutional sectors were identified, as described in Table 6.
At the first level of disaggregation, the accounts of both institutions and the rest of the world are part of the IEA Table. Higher levels of disaggregation, whenever these are possible, are usually published in the separate accounts of in-stitutions. Even at the first level of disaggregation, any research carried out of the institutional sectors with flows involving more than one row or column of the SAM, also requires the so-called “from whom to whom matrices”. These matri-ces make it possible to fill in the cells of the sub-matrimatri-ces of transactions taking place both within domestic institutions, and also between domestic institutions and the rest of the world, which are recorded in the above described current, capital, and financial accounts10 .
Table 7 presents the level of disaggregation classified as the first, which was that rendered possible in the institutions’ current and capital accounts, derived from the IEA Table (see Appendices Table A.1) and the “from whom to whom matrices” for the application to Portugal in 2013.
Just as the matrix form of the production accounts may be easily worked on from the supply and use tables, it would also be possible to work on the matrix form of the institutional accounts if some kind of “from whom to whom tables” were made official. This would be a crucial factor for implementing the
Table 6. Domestic institutions description for the level of disaggregation 1.
SAM Accounts
Description (and ESA) SNA Codes (Domestic) institutions (di)
Current (c) Capital (k)
h Households S14
nfc Non-financial corporations S11
fc Financial corporations S12
g General government S13
npi Non-profit institutions serving households S15
Source: Own construction.
10For the application to Portugal in 2013 here presented, Statistics Portugal (INE), who works and discloses the non-financial National Accounts, provided (particularly) the “from whom to whom matrices” for the flows covered by the current an capital accounts to which those matrices were needed. However, that was not possible for the flows covered by the financial account, worked and disclosed by the Portuguese Central Bank (Banco de Portugal). That is why the financial SAM ac-count is not disaggregated, like the current and capital acac-counts are. The above mentioned “from whom to whom matrices” are not shown in this article because they are considered confidential by Statistics Portugal (INE).
DOI: 10.4236/tel.2018.85075 1097 Theoretical Economics Letters Table 7. A SAM of Portugal in 2013—level of disaggregation 1. (In millions of euros)
(a)
f a p
l o
Total a01 a02 a03 a04 a05 a06 a07 a08 a09 a10 Total p01 p02 p03 p04 p05 p06
1 2 3 4 5 6 7 8 9 10 11 12 13 14 15 16 17 18 f l 1 0 0 0 924 12,252 4161 17,398 2603 4102 418 6727 24,702 2993 76,280 0 0 0 0 0 0 o 2 0 0 0 3338 12,848 2520 18,900 2538 3813 17,353 3304 7167 1672 73,454 0 0 0 0 0 0 Total 0 0 0 4262 25,100 6681 36,298 5141 7915 17,771 10,031 31,869 4665 149,733 0 0 0 0 0 0 a a01 3 0 0 0 0 0 0 0 0 0 0 0 0 0 0 7556 298 17 123 0 0 a02 4 0 0 0 0 0 0 0 0 0 0 0 0 0 0 3 95,574 393 1546 9 0 a03 5 0 0 0 0 0 0 0 0 0 0 0 0 0 0 0 148 17,816 76 0 0 a04 6 0 0 0 0 0 0 0 0 0 0 0 0 0 0 13 1914 240 59,868 528 40 a05 7 0 0 0 0 0 0 0 0 0 0 0 0 0 0 0 100 44 218 10,904 0 a06 8 0 0 0 0 0 0 0 0 0 0 0 0 0 0 0 0 0 0 98 14,355 a07 9 0 0 0 0 0 0 0 0 0 0 0 0 0 0 0 0 355 7 0 0 a08 10 0 0 0 0 0 0 0 0 0 0 0 0 0 0 0 16 21 227 99 0 a09 11 0 0 0 0 0 0 0 0 0 0 0 0 0 0 14 64 178 476 142 0 a10 12 0 0 0 0 0 0 0 0 0 0 0 0 0 0 0 0 19 65 1 0 Total 0 0 0 0 0 0 0 0 0 0 0 0 0 0 7586 98,115 19,083 62,604 11,782 14,395 p p01 13 0 0 0 1094 6144 1 432 3 0 1 41 93 29 7838 3128 0 0 −3128 0 0 p02 14 0 0 0 2655 57,648 4811 11,183 1150 197 423 1126 4933 677 84,804 0 24,774 0 −24,774 0 0 p03 15 0 0 0 108 538 4878 743 114 72 339 98 698 71 7660 0 0 0 0 0 0 p04 16 0 0 0 200 2716 200 6920 214 202 36 575 1701 224 12,988 0 0 0 0 0 0 p05 17 0 0 0 52 624 88 914 2431 664 43 1188 744 177 6925 0 0 0 −459 459 0 p06 18 0 0 0 142 1427 691 1896 137 4080 −169 1026 506 115 9850 0 0 0 0 0 0 p07 19 0 0 0 6 458 105 1180 171 367 184 169 401 80 3120 0 0 0 0 0 0 p08 20 0 0 0 215 3958 713 5669 1989 1353 327 4336 2665 784 22,009 0 0 0 0 0 0 p09 21 0 0 0 11 83 22 109 129 55 7 87 1049 28 1579 0 0 0 0 0 0 p10 22 0 0 0 26 117 24 171 130 94 10 80 197 470 1320 0 0 0 −1 0 0 Total 0 0 0 4 510 73,714 11,533 29,216 6467 7,085 1200 8726 12,987 2654 158,093 3128 24,774 0 −28,362 459 0 di c h 23 76,246 41,299 117,544 0 0 0 0 0 0 0 0 0 0 0 0 0 0 0 0 0 nfc 24 0 22,486 22,486 0 0 0 0 0 0 0 0 0 0 0 0 0 0 0 0 0 fc 25 0 5667 5667 0 0 0 0 0 0 0 0 0 0 0 0 0 0 0 0 0 g 26 0 −784 −784 −34,651 14,401 3385 19,985 665 16,369 38,596 4256 −46,190 −18,134 1682 95 13,059 492 1932 1018 1068 npi 27 0 773 773 0 0 0 0 0 0 0 0 0 0 0 0 0 0 0 0 0 Total 76,246 69,440 145,686 −34,651 14,401 3385 19 985 3665 16,369 38,596 4256 −46,190 −18,134 1682 95 13,059 492 1932 1018 1068 di k h 28 0 0 0 0 0 0 0 0 0 0 0 0 0 0 0 0 0 0 0 0 nfc 29 0 0 0 0 0 0 0 0 0 0 0 0 0 0 0 0 0 0 0 0 fc 30 0 0 0 0 0 0 0 0 0 0 0 0 0 0 0 0 0 0 0 0 g 31 0 0 0 0 0 0 0 0 0 0 0 0 0 0 0 0 0 0 0 0 npi 32 0 0 0 0 0 0 0 0 0 0 0 0 0 0 0 0 0 0 0 0 Total 0 0 0 0 0 0 0 0 0 0 0 0 0 0 0 0 0 0 0 0 dif 33 0 0 0 0 0 0 0 0 0 0 0 0 0 0 0 0 0 0 0 0 rw 34 371 10,415 10,786 33,931 −14,101 −3315 −19,570 −3588 −16,029 −37,794 −4168 45,230 17,758 −1647 3285 53,756 117 4213 1319 685 Total 76 617 79,856 156,472 8052 99,113 18,284 65,929 11,684 15,340 19,774 18,845 43,897 6943 307,861 14,094 189,703 19,691 40,388 14,578 16,148 Sources: Statistics Portugal (INE); Portuguese Central Bank (Banco de Portugal).
DOI: 10.4236/tel.2018.85075 1098 Theoretical Economics Letters (b) p dic dik dif rw Total p07 p08 p09 p10
Total h nfc fc g npi Total h nfc fc g npi Total
19 20 21 22 23 24 25 26 27 28 29 30 31 32 33 34 f l 1 0 0 0 0 0 0 0 0 0 0 0 0 0 0 0 0 0 0 337 76,617 o 2 0 0 0 0 0 0 0 0 0 0 0 0 0 0 0 0 0 0 6402 79,856 Total 0 0 0 0 0 0 0 0 0 0 0 0 0 0 0 0 0 0 6739 156,472 a a01 3 0 57 0 0 8052 0 0 0 0 0 0 0 0 0 0 0 0 0 0 8052 a02 4 3 1482 39 63 99,113 0 0 0 0 0 0 0 0 0 0 0 0 0 0 99,113 a03 5 84 158 1 0 18,284 0 0 0 0 0 0 0 0 0 0 0 0 0 0 18,284 a04 6 105 2704 30 487 65,929 0 0 0 0 0 0 0 0 0 0 0 0 0 0 65,929 a05 7 10 408 1 0 11,684 0 0 0 0 0 0 0 0 0 0 0 0 0 0 11,684 a06 8 672 116 100 0 15,340 0 0 0 0 0 0 0 0 0 0 0 0 0 0 15,340 a07 9 19,309 101 2 0 19,774 0 0 0 0 0 0 0 0 0 0 0 0 0 0 19,774 a08 10 3 18,477 2 0 18,845 0 0 0 0 0 0 0 0 0 0 0 0 0 0 18,845 a09 11 353 2209 40,416 45 43,897 0 0 0 0 0 0 0 0 0 0 0 0 0 0 43,897 a10 12 11 220 2 6624 6943 0 0 0 0 0 0 0 0 0 0 0 0 0 0 6943 Total 20,550 25,932 40,595 7220 307,861 0 0 0 0 0 0 0 0 0 0 0 0 0 0 307,861 p p01 13 0 0 0 0 0 4666 0 0 0 0 4666 58 431 14 46 12 561 0 1029 14,094 p02 14 0 0 0 0 0 50,256 0 0 1469 0 51,725 1395 3895 228 1075 198 6792 0 46,383 189,703 p03 15 0 0 0 0 0 116 0 0 146 0 262 2136 6640 365 1670 306 11,118 0 651 19,691 p04 16 0 0 0 0 0 11,707 0 0 897 1 12,605 4 13 1 3 1 22 0 14,773 40,388 p05 17 0 0 0 0 0 4189 0 0 158 15 4362 395 1262 68 309 57 2091 0 1201 14,578 p06 18 0 0 0 0 0 5658 0 0 130 0 5788 0 0 0 0 0 0 0 509 16,148 p07 19 0 0 0 0 0 16,144 0 0 20 0 16,164 240 770 41 188 35 1273 0 9 20,566 p08 20 0 0 0 0 0 1778 0 0 189 68 2034 567 1805 97 443 82 2994 0 2493 29,531 p09 21 0 0 0 0 0 7492 0 0 29,183 2388 39,063 0 0 0 0 0 0 0 109 40,751 p10 22 0 0 0 1 0 5711 0 0 308 955 6973 25 23 1 8 7 64 0 127 8483 Total 0 0 0 1 0 107,717 0 0 32,501 3426 143,644 4820 14,838 815 3743 697 24,914 0 67,284 393,935 di c h 23 0 0 0 0 0 1614 1419 3091 31,536 314 37,974 0 0 0 0 0 0 0 5010 160,528 nfc 24 0 0 0 0 0 1419 0 397 82 0 1898 0 0 0 0 0 0 0 19 24,403 fc 25 0 0 0 0 0 2849 663 1 127 36 27 4 703 0 0 0 0 0 0 0 531 10,901 g 26 9 1805 26 1102 20,607 34,998 4726 1146 23 22 40,915 0 0 0 0 0 0 0 1425 63,844 npi 27 0 0 0 0 0 709 147 56 1661 13 2585 0 0 0 0 0 0 0 124 3482 Total 9 1805 26 1102 20,607 41,588 6955 5817 33,339 375 88,074 0 0 0 0 0 0 0 7110 263,158 di k h 28 0 0 0 0 0 9763 0 0 0 0 9763 0 0 273 33 0 306 0 176 10,245 nfc 29 0 0 0 0 0 0 17,316 0 0 0 17,316 0 0 9 397 0 406 0 807 18,529 fc 30 0 0 0 0 0 0 0 4246 0 0 4246 0 0 241 748 0 989 0 12 5247 g 31 0 0 0 0 0 0 0 0 −4799 0 −4799 3 160 45 0 2 211 0 1737 −2851 npi 32 0 0 0 0 0 0 0 0 0 −361 −361 0 0 17 203 0 219 0 120 −22 Total 0 0 0 0 0 9763 17,316 4246 −4799 −361 26,164 3 160 585 1381 2 2131 0 2852 31,148 dif 33 0 0 0 0 0 0 0 0 0 0 0 6921 2393 3599 −8245 −721 3946 −7804 −10,400 −14,259 rw 34 7 1793 130 161 65,467 1460 133 838 2803 42 5276 −1499 1138 248 270 0 157 −6455 73,584 Total 20,566 29,531 40,751 8483 393,935 160,528 24,404 10,900 63,844 3482 263,158 10,245 18,529 5247 −2851 −22 31,148 −14,259 73,584 Sources: Statistics Portugal (INE); Portuguese Central Bank (Banco de Portugal).
DOI: 10.4236/tel.2018.85075 1099 Theoretical Economics Letters
SAM-based approach, in which SAMs with production and institutions ac-counts, capturing the network of linkages associated to the measured flows of income, would form the basis for macroeconomic models which would be capa-ble of reproducing the multiplier processes that are implicit in the socioeco-nomic activity of countries.
4. Evidences on the Structural Features of the
Socioeconomic Activity of a Country
In Chapter 2, Section 2.2, we first approached the structures of production, in-come distribution, investment, and transactions with the rest of the world, when we read the rows and the columns of the seven accounts of the level of disaggre-gation 0 of the SAM of Portugal in 2013—Table 4. As we saw in Chapter 3, higher levels of disaggregation of the SAM and possible extensions and/or com-plementary information, such as IOM, will certainly improve our knowledge of those structures—Tables 7-9 illustrate this for the case of Portugal in 2013.
An exhaustive reading of the rows and columns of Table 7, such as was car-ried out for the level of disaggregation 0 (Table 4), would be extensive and time consuming and would be beyond the scope of this study. In this chapter we ex-amine the values in the proposed SAM that can be used to describe the structural features of the socio-economic activity of a country, in transition between Chapters 2 and 3, in which a SAM and its possibilities of work were presented, and in Chapter 5, where multiplier effects on the distribution of generated in-come will be studied.
Returning to Chapter 2, and to our previous analysis of Table 4, in the case of the aggregate income, associated with the compensation of the factors of pro-duction, which total 156,472 million Euros, from Table 7, we now can see that 76,617 million Euros was compensation of employees—row and column 1, and 79,856 million Euros account for compensation of other factors of production, namely employers and the self-employed, land, and capital (including property income)—row and column 2. Row 1 shows that the total received as compensa-tion of employees corresponded to a part of the gross added value11 generated in
the domestic activities by residents and non-residents, in the sum of 76,280 mil-lion Euros, to which are added 337 milmil-lion Euros generated abroad by residents. In turn, row 2 shows that the total received as compensation of other factors of production corresponded to the other part of the gross added value11 generated
in the domestic activities by residents and non-residents, in the sum of 73,454 million Euros, to which 6402 million Euros generated abroad by residents are added. Next we examine the part generated from domestic activities, disaggre-gated in 10 sectors, which will improve the information available for the study of the functional distribution of generated income, as shown in Table 10.
Column 1 shows that the total paid as compensation of employees corre-sponded to a part of the gross national income generated in the domestic economy
DOI: 10.4236/tel.2018.85075 1100 Theoretical Economics Letters Table 8. The intermediate consumption of an activity by activity (or industry by industry) IOM of Portugal in 2013—level of dis-aggregation 1. (In millions of euros)
a01 a02 a03 a04 a05 a06 a07 a08 a09 a10 Total
Domestic (basic prices)
a01 742 3591 10 279 8 2 1 24 57 15 4729 a02 1398 24,802 2530 5361 494 178 128 727 2557 389 38,564 a03 94 515 4185 689 104 58 158 118 573 61 6555 a04 466 8179 616 8671 756 422 63 1126 2587 416 23,302 a05 41 549 78 712 1827 565 18 871 559 137 5357 a06 121 1251 515 1781 140 3315 398 876 460 98 8953 a07 9 536 215 1320 210 405 129 205 444 93 3564 a08 168 2638 470 3602 1340 856 112 2889 1813 518 14,406 a09 30 400 124 497 215 146 18 344 1110 77 2960 a10 28 107 23 189 79 125 5 78 147 341 1123 total 3096 42,566 8766 23,102 5171 6073 1030 7258 10,307 2144 109,513 Imports a01 344 1629 1 89 1 0 0 7 22 7 2100 a02 648 25,994 1989 2938 445 67 64 320 1197 182 33,845 a03 2 91 71 17 3 1 3 4 11 1 204 a04 88 2045 160 748 95 69 9 178 428 47 3867 a05 8 139 16 145 307 126 4 197 103 27 1071 a06 9 97 33 118 12 267 23 57 33 7 654 a07 0 2 1 3 1 1 0 1 1 0 10 a08 16 330 42 348 97 89 9 225 184 45 1384 a09 2 101 3 21 5 6 0 13 19 2 172 a10 0 8 1 4 2 1 0 2 3 1 22 total 1117 30,434 2316 4430 968 627 112 1004 2001 321 43,331
Total Flows (basic prices)—Intermediate Consumption (P2)
a01 1086 5219 11 368 9 3 1 31 78 22 6829 a02 2046 50,797 4519 8299 938 245 193 1047 3754 571 72,409 a03 96 605 4256 706 107 59 161 122 584 62 6759 a04 553 10,224 776 9419 851 491 72 1304 3015 463 27,169 a05 49 687 94 856 2134 691 22 1068 662 165 6429 a06 129 1347 547 1899 152 3581 421 932 493 105 9607 a07 9 538 215 1323 210 406 129 206 445 93 3574 a08 184 2968 512 3950 1437 945 120 3114 1997 563 15,790 a09 32 500 127 518 219 152 19 357 1129 79 3132 a10 28 115 24 193 81 127 5 80 150 342 1145 total 4213 73,001 11,082 27,532 6139 6700 1143 8262 12,308 2465 152,844 Total Flows (purchaser's prices)—Intermediate Consumption (P2)
Total 4510 73,714 11,533 29,216 6467 7085 1200 8726 12,987 2654 158,093
Sources: Statistics Portugal (INE); World Input-Output Database (WIOD). Note: In this table the structure of an aggregated version of the National In-put-Output Table (industry by industry) released by WIOD in November 2016, is adapted to the totals of the InIn-put-Output Table (product by product) released by INE in December 2016.
DOI: 10.4236/tel.2018.85075 1101 Theoretical Economics Letters Table 9. The intermediate consumption of a product by product IOM of Portugal in 2013 level of disaggregation 1. (In millions of euros)
p01 p02 p03 p04 p05 p06 p07 p08 p09 p10 Total
Domestic (basic prices)
p01 638 3577 0 154 2 0 0 28 39 21 4460 p02 1635 25,449 2622 5439 467 106 185 762 1921 370 38,956 p03 94 444 4964 691 107 58 289 125 522 58 7352 p04 540 6305 812 7873 229 168 115 919 2053 312 19,326 p05 38 496 71 628 2071 471 33 1233 415 133 5586 p06 117 1166 640 1710 111 3613 −167 1098 385 103 8776 p07 1 442 107 1186 176 363 184 201 368 85 3113 p08 163 3316 586 4600 1861 1009 254 5273 1637 623 19,322 p09 10 78 21 102 131 53 7 106 1021 28 1557 p10 25 111 24 149 88 78 10 85 144 351 1064 total 3259 41,384 9847 22,531 5243 5919 910 9832 8504 2086 109,513 Imports p01 285 1970 0 105 0 0 1 6 21 2 2390 p02 439 29,278 1246 2613 592 15 45 334 1400 171 36,133 p03 3 8 72 16 3 1 4 2 10 1 119 p04 4 104 22 952 28 25 3 82 67 16 1303 p05 5 74 9 92 471 64 5 164 76 21 981 p06 7 94 35 98 7 191 −11 54 44 7 526 p07 0 1 0 2 0 1 0 0 1 0 4 p08 7 274 58 439 143 108 18 432 174 52 1706 p09 0 0 0 0 0 0 0 1 5 0 7 p10 0 4 0 5 41 0 0 5 22 83 161 Total 750 31,807 1443 4323 1285 405 65 1079 1820 354 43,331
Total Flows (basic prices)—Intermediate Consumption (P2)
p01 922 5547 1 259 2 0 1 34 60 23 6850 p02 2073 54,727 3867 8052 1059 122 231 1096 3321 541 75,089 p03 97 452 5036 708 110 58 293 127 531 59 7472 p04 543 6409 834 8825 257 193 118 1001 2120 329 20,629 p05 43 570 80 719 2542 535 38 1397 491 154 6568 p06 124 1260 675 1808 118 3804 −178 1152 429 111 9302 p07 1 442 107 1188 176 364 184 202 368 85 3118 p08 170 3590 644 5039 2003 1117 273 5705 1811 675 21,028 p09 10 79 21 102 131 53 7 107 1026 28 1564 p10 25 115 24 154 129 78 10 90 166 434 1225 Total 4009 73,191 11,289 26,853 6527 6324 975 10,911 10,324 2440 152,844 Total Flows (purchaser’s prices)—Intermediate Consumption (P2)
p01 1023 6261 1 391 3 0 1 43 86 30 7838
DOI: 10.4236/tel.2018.85075 1102 Theoretical Economics Letters Continued p03 104 453 5037 714 110 71 321 128 654 68 7660 p04 180 2594 189 7061 202 194 33 718 1589 228 12,988 p05 47 582 86 750 2544 645 42 1427 624 177 6925 p06 128 1324 711 1882 123 4076 −156 1208 440 115 9850 p07 1 443 107 1188 176 364 185 202 368 85 3120 p08 184 3611 682 5091 2016 1336 302 5746 2272 769 22,009 p09 10 79 21 102 131 54 7 107 1039 28 1579 p10 25 115 24 155 132 94 10 91 190 484 1320 Total 4270 73,603 11,767 27,863 6570 7030 1121 11,135 12,019 2713 158,093
Sources: Statistics Portugal (INE).
and abroad by residents that is received by households, in the sum of 76,246 mil-lion Euros, to which are added 371 milmil-lion Euros generated in the domestic economy by non-residents and sent to the rest of the world.
In column 2, the total paid as compensation of other factors of production was decomposed in the part of the gross national income generated11 in the
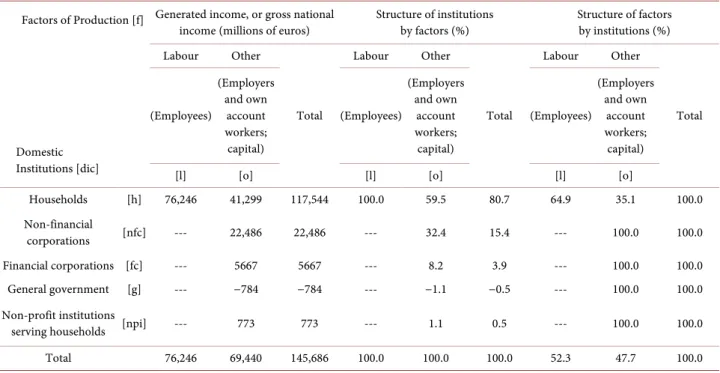
do-mestic economy and abroad by residents which was received by the various in-stitutional sectors, in the sum of 69,440 million Euros, to which are added 10,415 million Euros generated in the domestic economy by non-residents and sent to the rest of the world. From the part received by domestic institutions, we can also identify the structure of the institutional distribution of generated income, as shown in Table 11.
Continuing at the level of production accounts, the activities account, of the level of disaggregation 0, is now disaggregated into ten activity sectors, or indus-tries—rows and columns 3 to 12, with more detailed information regarding the production value (at basic prices), or output of goods and services (in rows) and the costs associated to the process of production (in columns), which total 307,861 million Euros for the Portuguese economy in 2013, as we had also seen in Chapter 2. Table 12, complemented by Table 13, show the structure of the former, Table 14, complemented by Table 15, show the structure of the latter.
In the structure of the SAM base form that is proposed in Chapter 2, at the level of disaggregation 0, the products account is the other of the three compo-nents of the production accounts, in addition to the factors of production and activities accounts. Similar to that which was carried out in the activities ac-count, at the level of disaggregation 1, the products account is now disaggregated into ten products, or goods and services—rows and columns 13 to 22, allowing for more detailed information about the components of the aggregate demand (in row) and supply (in column) of the goods and services in the Portuguese economy in 2013, which was in the amount of 393,935 million Euros, as we saw in Chapter 2. Table 16, complemented by Table 17, show the structure of ag-gregate demand and Table 18 show the structure of aggregate supply. Within aggregate demand, the intermediate consumption can also be specified by
DOI: 10.4236/tel.2018.85075 1103 Theoretical Economics Letters Table 10. Functional distribution of generated income12 in Portugal in 2013.
Factors of Production [f]
Activities [a]
Generated income, or gross added value, or gross domestic income
(millions of euros)
Structure of activities
by factors (%) Structure of factors by activity (%) Labour Other Total Labour Other Total Labour Other Total (Employees) (Employers and own-account workers; capital) (Employees) (Employers and own-account workers; capital) (Employees) (Employers and own-account workers; capital)
[l] [o] [l] [o] [l] [o]
Agriculture,
forestry and fishing [a01] 924 3338 4262 1.2 4.5 2.8 21.7 78.3 100.0
Industry, energy, water
supply and sewerage [a02] 12,252 12,848 25,100 16.1 17.5 16.8 48.8 51.2 100.0
Construction [a03] 4161 2520 6681 5.5 3.4 4.5 62.3 37.7 100.0
Wholesale and retail trade, repair of motor
vehicles and motorcycles; transportation
and storage; accommodation and food service
activities
[a04] 17,398 18,900 36,298 22.8 25.7 24.2 47.9 52.1 100.0
Information and
communication [a05] 2603 2538 5141 3.4 3.5 3.4 50.6 49.4 100.0
Financial and insurance
activities [a06] 4102 3813 7915 5.4 5.2 5.3 51.8 48.2 100.0
Real estate activities [a07] 418 17,353 17,771 0.5 23.6 11.9 2.4 97.6 100.0 Professional, scientific
and technical activities; administrative and support service activities [a08] 6727 3304 10,031 8.8 4.5 6.7 67.1 32.9 100.0 Public administration and defence; compulsory social security; education; human
health and social work activities
[a09] 24,702 7167 31,869 32.4 9.8 21.3 77.5 22.5 100.0
Arts; entertainment; repair of household
goods and other services
[a10] 2993 1 672 4665 3.9 2.3 3.1 64.2 35.8 100.0
Total 76,280 73,454 149,733 100.0 100.0 100.0 50.9 49.1 100.0
Source: Table 7.
12The difference between the total gross domestic income presented in this table and the gross domestic product presented in Section 2.3 of Chapter 2 is the total net taxes on production and imports.
DOI: 10.4236/tel.2018.85075 1104 Theoretical Economics Letters Table 11. Institutional distribution of generated income13 in Portugal in 2013.
Factors of Production [f]
Domestic Institutions [dic]
Generated income, or gross national
income (millions of euros) Structure of institutions by factors (%) Structure of factors by institutions (%) Labour Other Total Labour Other Total Labour Other Total (Employees) (Employers and own account workers; capital) (Employees) (Employers and own account workers; capital) (Employees) (Employers and own account workers; capital)
[l] [o] [l] [o] [l] [o]
Households [h] 76,246 41,299 117,544 100.0 59.5 80.7 64.9 35.1 100.0 Non-financial corporations [nfc] --- 22,486 22,486 --- 32.4 15.4 --- 100.0 100.0 Financial corporations [fc] --- 5667 5667 --- 8.2 3.9 --- 100.0 100.0 General government [g] --- −784 −784 --- −1.1 −0.5 --- 100.0 100.0 Non-profit institutions
serving households [npi] --- 773 773 --- 1.1 0.5 --- 100.0 100.0
Total 76,246 69,440 145,686 100.0 100.0 100.0 52.3 47.7 100.0
Source: Table 7.
Table 14 and Table 15. Within aggregate supply, the output of goods and ser-vices can also be specified by Table 12 and Table 13.
From the level of disaggregation 1 of the products account, and considering what was explained in Section 2.3 of Chapter 2 regarding the calculation of the Gross Domestic Product in the expenditure approach, it is also possible to de-compose that macroeconomic aggregate by goods and services, as shown in Ta-ble 19.
Within domestic institutions accounts, in the current account, as was men-tioned in Chapter 2, we can see the origin (in row) and destination or use (in column) of the aggregate income of institutions, which was in the sum of 263,158 million Euros, in the case of Portugal in 2013. As was also seen in Chap-ter 3, at the level of disaggregation 1, our application now has five institutional sectors, providing more details about the available information for our study.
Table 20 and Table 21 show the structures of those two perspectives.
On the other hand, as already mentioned in Chapter 3, Section 3.2, through the current account we can see how national income is transformed into dis-posable income through the receipt and payment of current transfers, and how the latter is distributed between final consumption and saving. As was explained in Chapter 2, Section 2.3, disposable income is calculated outside the SAM, as well as, the structures of its distribution and use. For the case of Portugal in 2013, these amounts can be seen in Table 22.
13The difference between the total gross national income presented in this table and the gross national product presented in Section 2.3 of Chapter 2 is the net taxes on production and imports received by the general government.
DOI: 10.4236/tel.2018.85075 1105 Theoretical Economics Letters Table 12. Output of industries (at basic prices) in Portugal in 2013 by goods and services.
Activities (industries) [a]
Products (goods and services) of… [p] A gr ic ul tu re , fo res tr y … In du str y, en er gy , … Co nst ru ct io n W ho les al e a nd re ta il tr ad e, … In fo rma tio n a nd commu ni ca tio n Fi na nc ia l a nd in sur an ce … Rea l es ta te ac tiv itie s Pr ofes sio na l, sc ie nti fic … Pu bl ic ad m in istr atio n … A rt s; en ter ta in m en t … To ta l (b y p ro du ct )
[a01] [a02] [a03] [a04] [a05] [a06] [a07] [a08] [a09] [a10]
M illi ons o f eu ro s % M illi ons o f eu ro s % M illi ons o f eu ro s % M illi ons o f eu ro s % M illi ons o f eu ro s % M illi ons o f eu ro s % M illi ons o f eu ro s % M illi ons o f eu ro s % M illi ons o f eu ro s % M illi ons o f eu ro s % M illi ons o f eu ro s % Agriculture, forestry and fishing [p01] 7556 93.8 3 0.0 0 0.0 13 0.0 0 0.0 0 0.0 0 0.0 0 0.0 14 0.0 0 0.0 7586 2.5 Industry, energy, water supply and sewerage [p02] 298 3.7 95,574 96.4 148 0.8 1914 2.9 100 0.9 0 0.0 0 0.0 16 0.1 64 0.1 0 0.0 98,115 31.9 Construction [p03] 17 0.2 393 0.4 17,816 97.4 240 0.4 44 0.4 0 0.0 355 1.8 21 0.1 178 0.4 19 0.3 19,083 6.2 Wholesale and retail trade, repair of motor vehicles and motorcycles; transportation and storage; accommodation and food service
activities [p04] 123 1.5 1546 1.6 76 0.4 59,868 90.8 218 1.9 0 0.0 7 0.0 227 1.2 476 1.1 65 0.9 62,604 20.3 Information and communication [p05] 0 0.0 9 0.0 0 0.0 528 0.8 10,904 93.3 98 0.6 0 0.0 99 0.5 142 0.3 1 0.0 11,782 3.8 Financial and insurance activities [p06] 0 0.0 0 0.0 0 0.0 40 0.1 0 0.0 14,355 93.6 0 0.0 0 0.0 0 0.0 0 0.0 14,395 4.7 Real estate activities [p07] 0 0.0 3 0.0 84 0.5 105 0.2 10 0.1 672 4.4 19,309 97.6 3 0.0 353 0.8 11 0.2 20,550 6.7 Professional, scientific and technical activities; administrative and support service activities [p08] 57 0.7 1482 1.5 158 0.9 2704 4.1 408 3.5 116 0.8 101 0.5 18,477 98.0 2209 5.0 220 3.2 25,932 8.4 Public administration and defence; compulsory social security; education; uman health and social work
activities [p09] 0 0.0 39 0.0 1 0.0 30 0.0 1 0.0 100 0.7 2 0.0 2 0.0 40,416 92.1 2 0.0 40,595 13.2 Arts; entertainment; repair of household goods and other
services
[p10] 0 0.0 63 0.1 0 0.0 487 0.7 0 0.0 0 0.0 0 0.0 0 0.0 45 0.1 6624 95.4 7220 2.3
Total [a.—production
value] (by activity) 8052 100.0 99,113 100.0 18,284 100.0 65,929 100.0 11,684 100.0 15,340 100.0 19,774 100.0 18,845 100.0 43,897 100.0 6943 100.0 307,861 100.0 Total (by activity) and
relative position 8052 2.6 99,113 32.2 18,284 5.9 65,929 21.4 11,684 3.8 15,340 5.0 19,774 6.4 18,845 6.1 43,897 14.3 6943 2.3 307,861 100.0 Source: Table 7.
DOI: 10.4236/tel.2018.85075 1106 Theoretical Economics Letters Table 13. Output of institutions (at basic prices) in Portugal in 2013.
Domestic Institutions
Output of goods and services
(millions of euros) Structure of institutions by output (%) Structure of output by institutions (%) Market Output Output for own final use Non-market output other than for final
use
Total Market Output for own Output final use
Non-market output other than for final use
Total Market Output for own Output final use Non-market output other than for final use Total Households 27,719 13,165 0 40,884 10.8 79.4 0.0 13.3 67.8 32.2 0.0 100.0 Non-financial corporations 209,082 1868 0 210,949 81.7 11.3 0.0 68.5 99.1 0.9 0.0 100.0 Financial corporations 14,670 213 0 14,883 5.7 1.3 0.0 4.8 98.6 1.4 0.0 100.0 General government 4276 1240 30,194 35,710 1.7 7.5 85.5 11.6 12.0 3.5 84.6 100.0 Non-profit institutions serving households 229 104 5101 5435 0.1 0.6 14.5 1.8 4.2 1.9 93.9 100.0 Total 255,975 16,590 35,296 307,861 100.0 100.0 100.0 100.0 83.1 5.4 11.5 100.0
Source: statistics portugal (INE).
The other two of the three domestic institutions accounts identified in Chap-ter 3, are the capital and the financial accounts, from which it is possible to ob-tain information on investment, respectively, in non-financial and financial as-sets and also the flows of funds associated with the corresponding acquisitions and disposals. Because it was not possible to disaggregate the financial account, we will not explore the part relating to financial assets, and neither will we di-rectly explore the rest of the world account, as the details associated with it that are considered to be of interest for the purpose of this study were approached with the accounts that had been previously worked on.
Thus, returning to the capital account, as was seen in Chapter 2, the invest-ment funds (in row) and aggregate investinvest-ment (in column) of institutions, amounted to 31,148 million Euros, in Portugal in 2013. The corresponding structures can be seen in Table 23 and Table 24.
As was carried out by Santos [13] [17] [18], for example, the main items of income and expenditure of the institutional sectors and of the rest of the world can be identified from the respective rows and columns of the SAM, when it is, at least, at a first level of disaggregation, as shown in Table 7 for our application to Portugal in 2013. In the case of the institutional sectors, in which we can talk about balance sheets of the institutions: the total balancing item is the corre-sponding net lending/borrowing; the current balancing item is the gross saving, and; the capital balancing item is the difference between the first and the second. In the case of the rest of the world we can talk about balance of payments and its components.