2019
UNIVERSIDADE DE LISBOA
FACULDADE DE CIÊNCIAS
DEPARTMENTO DE BIOLOGIA ANIMAL
A Machine Learning Based Drug Discovery Pipeline: Finding
New Therapies for Cystic Fibrosis
Paulo Nuno Hilário Teixeira de Sousa
Mestrado em Bioinformática e Biologia Computacional
Versão Provisória
Dissertação orientada por:
Prof. Dr. André Osório e Cruz de Azerêdo Falcão
e co-orientada por Prof. Dr. Carlos Miguel Farinha
Acknowledgments
I would like to begin by expressing my gratitude to Dr Andr´e Falc˜ao for the opportunity to develop this work, for his guidance, availability and sharing his knowledge and resources.
Thanks to Dr Carlos Farinha for his resourcefulness, for his guidance and on point instructions.
A special thanks to Carla Costa, for her hidden role in this work, without her persistence and infinite patience dealing with the endless bureaucracies and shipping nightmares I would still be waiting for the compounds.
Thanks to Sofia Correia, for making stuff happen and for opening many doors, both literally and fig-uratively.
Thanks to Madalena Pinto, the unacknowledged co-supervisor of this work. For always going the extra mile, always helpful and caring about what I was doing.
Thanks to Hugo Botelho, for his amazing work, for sharing his knowledge and for always going out of his way to help me.
To everyone at LASIGE and BioISI, thanks for the help and all the positive experiences.
Last but not least, I would like to thank FCT (Fundac¸˜ao para a Ciˆencia e a Tecnologia) for financing the scholarship and this project in the context of the project MIMED - Mining the Molecular Metric Space for Drug Design(PTDC/EEI-ESS/4923/2014).
Resumo
O avanc¸o tecnol´ogico e a crescente disponibilidade de dados p´ublicos levaram ao desenvolvimento de metodologias robustas de predic¸˜ao de atividade de compostos com base em aprendizagem autom´atica. Estas metodologias apresentam maior rapidez, eficiˆencia e menores custos que os m´etodos tradicionais de descoberta de f´armacos.
Fibrose Qu´ıstica (FQ) ´e uma doenc¸a autoss´omica progressiva para a qual existe urgente necessidade de surgimento de novas terapias. Mutac¸˜oes no gene CFTR nos pacientes de FQ levam `a produc¸˜ao defi-ciente do canal de membrana de transporte de ani˜oes CFTR, gerando desequil´ıbrios i´onicos e transporte anormal de fluidos. FQ afeta v´arios ´org˜aos, os pulm˜oes com mais gravidade, sendo normalmente de-vido a problemas nestes a causa de morte prematura. A mutac¸˜ao mais prevalente e relevante em FQ ´e a delec¸˜ao da fenilalanina 508 (F508del-CFTR). Por esta raz˜ao, os principais esforc¸os de descoberta de novos f´armacos s˜ao direcionados a corrigir ou amenizar os efeitos desta mutac¸˜ao.
Foi criada uma metodologia com recurso a modelos de aprendizagem autom´atica de classificac¸˜ao e regress˜ao baseada em m´aquinas de vetores de suporte e Random Forests para descoberta de compos-tos com potˆencial terapˆeutico em FQ a partir de bases de dados de composcompos-tos de acesso p´ublico. Os compostos mais promissores foram selecionados e testados em laborat´orio atrav´es de ensaios de imuno-fluorescˆencia com microscopia automatizada de triagem e an´alise de alto rendimento sobre o efeito na F508del-CFTR, com base na eficiˆencia de tr´afego da F508del-CFTR para a membrana plasm´atica. Os 10 compostos com melhores resultados neste ensaio foram validados com Western Blot e comparados com dois conhecidos compostos corretores da F508del-CFTR. 4 compostos foram identificados como promissores compostos terapˆeuticos para FQ.
Palavras-chave: Aprendizagem Autom´atica; Qu´ımioinform´atica; Fibrose Qu´ıstica; Predic¸˜ao de F´armacos; CFTR.
Abstract
The recent technological advancements and growth in publicly available data led to the development of robust methodologies of prediction of biological activity based on machine learning models. These methodologies are typically faster, more efficient and less expensive than traditional drug discovery approaches.
Cystic Fibrosis (CF) is an progressive autosomal recessive disease for which there is an urgent need of new therapies. Mutations in the CFTR gene in CF patients lead to the production of a deficient CFTR anion transport membrane channel, resulting in ionic imbalances and abnormal fluid transport. CF affects many organs, but the typical cause of early death is due to lung complications. The most prevalent and relevant mutation in CF is the deletion of phenylalanine 508 (F508del-CFTR), and for this reason, the main efforts in drug discovery in CF are directed at correcting or reducing the effects of this mutation.
A pipeline for drug discovery in CF was developed, based on classification and regression machine learning models using Support Vector Machines and Random Forests and public access databases of compounds. The most promising compounds were selected and studied in vitro in a high-throughput screening immunofluorescence assay with automated microscopy. The traffic efficiency of F508del-CFTR to the plasma membrane was assessed and the 10 best compounds were validated with Western Blot. 4 compounds were identified as promising therapeutics for CF.
Keywords: Machine Learning; Chemoinformatics; Drug Discovery; Cystic Fibrosis; CFTR.
Resumo Alargado
Com o avanc¸o tecnol´ogico e crescente disponibilidade de dados p´ublicos, cada vez mais s˜ao procura-dos meios mais r´apiprocura-dos, eficientes e menos dispendiosos nos processos de descoberta de novos f´armacos. Em paralelo, a crescente disponibilidade de dados e de recursos computacionais permite novas aborda-gens a problemas de dif´ıcil resoluc¸˜ao em biologia e medicina. Uma poss´ıvel abordagem baseia-se no uso de modelos de predic¸˜ao de atividade biol´ogica de compostos. Estes podem ser feitos com recurso a modelos de aprendizagem autom´atica e criac¸˜ao de espac¸os m´etricos de distˆancias entre mol´eculas.
Uma patologia para a qual existe grande necessidade de descoberta de novas terapias ´e a Fibrose Qu´ıstica (FQ). FQ ´e a doenc¸a autoss´omica recessiva progressiva com impacto negativo na esperanc¸a m´edia de vida que mais afeta caucasianos. Esta doenc¸a ´e causada por mutac¸˜oes no gene CFTR, que levam `a produc¸˜ao deficiente da prote´ına CFTR, um canal de membrana de transporte de ani˜oes. Geram-se deGeram-sequil´ıbrios i´onicos e de transporte de fluidos, afetando v´arios ´org˜aos, mas mais gravemente os pulm˜oes.
A mutac¸˜ao do gene CFTR mais prevalente e com maior incidˆencia nos doentes com FQ ´e a delec¸˜ao da fenilalanina 508 (F508del-CFTR), gerando uma prote´ına com problemas de conformac¸˜ao, ficando em grande parte retida no ret´ıculo endoplasm´atico. Grande parte dos esforc¸os de descoberta de novos f´armacos s˜ao direcionados a corrigir ou amenizar os efeitos desta mutac¸˜ao.
Este projeto teve como objetivos identificar potenciais novos f´armacos para FQ atrav´es de bases de dados p´ublicas usando m´etodos computacionais e modelos de aprendizagem autom´atica. Ap´os identificac¸˜ao de compostos promissores, testar em laborat´orio atrav´es de ensaios de imunofluorescˆencia de triagem e an´alise de alto rendimento sobre o efeito na F508del-CFTR. Os compostos com melhores resultados neste ensaio seriam validados com Western Blot (WB).
A tarefa inicial foi encontrar um conjunto de dados apropriado e tratar os dados. O ensaio escolhido foi um ensaio biol´ogico funcional de supress˜ao de fluorescˆencia sobre o efeito de pequenos compos-tos na func¸˜ao da F508del-CFTR, dispon´ıvel abertamente na base de dados PubChem com a referˆencia PubChem AID #743267.
As estruturas destes compostos foram recolhidas nas notac¸˜oes digitais simplified molecular-input line-entry system(SMILES) e IUPAC International Chemical Identifier (InChi), acompanhadas de um indicador de atividade (ativo ou inativo) e de um valor num´erico de atividade, baseado na concentrac¸˜ao do f´armaco que induz metade da resposta m´axima (AC50).
A informac¸˜ao das estruturas em SMILES e InChi foi convertida para fingerprints (“impress˜oes digi-tais”) moleculares, em formato Morgan e Atom Pairs (“pares de ´atomos”) em v´arias configurac¸˜oes, em ambiente de programac¸˜ao Python 3. Todos os processos computacionais consequentes foram executados e programados em ambiente R. Para tarefas de previs˜ao de atividade s˜ao usados modelos
dos, isto ´e, o conjunto de dados de treino cont´em a informac¸˜ao a modelar e o resultado obtido. Estes modelos podem ser de classificac¸˜ao, caso apresentem resultados em classes, neste caso, ativo ou inativo, ou de regress˜ao caso apresentem resultados num´ericos, neste caso valores de atividade.
Para validac¸˜ao dos modelos de aprendizagem autom´atica, a sua performance deve ser testada com um conjunto de validac¸˜ao independente (CVI), de modo a que os resultados a prever sejam desconhecidos para os modelos. Esta validac¸˜ao s´o dever´a ser aplicada aos melhores modelos, que ser˜ao avaliados com um processo de validac¸˜ao semelhante chamado de validac¸˜ao cruzada (VC). Em VC, o conjunto de dados de treino ´e repartido em v´arias partes que ser˜ao iterativamente usados para avaliar a performance dos modelos treinados com o somat´orio das restantes partes. Para avaliar a performance dos modelos de classificac¸˜ao foi usada a m´etrica Coeficiente de Correlac¸˜ao de Matthews (CCM) e para os modelos de regress˜ao a ra´ız do erro quadr´atico m´edio (REQM).
O conjunto de dados inicial foi repartido 1/10 para CVI e 9/10 para o conjunto de treino. Os algo-ritmos de aprendizagem autom´atica usados para criar os modelos foram m´aquinas de vetores de suporte (MVS) e Random Forests (RF, “florestas aleat´orias”). As vari´aveis usadas para prever atividade s˜ao cha-madas de preditores. Neste contexto, inicialmente, foram usados como preditores os bits dos fingerprints. O n´umero de preditores usados afeta a performance dos modelos, especialmente MVS. Nem todos os bits tˆem a mesma importˆancia. Para determinar qual a importˆancia de cada preditor foi usada a func¸˜ao de importˆancia do algoritmo de RF para todas as definic¸˜oes de fingerprints usadas. MVS foram escolhidas para abordagem principal de modelagem por obterem melhor performance em avaliac¸˜oes iniciais com selec¸˜ao de preditores.
Foi escolhida uma abordagem de modelac¸˜ao em duas camadas, uma inicial de classificac¸˜ao e uma segunda camada de regress˜ao. O processo de selec¸˜ao dos melhores modelos de classificac¸˜ao passou por escolher quais as melhores definic¸˜oes de Morgan e Atom Pairs fingerprints e qual o n´umero de preditores a usar com MSV. Foram criados modelos para cada definic¸˜ao de fingerprints com um n´umero crescente de preditores. Os modelos que se destacaram foram 1024 bits with raio = 2, no interval entre 50 e 250 preditores, 1024 bits com raio = 3 no intervalo entre 50 e 500, 2048 bits e raio = e 2048 bits com raio = 3 no intervalo entre 50 e 500 preditores.
Foi criado um espac¸o m´etrico de distˆancias entre compostos baseado nas distˆancias de Tanimoto. Es-tas distˆancias foram calculadas com base nos Morgan Fingerprints. Foi aplicada a t´ecnica de reduc¸˜ao de dimensionalidade de An´alise de Coordenadas Principais, e as duas primeiras coordenadas principais fo-ram projetadas num espac¸o m´etrico de duas dimens˜oes com base em classificac¸˜ao. N˜ao houve separac¸˜ao clara entre ativos e inativos para nenhuma das definic¸˜oes. Foram tamb´em usadas as distˆancias como pre-ditores em modelos de MSV de RF. Estes modelos apresentaram uma performance inferior aos modelos com Morgan Fingerprints como preditores.
Para selecionar os melhores modelos de regress˜ao com MSV apenas foram usados os compostos ativos para treino e validac¸˜ao. Os restantes processos foram an´alogos aos da escolha dos modelos de classificac¸˜ao. Foi escolhido o modelo com Morgan Fingerprints em 1024 bits com raio = 2. Os melhores modelos foram validados e usados para fazer triagem dos compostos mais promissores na base de dados ZINC15, juntamente com outros passos de filtragem. 28 compostos foram selecionados para validac¸˜ao experimental.
O primeiro ensaio experimental consistiu numa triagem de alto rendimento de imunofluorescˆencia 11
com microscopia automatizada. 3 concentrac¸˜oes de cada composto, juntamente com os moduladores conhecidos de F508del-CFTR VX-661, VX-809 e VX-770, foram aplicadas a c´elulas CFBE expressando F508del-CFTR acoplada com mCherry (uma prote´ına fluorescente) e FLAG-tag (antig´enio). Foi medida a CFTR total expressa nas c´elulas atrav´es da fluorescˆencia caracter´ıstica da mCherry e a fluorescˆencia na membrana plasm´atica (MP) atrav´es da ligac¸˜ao de anticorpos prim´arios ao FLAG-tag e consequente ligac¸˜ao de anticorpos secund´arios com fluorescˆencia.
Os resultados foram obtidos automaticamente com o software CellProfiler e analisados com o script ShinyHTM. Foi aplicada uma correc¸˜ao de gradiente de fluorescˆencia por placa. Os tratamentos mais promissores foram selecionados com base na mediana dos testes-Z do r´acio entre a fluorescˆencia da CFTR na MP e a fluorescˆencia de CFTR total, sendo uma medida de eficiˆencia de tr´afego de F508del-CFTR comparativamente ao controlo.
10 tratamentos candidatos foram selecionados para validac¸˜ao com WB, juntamente com os modu-ladores VX-661 e VX-809 para avaliar o Processamento de CFTR, a quantidade de CFTR maturada e CFTR total. Neste ensaio todos os compostos apresentaram aumento de CFTR total comparativamente ao controlo e aos VX-661 e -809, dos quais o C14 com significˆancia. Os compostos C07, C14 e C25 apresentaram um aumento significativo na quantidade de CFTR maturada. O composto C17 embora n˜ao tenha obtido significˆancia estat´ıstica, apresentou aumento de CFTR total no WB em duas concentrac¸˜oes diferentes sendo por isso tamb´em considerado promissor.
Uma an´alise posterior foi feita aos resultados de fluorescˆencia de CFTR total e de CFTR na MP, confirmando a existˆencia de compostos com aumento promissor e significativo nestas m´etricas. Como conclus˜ao, foi criada uma metodologia de descoberta de novos f´armacos para FQ. Foram selecionados 4 compostos como especialmente promissores.
Contents
List of Figures 20
List of Tables 23
1 Introduction 1
1.1 Motivation . . . 1
1.2 Background and State of the Art . . . 1
1.2.1 Drug discovery and development . . . 1
1.2.2 Chemoinformatics and Machine Learning . . . 2
1.2.3 Cystic Fibrosis . . . 3
1.3 Objectives . . . 4
1.3.1 Specific Aims . . . 5
2 Materials and Methods 7 2.1 Overview of Tasks . . . 7
2.2 Choosing Dataset . . . 8
2.3 Data treatment, Processing and Creating Final Datasets . . . 9
2.4 Creating and Evaluating the Machine Learning Models . . . 11
2.5 Screening and Choosing Candidate Drugs . . . 13
2.6 Compound Screening with Immunofluorescence F508del-CFTR Traffic Assay . . . 14
2.6.1 CFTR Constructs and Cell Line Generation . . . 14
2.6.2 Cell Culture . . . 15
2.6.3 Preparation of the screening compounds . . . 15
2.6.4 Seeding, Induction of CFTR expression and Adding the Compounds . . . 15
2.6.5 Immunostaining . . . 16
2.6.6 Image Acquisition . . . 16
2.6.7 Image Analysis . . . 16
2.7 Western Blot Immunocytochemistry Assay . . . 18
2.7.1 CFTR Constructs and Cell Line Generation . . . 18
2.7.2 Cell Culture, Seeding and Adding the Compounds . . . 18
2.7.3 Sample Extraction, Quantification and SDS-PAGE . . . 19
2.7.4 Immunostaining . . . 19
2.7.5 Imaging . . . 19 15
3 Results and Discussion 21
3.1 Machine Learning Models – Determining Optimal Number of Predictors . . . 21
3.2 Choosing the Best Models and Architecture . . . 22
3.3 Classification - Choosing Best Setting for SVM with Morgan Fingerprints . . . 23
3.4 Creating a Chemical Metric Space and using Molecular Distances to Predict Activity . . 26
3.5 Regression - Choosing Best Models . . . 28
3.6 Validation of the Most Promising Models . . . 30
3.7 Screening the ZINC15 Database . . . 30
3.8 Compound Screening with Immunofluorescence F508del-CFTR Traffic Assay . . . 32
3.9 Western Blot Assay . . . 40
3.10 Revisiting the Immunofluorescence Assay . . . 43
4 Conclusions 45
5 Perspectives 47
Glossary and Abbreviations 49
Bibliography 56
Supplementary Figures 58
Supplementary Tables 65
Annex A 67
List of Figures
2.1 Overview of the project design. . . 7
2.2 Density Plot of the Activity Scores of the Molecules in the Assay “Broad Institute Identification of Small Molecule Correctors of the Cystic Fibrosis Transmembrane Conductance Regulator (CFTR) Delta508 Mutation Function in Human Bronchial Epithelial Cells. Probe Project”. . . 9
2.3 Overview of the Dataset Creation Process and Their Usage on the Machine Learn-ing Tasks. . . 10
2.4 Overview of Experimental Design of Immunofluorescence Assay. . . 14
2.5 Double Tagged CFTR variant. . . 15
2.6 Quality Control with shinyHTM. . . 17
2.7 Overview of experimental design of Western Blot assay. . . 18
3.1 Comparison of algorithms for determining predictor importance. . . 22
3.2 Initial Comparison of RF and SVM. . . 23
3.3 Scoring SVM Classification Models Using Molecular Fingerprints as Predictors. . . 24
3.4 Projected Distances of the Molecules of the Dataset in a 2-Dimensional Plane. . . 26
3.5 Comparison of RF and SVM in Distances Models. . . 27
3.6 Scoring SVM Regression Models Using Molecular Fingerprints as Predictors. . . . 29
3.7 Immunostaining characterization under microscopy of the CFBE cell lines express-ing mCherry-Flag-F508del-CFTR and automated image analysis usexpress-ing CellProfiler software. . . 32
3.8 Total and Final Cell Count. . . 33
3.9 Ratio of Fluorescence Between PM and Total Fluorescence by Plate. . . 34
3.10 Ratio of Fluorescence Between PM and Total Fluorescence by Plate after Median Polish Normalization. . . 35
3.11 Extensive Scores of Ratio of Fluorescence Between PM and Total CFTR in F508del-CFTR Immunofluorescence Assay. . . 36
3.12 Z-scores of Fluorescence Ratio Between Plasma Membrane and Total Fluorescence by Treatment. . . 37
3.13 Hits from the Compound Screening Assay with CFBE cells Expressing the mCherry-Flag-F508del-CFTR. . . 38
3.14 Representative Image of Western Blot of Drug Candidate Compounds. . . 41
3.15 Quantification of Western Blot results. . . 42 19
3.16 Z-scores of Total CFTR Fluorescence, PM CFTR Fluorescence and Ratio Between Plasma Membrane and Total Fluorescence by Treatment. . . 44 S1 Layout of Preparation of Stock Solutions, Intermediate Dilutions and of Each
Treat-ment on the 96-well Plates of the Immunofluorescence assay for Recovery of F508del-CFTR. . . 58 S2 Fluorescence Gradient Obtained from Median 5x5 Normalization. . . 59 S3 Detailed Overview of Experimental Design of Preparation of Stock Solutions,
Dilu-tions and Media composition for Induction of CFTR Expression in the Presence of Drug Candidate Compounds. . . 60 S4 Presence of color in Preparations of Stock and Intermediated Solutions of Screening
Compounds. . . 61 S5 Total Cell Count by Well in 96-well Plates. . . 62 S6 Final Cell Count by Well in 96-well Plates. . . 63 S7 Extensive Z-Scores of Ratio of Fluorescence Between PM and Total CFTR, of Total
and of PM Fluorescence in F508del-CFTR Immunofluorescence Assay. . . 64
List of Tables
3.1 Validation of the Best Models. . . 30 S1 First Part of Summary of Results of the Ratio of Fluorescence Between PM and
Total Fluorescence of the Assay for Recovery of F508del-CFTR. . . 65 S2 Second Part of Summary of Results of the Ratio of Fluorescence Between PM and
Total Fluorescence of the Assay for Recovery of F508del-CFTR. . . 66
Section 1
Introduction
1.1
Motivation
There is a clinical need to identify new candidate drugs for cystic fibrosis (CF). Even though a significant amount of data is available on this subject there is a still a lack of sufficiently efficient treatments or robust methodologies to discover or design them. These approaches should be fast and efficient, and a possible methodology is to use machine learning models on datasets of previously made assays regarding substances with potential for enhancing Cl-transport through CFTR.
The field of computational prediction of biological activity of molecules, also called quantitative structure–activity relationship (QSAR), is rapidly evolving and showing great promise and accuracy in drug discovery. There are no reports of QSAR pipelines or workflows being previously done in the context of CF. This project was developed to create and apply a Machine Learning-based workflow for discovery of candidate drugs for CF with experimental validation of their effect.
1.2
Background and State of the Art
1.2.1 Drug discovery and development
It is believed that the use of drugs for medicinal purposes started with prehistoric people, with the use of naturally occurring substances that were collected from living organisms, such as plants, animals, algae, fungi. Only in the late 17th century, theorizing in medicine started to be replaced with observation and experimentation of the effects of drugs in study of disease. Advances in chemistry and physiology in the late 18th century, 19th and early 20th century laid the foundation needed for isolating and identifying the active compounds and understanding how drugs work at organ and tissue levels (Katzung, 2018). It was only in the 1960’s, with the advances in the understand of the functioning of receptors, ion channels and enzymes, that the process of drug discovery started to be more scientific and rational (Takenaka, 2008). The previous therapeutic claims started to be accurately evaluated, with the emergence of crucial concepts of rational therapeutics such as the controlled clinical trial (Katzung, 2018).
Many of the currently available drugs have been discovered through classical pharmacology (also called forward pharmacology), in which compound libraries are created and tested on cell cultures to look for phenotypical changes, and in later stages tested in animals (Hacker et al., 2009). A more recent approach, usually called reverse pharmacology, consists in testing these compound libraries directly against purified target proteins and to look for conformational changes on these proteins (Hacker et al.,
Section 1. Introduction 2
2009; Takenaka, 2008). The more promising compounds are then tested in cell cultures and later with animal testing. This latter approach is more common nowadays, being considerably faster, usually takes 2 years, while classical pharmacology takes approximately 5 years (Takenaka, 2008).
After candidate substances are selected, there are also other factors to optimize, such as affinity, potency, stability, bioavailability, forms of administration and whether it efficiently reaches the target, for example, if it crosses the blood brain barrier for central nervous system (CNS) drugs.
In order to solve specific problems in medicine, the drug discovery process requires ever faster and more efficient methods and with less nefarious consequences towards sentient beings. The current trend is to reduce animal suffering through testing, its associated time-consuming protocols and high costs (Rai and Kaushik, 2018).
Nowadays the array of synthesizable compounds available is vast. In order to solve more diffi-cult biological problems, not only is it impractical to test all available compounds in different molec-ular and cellmolec-ular conditions, it is also very costly and time and resource consuming. in vitro High-Throughput Screening (HTS) is an approach with much potential in drug discover and toxicity testing, where concentration-response data can be generated simultaneously for up to thousands of compounds and mixtures (Shockley, 2015). The most common measure for activity in pharmacological and toxicity research is the concentration for half-maximal activity (AC50). It is derived from the Hill equation model
(Hill, 1910) and is widely used to assess approximate estimates for compound potency. AC50 is often
used to prioritize chemicals for further studies and is commonly used as the basis for prediction model-ing (Shockley, 2015). There is however a large uncertainty associated with the AC50parameter in many
concentration-response relationships (Shockley, 2016).
Rational drug design is the process of developing medications using the known information about a molecular target (Katzung, 2018). The most common approaches are through computer-based modeling and relying on the knowledge of the three-dimensional structure of the target. These compounds are usually small molecules or peptides (Hacker et al., 2009).
1.2.2 Chemoinformatics and Machine Learning
Chemoinformatics is the use of computer science and information techniques in the field of chemistry. A common application of chemoinformatics is, for example, to model chemical substances into digi-tal information. This information can be used to perform complex tasks of information retrieval and prediction analysis through machine learning. In recent years, great advancements have been made in computational methods in modelling the biological activity of compounds in an accurate manner.
To work with representations of chemical structure, it is of great importance to choose a nomenclature or notation that easily represents molecules in a clearly defined way. Two widely used such notations using character strings are the Simplified Molecular Input Line Entry System (SMILES) (Weininger, 1988) and the IUPAC International Chemical Identifier (InChI) (Heller et al., 2015).
A commonly used method for modeling chemical molecules is to use molecular fingerprints, which are bit maps that represent chemical structure (Rogers and Hahn, 2010). Morgan fingerprints (also called circular fingerprints) (Morgan, 1965; Rogers and Hahn, 2010) and Atom Pairs fingerprints (Carhart et al., 1985) are two such algorithms, both currently widely used as descriptors of molecular activity producing robust results (Kausar and Falcao, 2019). These fingerprints are saved as text data. Each fingerprint bit
Section 1. Introduction 3
corresponds to a fragment of the molecule and as such, it is safe to assume that molecules that are similar have a lot of bits/fragments in common. Using algorithms and statistic models, computer systems can learn how to improve their performance in a specific task. This method is called machine learning (ML) and requires a training data set, that should represent the data for which the models will be used (Kuhn and Johnson, 2013).
The digitally coded chemical data can be used by ML models to predict the activity of untested compounds. This concept is usually called quantitative structure–activity relationship (QSAR). QSAR applications and are rapidly evolving alongside the rise of large quantities of data from HTS studies in a way that properties and biological activities of novel compounds can be rapidly predicted in silico, with only a fraction of the costs, labor and resources of traditional lab-based approaches (Nantasenamat et al., 2010). Although computational approaches are a great way to discover new drug candidates, it is still required to validate their effect with experimental testing, first with in vitro studies, and in final stages, in vivo.
These advances in drug discovery and compound screening methodologies show great promise in the discovery of new therapies for challenging biological problems (Kausar and Falcao, 2018).
1.2.3 Cystic Fibrosis
One medical condition for which there is still no viable treatment is cystic fibrosis (CF). Although be-ing classified as a rare disease, it is the most common life shortenbe-ing monogenic disease in Caucasians (Bell et al., 2015). Cystic fibrosis is a progressive autosomal recessive disease, caused by mutations in the CFTR gene (Riordan et al., 1989), leading to a defective CFTR protein (cystic fibrosis transmem-brane conductance regulator), a cAMP-regulated Cl-and HCO3-channel located at the apical surface of
epithelial cells (Amaral, 2015).
The hallmark of the disease is disrupted Cl- transport through CFTR across epithelia (Welsh and Smith, 1993). Despite being a disease that affects multiple organs, it primarily affects the lungs, being the typical cause of mortality (Amaral, 2015). Patients suffering from this disease have less cellular permeability to anions, resulting in disturbances in electrolyte and fluid transport. Typical symptoms of these patients are a poor reabsorption of NaCl in the sweat glands (the most common diagnostic test) and abnormalities in lung, pancreas and intestine function, caused by changes in the cells’ membrane potential (Quinton, 1983). The ionic dysregulation leads to dehydration of the surface liquid of the airways, excessive thickening of the mucus and impaired mucociliary clearance. This results in difficulty in clearance of pathogens in the lungs, leading to a cycle of chronic pulmonary obstruction, infection, inflammation and lung damage (Flume et al., 2009; Amaral, 2015).
The most common disease-causing mutation, among the more than 2000 variants already reported (CFTR2.ORG, 2019), is the deletion of three nucleotides resulting in the deletion of phenylalanine residue 508 (Phe508del or F508del). Approximately 85 % of patients with cystic fibrosis have at least one allele for F508del-CFTR (Bell et al., 2015) and approximately 45 % to 70 % of patients with cystic fibrosis are homozygous for this allele (Wainwright et al., 2016; Guggino and Stanton, 2006). When initially described, CF was usually fatal in infancy or early childhood. More recently the median survival from CF has increased dramatically to approximately 40 years, while premature death before 50 years old remains the norm (Guggino and Stanton, 2006; Bell et al., 2015).
Section 1. Introduction 4
Since this mutation is so prevalent, research and drug development efforts are mainly focused on addressing F508del-CFTR. This mutation causes folding and processing defects in CFTR, leading to retention in the endoplasmic reticulum and rapid degradation and thus severely reducing the amount of this protein that correctly locates to the cell’s surface (Mogayzel and Flume, 2010). The few channels that do reach the surface of the epithelium are functionally impaired, since the mutation disrupts the channel’s opening (Wainwright et al., 2016).
One treatment strategy is to increase the amount of matured CFTR at the cell surface. Small molecules that can promote the correct folding of F508del-CFTR are called “correctors” (Mogayzel and Flume, 2010).
There is already FDA/EMA-approved medication to address this mutation, such as Lumacaftor (VX-809) or Tezacaftor (VX-661) combined with Ivacaftor (VX-770) (Lommatzsch and Taylor-Cousar, 2019). Lumacaftor and Tezacaftor aim at correcting the misprocessing and increasing cell surface lo-calized protein. VX-770 is a “potentiator”, which increases the probability of CFTR being open and of reaching the surface of the cell (Wainwright et al., 2016). VX-770, has been shown to potentiate chloride transport by both G551D- and F508del-CFTR proteins in vitro (Mogayzel and Flume, 2010). While alone it is debatable if these agents have meaningful effects on F508del-CFTR in vivo, when combined there is a small improvement of approximately 3 % in lung function and while it does not dramatically improve symptoms, it does seem to have clinical significance in some cases (Deeks, 2016). It is suggested that a combination of agents is necessary for full correction of F508del-CFTR (Farinha et al., 2013), and recently, combinations of three agents (new modulators combined with Tezacaftor and Ivacaftor) are also being considered for clinical use (Taylor-Cousar et al., 2019).
HTS initiatives have proven that F508del-CFTR correctors are much more difficult to identify than potentiators (Farinha et al., 2015). Having these issues in mind, the main focus in drug development for cystic fibrosis is in finding correctors, this is, getting the channels to locate to their correct location.
Parallel to the medication therapies, a primary therapy for patients with CF has been the clearance of airway secretions, through a variety of clearance therapies. However, these are intrusive and require considerable time and effort (Flume et al., 2009).
1.3
Objectives
The main aim of this project was to identify new candidate drugs for cystic fibrosis, using machine learn-ing and computational methods.
After training, learning, testing and in silico validation, it was expected to perform in vitro validation studies for the most promising candidate drugs for cystic fibrosis. The most promising compounds would be tested in vitro for their effect on F508del-CFTR in a HTS immunofluorescence assay. Based on the results of the immunofluorescence assay, the best scoring compounds would then be validated with a Western Blot (WB).
Section 1. Introduction 5
1.3.1 Specific Aims
• To use Support Vector Machines (SVM) and/or Random Forests ML models to predict activity of commercially available compounds.
• To identify new candidate drugs for CF based on the predictions of the ML models.
• To test their effect on the trafficking levels of F508del-CFTR expressed in human bronchial ep-ithelial cells in several concentrations through HTS with immunofluorescence microscopy. • To identify the most promising compounds in the immunofluorescent assay.
Section 2
Materials and Methods
2.1
Overview of Tasks
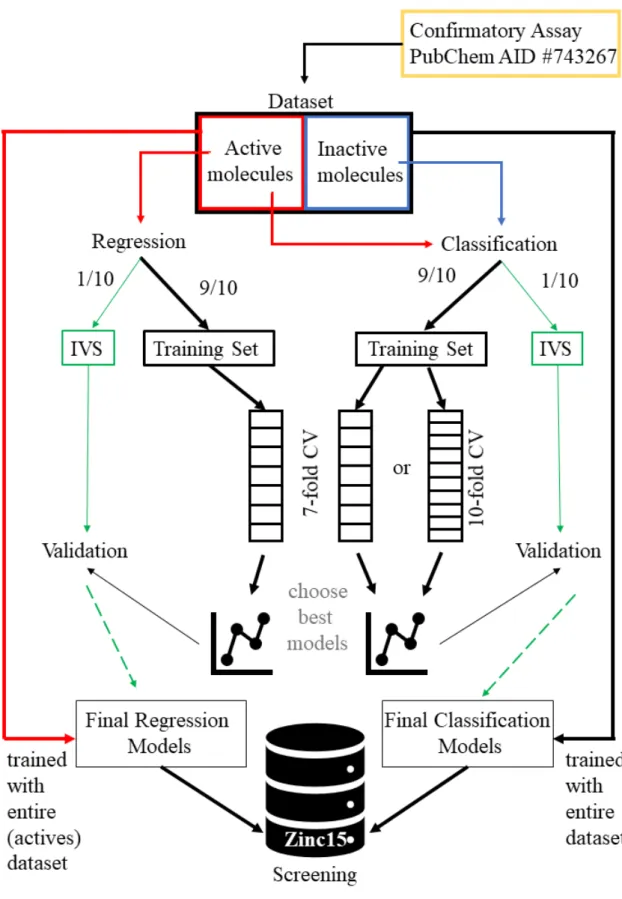
Figure 2.1: Overview of the project design.
(1) Finding and choosing datasets. (2) Data treatment and processing. (3) Creating Final datasets using Molecular fingerprints with bits as predictors and Tanimoto distances as predictors. (4) Creating training and testing partitions. (5) Determining importance of each predictor. (6) Determining optimal number of predictors by training SVM and RF models. (7) Optimizing architecture & and repeat steps 5 and 6. (8) Validating. (9) Screening. (10) Scoring and ranking those substances and order approximately the 30 most promising ones. (11) Testing substances’ effects on CFTR cellular localization through High-throughput Microscopy Immunofluorescence assay in CFBE cells. (12) Testing substances’ effect on F508del-CFTR through Western Blot assay in CFBE cells.
Section 2. Materials and Methods 8
The initial task was to find a suitable CF compound screening assay from which to extract the data to use for modeling. This data was treated and processed into adequate formats in order to build appro-priately structured datasets. The digital chemical structure and properties of the compounds was then created in several formats. These formats were all based in molecular fingerprints, both Morgan Fin-gerprints and Atom Pairs. From the Morgan FinFin-gerprints, another type of dataset was created using Tanimoto molecular distances.
From the entire dataset, the Training Sets and Independent Validation Sets were created through random partitioning. The Training Sets were used in the process of training and choosing the best ML models and settings and architecture.
After the selecting the best models, these were validated with the IVS and used to screen the ZINC15 database, along with other filtering methods and criteria.
The most promising compounds were selected and studied in vitro with an immunofluorescence based HTS and with Western Blotting (WB).
An overview of the main tasks are represented in figure 2.1
2.2
Choosing Dataset
The chosen dataset was obtained from the functional cell-based confirmatory bioassay on defective CFTR correction “Broad Institute Identification of Small Molecule Correctors of the Cystic Fibrosis Transmembrane Conductance Regulator (CFTR) Delta508 Mutation Function in Human Bronchial Ep-ithelial Cells. Probe Project” (The Broad Institute of MIT and Harvard, 2014), publicly available on PubChem (Kim et al., 2018) with the PubChem AID #743267.
As the name indicates, in this assay the effect of small molecules on correcting defective CFTR was studied, in Human Bronchial Epithelial Cells (CFBE). These cells expressed a halide (halogen element such as F, Cl, I, Br) sensitive YFP, a yellow fluorescent protein whose fluorescence is quenched (de-creased fluorescence intensity) in the presence of sodium iodide (NaI). It was expected that compounds restoring F508del-CFTR function would allow mutated CFTR channels to be expressed at the cell sur-face resulting in an enhanced anion transport and subsequent fluorescent quenching ability of the CFBE cells.
The measurement used to determine the active concentration (AC) was the AC50, which estimates
the concentration at which a chemical produces the half-maximal response along a sigmoidal curve (Shockley, 2016). Compounds reducing the fluorescence with AC50lower than 5µM were considered as
active.
pAC was set to equal 1*log10(AC). The assay Score is calculated by formula 2.1,
Score = 10 ∗ pAC (2.1)
and as such, the Scores relate to AC in the following manner; 120 = 1 pM, 90 = 1 nM, 60 = 1 µM, 30 = 1 mM and 0 = 1 M. The assay then attributed to the aggregation of individual tests, an outcome of Active if all tests were Active, Inactive when all tests were Inactive or Inconclusive if there were mixed test results. If the outcome was considered Inactive or Inconclusive, the Score was set to 0.
Section 2. Materials and Methods 9
Figure 2.2: Density Plot of the Activity Scores of the Molecules in the Assay “Broad Institute Identification of Small Molecule Correctors of the Cystic Fibrosis Trans-membrane Conductance Regulator (CFTR) Delta508 Mu-tation Function in Human Bronchial Epithelial Cells. Probe Project”.
Vertical lines just above the x axis represent the activity scores of molecules in the assay. All Inactive molecules had a Score of 0 and the Active molecules between 42 and 76.
All the data from the initial dataset that was not relevant for this project was removed, such as inconclusive re-sults and redundant assay score data, and a new dataset was created contain-ing only the PubChem Substance ID (SID), activity outcome (active or inac-tive), activity score (a numerical value), the SMILES and InChI.
From the total 1700 molecules, af-ter excluding 6 molecules classified as inconclusive, the final dataset contained 605 molecules classified as active and 559 as inactive, a final number of 1164 molecules. The activity values varied between 0 and 76, being that all inac-tive molecules were given a score of 0. A density plot of the distribution of the data points can be seen in figure 2.2. It can be observed that there is a big density of data points with a score of 0, the inactive molecules and the ac-tive molecules are distributed between 42 and 76.
2.3
Data treatment, Processing and Creating Final Datasets
For an overview representation of the following procedures, see figure 2.3.
The chemical structure of the compounds was obtained in SMILES and InChi. SMILES is a line no-tation for encoding molecular structures in a human readable way. A possible problem of using SMILES is that there are several ways to represent the same molecules. An approach to this problem is the use of algorithms that canonize SMILES (Weininger et al., 1989), this is, that produce SMILES that are unique for each structure. InChI was designed to encode molecular information in a standard and unique way that can be read by humans. The InChI format and algorithms are nonproprietary and free to use and can be computed from structural information. InChI also express more information than SMILES, such as stereochemistry and electronic charge information. The InChIkey is a 27-character representation of the InChI that is not human-readable, however it can facilitate computation and web-searched because it is usually much smaller.
The chemical structure in SMILES or InChI was converted to molecular fingerprints to use as pre-dictors and assess molecular distances in the following computational procedures.
Section 2. Materials and Methods 10
Figure 2.3: Overview of the Dataset Creation Process and Their Usage on the Machine Learning Tasks.
Data was obtained from PubChem and treated. The whole treated dataset was used for classification and for the regression models only the active molecules were used. Data was split 9/10 for training and 1/10 for Independent Validation Set (IVS). 7-fold or 10-fold Cross Validation was used to score the models. The best models were validated with the IVS and after validation were trained with the entirety of the treated dataset (only the active molecules for the regression models) and used to screen ZINC15 database of commercially available compounds.
Section 2. Materials and Methods 11
Two approaches to making molecular fingerprints were used, Morgan Fingerprints and Atom Pair Fingerprints. The Morgan Molecular Fingerprints were made through a custom script in Python 3 envi-ronment, using the RDKit package (Landrum, 2006). For each substance, a Morgan Molecular Finger-print was made in the settings 128 bits and radius 2, 128 bits and radius 3, 256 bits and radius 2, 256 bits and radius 3, 512 bits and radius 2, 512 bits and radius 3, 1024 bits radius 2, 1024 bits radius 3, 2048 bits radius 2 and 2048 bits radius 3. Atom Pairs fingerprints were made for each substance through a custom script in Python 3 environment using the RDKit package, 4415 bits both in binary and standard form, and also in 985 bits by using the knime software (Berthold et al., 2007).R
The following procedures were all made in R 3.4.3 environment. In order to have an independent validation process, the molecules used to validate the models were previously separated into an inde-pendent validation set (IVS). The remaining molecules formed the Training Set, the molecules used to train and score the models. The dataset was randomly split in a 1:10 ratio, between IVS and training set. This process was repeat using only the active models, to create a Training Set and IVS for the regression models (fig 2.3). The IVS was only used after the best models were chosen for validation.
2.4
Creating and Evaluating the Machine Learning Models
Machine learning (ML) can be supervised, if the training data contains both the input and the desired output or unsupervised, where data has only inputs and the models are used only to structure the data. Supervised learning can be used for either classification or regression tasks. In classification the output is discreet or in classes, for example classifying molecules as “Active” or “Inactive”. In regression the outputs are continuous, for example values of binding affinity in Ki or numerical values of functional activity in a fluorescence assay.
For validation of the models, their performance should be tested with an IVS, data for which the inputs and outputs are known but wasn’t used in the training of the models. In order to score the models’ performance on the training procedures, a common method is to cross-validate (CV) the training data. CV works by creating several partitions of the training data and iterate through each as the validation set, while the remaining partitions are used to train the model with the same parameters. This approach mimicks the use of an IVS for scoring how they perform.
There are many machine learning methods and algorithms. Two of the more widely used and versa-tile algorithms are Support Vector Machines (SVM) and Random Forests, both supervised methods for classification or regression tasks.
Support Vector Machines work by representing the data as points is a space of n-dimensions and map them in a way that examples of different categories or range of values are separated by a clear gap, that is as wide as possible. New examples are then predicted to belong to a certain category or to have a certain value based on where they are mapped in the model (Cortes and Vapnik, 1995).
Random forests operate by constructing a multitude of decision trees at training. Decision trees are a combination of mathematical and computational techniques for description, categorization and generalization of a given set of data. Random Forests are a type of aggregated decision trees, where multiple decision trees are built with random selection of features, by repeatedly re-sampling the training data with replacement and voting and scoring the trees for a consensus prediction (Gama et al., 2012).
Section 2. Materials and Methods 12
ML models were created using the svm package and the randomForest package in R. The importance of each predictor (the bits of the fingerprints) was estimated through the mean decrease in accuracy parameter of the randomForest function of the randomForest package in R. 7-fold cross-validation was made for estimating the optimal number of predictors to include in each machine learning model for each fingerprint setting in the models using Morgan Fingerprints as predictors and 10-CV was used for the models with distances.
The main score used to evaluate the classification machine learning models was the Mathews Corre-lation Coefficient (MCC) using the classification of the predictions as true positives (TP), true negatives (TN), false positives (FP) and false negatives (FN) (formula 2.2).
M CC = (T P × T N − F P × F N )
p((T P + F P ) × (T P + F N) × (T N + F P ) × (T N + F N)) (2.2) For training and testing the regression models, only the active molecules were used. The main score used to evaluate the regression machine learning models was the root-mean-square error (RMSE) (formula 2.3). RM SE = v u u t 1 n n X i=1 (obs − pred)2 (2.3)
For the models that used molecular distances as predictors, the distances were calculated through the Jaccard/Tanimoto Coefficient (formula 2.4), which is a measure of the similarity between finite sample sets (in this case, the bits of the molecular fingerprints). The distances were calculated between all molecules.
DistanceA−B = 1 − SimilarityA−B = 1 −
|A ∩ B|
|A ∪ B| = 1 −
|A ∩ B|
|A| + |B| − |A ∩ B| (2.4) To create a metric space with projected distances, multidimensional scaling (Gower, 1966) was per-formed by Principal Coordinates Analysis (PCoA) using the cmdscale function in R. The same trans-formations were made for all the molecules not present in the training set, in order to project them into the same metric space. This was done by calculating the linear projection (T), that can transform the distance matrix (D) into the projected space (P), according to formula 2.5.
D × T = P => D−1× D × T = D−1× P => T = D−1× P (2.5) This transformation was done by applying the Moore-Penrose Inverse on the distance matrix of the Training Set with the ginv() function from the MASS package.
Section 2. Materials and Methods 13
2.5
Screening and Choosing Candidate Drugs
A screening dataset was created by obtaining the entirety of the in-stock commercially available com-pounds in the ZINC15 database (Sterling and Irwin, 2015) in SMILES format and converting to Morgan Fingerprints in 1024 bits with radius = 2 and = 3 and 2048 bits with radius = 2 and = 3 using the RDKit (Landrum, 2006) package in Python 3 programming environment.
A kriging-based filtering step was applied as described next. The molecular similarity between all molecules in the screening dataset and the initial dataset was calculated according to formula 2.4, with Morgan Fingerprints in 1024 bits and radius = 3. For each molecule in the screening dataset, the 20 most similar molecules in the initial dataset were gathered and used to train a RF classification model. The screening compound would then be classified and kept for further consideration if predicted Active. If all these 20 molecules from the initial dataset were Inactive, the screened compound would be automatically classified as inactive, and inversely, if all 20 molecules were active, the screened compound would be classified as Active.
Machine learning models using the SVM algorithm were created with the svm package in R pro-gramming environment. The settings used to create the classification models were Morgan Fingerprints as predictors in 1024 bits with radius = 2 and 132 predictors, 1024 bits with radius = 3 and 236 pre-dictors, 2048 bits with radius = 2 and 226 predictors and molecular distance as predictors using Morgan Fingerprints in 1024 bits and radius = 3 and 65 predictors and 2048 bits and radius = 3 with 89 predictors. For the training of these classification models the entirety of the initial dataset after treatment was used. The combination of these 5 classification models was used to score the screening compounds according to the sum of the Active predictions (0 to 5). Compounds scoring less than 4 were excluded.
An SVM regression model was created using Morgan Fingerprints as predictors with 1024 bits and radius = 2 with 210 predictors. The entirety of the Active molecules in the initial dataset after treatment was used to train this model. Molecules scoring more than 48 were kept for further consideration.
The remaining screening compounds were individually studied in ZINC15 and ChEMBL (Gaulton et al., 2016) for the presence of pan-assay interference compounds (PAINS) (Baell and Walters, 2014), Lipinski’s rule of 5 (RO5) (Lipinski, 2004). Compounds with PAINS associated structures and with more than 1 RO5 violation were excluded.
Section 2. Materials and Methods 14
2.6
Compound Screening with Immunofluorescence F508del-CFTR
Traf-fic Assay
Figure 2.4: Overview of Experimental Design of Immunoflu-orescence Assay.
General pipeline of the immunofluorescence assay is described. Cells were cultured, seeded, and after 24h, F508del-CFTR ex-pression was induced and the compounds were added. 48h af-ter, the cells were immunostained and the plates were imaged. Main stock solutions, dilutions and media composition are described, along with the antibodies and cell stains used. DMEM -Dulbecco’s modified Eagle’s medium; FBS - fetal bovine serum; PFA – paraformaldehyde.
This assay is based on the quan-tification of the amount of CFTR that reaches the plasma membrane through quantification of immunoflu-orescence. This assay was based on the work described in Botelho et al. (2015). A general overview of this experiment is described in figure 2.4.
2.6.1 CFTR Constructs and Cell Line Generation
Cystic Fibrosis Bronchial Epithe-lial cells (CFBE 41o- cells, fur-ther referred to as CFBE) were used (Ehrhardt et al., 2006). These im-mortalized cells were developed from bronchial epithelial cells from an F508del-CFTR homozygous CF pa-tient and allowed the development of other types of cells used on this work. For the immunofluorescence assay, the CFBE cells used were geneti-cally engineered to express a double tagged CFTR construct: an mCherry-F508del-CFTR fusion molecule con-taining a Flag tag insertion (Fig. 2.5). This cell line has no expression of wt-CFTR which enables the assumption that all CFTR that localizes to the PM is F508del-CFTR. The CFTR traffic
reporter construct had been previously built as described by Almac¸a et al. (2011), by fusing mCherry to the N-terminus of F508del-CFTR via a small linker (QISSSSFEFCSRRYRGPT). A Flag tag sequence was also inserted in the fourth extracellular loop of CFTR, between Asn901 and Ser902 (Fig.2.5). These CFBE cells were stably transduced with lentivirus encoding the previously described constructs under the regulation of a Tet-ON promoter (generated by ADV Bioscience LLC, Birmingham, AL, USA). The use of a Tet-ON promoter allows for an inducible expression of the construct upon addition of doxycycline in the culture medium.
Section 2. Materials and Methods 15
2.6.2 Cell Culture
Figure 2.5: Double Tagged CFTR vari-ant.
Representation of the F508del-CFTR construct contained in the used CFBE cell line, tagged with mCherry and Flag tag. The Flag tag resides in the fourth extracel-lular loop and only becomes extracelextracel-lular if the protein successfully traffics to the membrane. Figure adapted from Amaral et al. (2016).
CFBE with mCherry-Flag-F508delCFTR were cultured in Dulbecco’s modified Eagle’s medium (DMEM) high glucose (Gibco #41965) supplemented with 10 % (v/v) heat inacti-vated fetal bovine serum (FBS) (Gibco #10106), 10 µg/mL blasticidin (Invivogen #ant-bl) and 2.5 µg/mL puromycin (Sigma-Aldrich #P8833) at 37oC and 5 % CO2. Uncoated 10 cm plastic petri dishes were used.
2.6.3 Preparation of the screening compounds All the screening compounds are mostly non-polar and for this reason had to be solubilized in DMSO. Stock solutions of the screening compounds were prepared in DMSO in a 10 mM concentration. The stock solutions were placed in a 96-well polypropylene plate (Supplementary Figure S1-A) to facilitate pipetting with a Xplorer multichannel pipetteR
(Eppendorf #4861000112, #4861000139, #4861000155).
2.6.4 Seeding, Induction of CFTR expression and Adding the Compounds
CFBE cell line with mCherry-Flag-F508delCFTR were cultured to confluence and split 24h before the experiment. On the following day, the cells were trypsinized to antibiotic-free DMEM supplemented with 10 % (v/v) of FBS. 100µl of medium containing approximately 10000 cells in suspension were seeded on each well of a 96-well microscopy plate using a Multidrop Combi Reagent Dispenser (Thermo ScientificTM #5840300).
24h after seeding the screening compounds were added and CFTR expression was simultaneously induced (through addition of doxycycline). The medium was prepared by supplementing DMEM with 0.1 % FBS and 1 µg/mL doxycycline (Sigma #9891). Each of the 28 screening compounds were sep-arately solubilized in the previously described medium to a 0.1, 1 and 10 µM concentration. 3 other compounds for which there is described activity in CFTR studies were also prepared. VX-661 at a 5 µM concentration, 3 µM VX-809 and 3µM VX-770.
For consistency of results, all wells should have the same concentration of DMSO. The treatments with 10 µM concentration contained 0.1% (v/v) of DMSO, the highest value for all preparations. For this reason, the appropriate amount of DMSO was added to each treatment preparation with a concentration of compound lower than 10 µM, to increase the amount to 0.1 % (v/v) of DMSO. DMEM with 0.1 % FBS, 1 µg/mL doxycycline and 0.1 % (v/v) DMSO was prepared as control treatment.
The detailed design and description of the procedure is described in Supplementary Figure S3. The medium in the cells was removed and the medium with the compounds and DMSO only control was added using a multichannel pipette. The layout of each treatment can is detailed in Supplementary Figure S1-C.
Section 2. Materials and Methods 16
2.6.5 Immunostaining
48h after adding the compounds and inducing F508del-CFTR expression (72h after seeding), extracellu-lar Flag-tags were immunostained in non-permeabilized cells. The present media was aspirated, and the cells were washed once with ice-cold phosphate buffered saline (PBS) and incubated with monoclonal anti-Flag antibody (2 µg/mL Sigma-Aldrich #F1804) for 1h at 4oC.
Cells were then washed 3 times with ice cold PBS, incubated for 20 min with 3 % (w/v) paraformalde-hyde (PFA) on ice. The remaining procedures were done at room temperature. Cells were washed 3 times with PBS and afterwards incubated with anti-mouse Alexa Fluor c 647 conjugated secondary antibody (2 µg/mL Molecular Probes #A31571). Cells were then washed 3 times with PBS and incubated with a Hoechst 33342 solution (200 ng/mL, Sigma #B2261) for 1h. The cells were washed 3 times for a last time with PBS and left immersed in PBS. The plates were kept at 4oC overnight until imaging.
All previous solutions were prepared immediately before use in PBS supplemented with 0.7 mM CaCl2 and 1.1 mM MgCl2. Antibody solutions contained 1 % bovine serum albumin (BSA, Sigma-Aldrich #A9056). All manipulations of solutions on the plates were performed using a HydroSpeedTM plate washer (Tecan #INSTHS-02). Solution volumes were 30 µl/well for antibodies and 50 µl/well for PFA and Hoechst.
2.6.6 Image Acquisition
Imaging was made using an automated inverted widefield epifluorescence microscope for high-throughput screening at room temperature. The microscope used was a DMI6000 B (Leica) equipped with a mercury metal halide light source (EL6000), with an Orca-Flash4.0 camera (Hammamatsu) with 16 bit 2048 x 2048 pixel resolution, 6.5 µm x 6.5 µm pixel size and a HC PL APO objective (Leica) with a numerical aperture of 0.4. The Hoechst channel was used for contrast-based autofocus. Imaging was made on 96-well plates, in 5 positions per well.
2.6.7 Image Analysis
The quantification of CFTR was made by assessing the amount of CFTR localized to the PM and the amount of total CFTR in the cell, as previously described by Botelho et al. (2015). PM CFTR is propor-tional to the Alexa Fluor c 647 integrated fluorescence and total CFTR is proportional to the mCherry integrated fluorescence. By dividing the PM CFTR with the Total CFTR, a measurement of CFTR traffic efficiency is obtained (formula 2.6).
CFTR traffic efficiency = T otal CF T RP M CF T R = AlexaFluor cmCherry integrated f luorescence 647 integrated fluorescence (2.6) Automatic image analysis was performed using the CellProfiler open source software (Kamentsky et al., 2011) and the shinyHTM custom script (Botelho et al., 2019) in R programming environment. Ini-tially the cells with an undesired phenotype were excluded, by determining a minimum and a maximum radius for cell nucleus and abnormal nuclear shapes (e.g. apoptotic cells).
A flat-field/dark-frame background correction was performed. Initially images with background flu-orescence and illumination were taken with the same microscope and image acquisition setup. These (flat-field and dark-frame) images were used for correcting the illumination and subtracting the fluores-cence baseline for each image.
Section 2. Materials and Methods 17
Figure 2.6: Quality Control with shinyHTM.
(A) Image quality and focus. Measure used was powerloglogSlope of nucleus images. Points with values under -2.5 were excluded. Note that no higher limit was chosen, all excluded points in the region with values superior to -1.25 belong to plate 2. (B) Intensity of plasma membrane fluorescence (PM intensity) by plate. Measure used was median of cell final integrated intensity of PM with background correction. Points with values under 0 were excluded. Note that no higher limit was chosen, still all outlier data points with positive values were excluded by other criteria.
Another QC filter included a maximum number of saturated pixels. For each image, the CFTR traffic efficiency was considered to be the median CFTR traffic efficiency for all cells in the image. After imaging the 5 image fields for each condition in 5 replicates, shinyHTM was used analyze the data and to exclude images based on QC filters (Fig. 2.6).
Out of focus images were excluded based on the value of the PowerLogLogSlope, the slope of the image log-log power spectrum. According to CellProfiler’s resources, the power spectrum contains the frequency information of the image. The slope gives a measure of image blur, with higher slopes indicating more lower frequency components, and hence more blur, being a metric recommended for blur detection in most cases. Images with a PowerLogLogSlope <-2.5 were excluded (Fig. 2.6-A).
Also excluded were images not reaching a minimum of 20 identified cells (not shown) and not reach-ing a minimum level of PM CFTR fluorescence of 0 (Fig. 2.6-B).
Fluorescence gradient was corrected on a plate by plate basis, using the median polish methodology in shinyHTM. Median polish can be used as a normalization by utilizing the medians from the rows and the columns of a 2-way table to calculate the row effect and column effect on the data. The overall effect is calculated by finding the row medians for each row and calculating the median of the row medians. This is followed by a subtraction of the row median to each element in that row for all rows. The overall effect is then subtracted to each row median. The same procedure is then done for the columns, and the overall effect of the columns is added to the previous overall effect. These steps are repeated until the change within row or column medians is negligible.
Section 2. Materials and Methods 18
treatment, the effect of each treatment was compared with the DMSO control using a Z-score (formula 2.7):
Z − Score = (M ean, i − M ean, ctrl)
SDctl (2.7)
2.7
Western Blot Immunocytochemistry Assay
Figure 2.7: Overview of experimental design of Western Blot assay.
Stock solutions, dilutions and media composition for induction of CFTR expression in the presence of compound.
This assay is based on the quantifi-cation of the amount of total CFTR and F508del-CFTR that is properly folded by the action of a correc-tor (the drug candidate compounds) as detected after electrophoresis and transfer by an anti-CFTR specific an-tibody. The quantification is made by chemiluminescence. CFBE cells are used, which express either wt- or F508del-CFTR. An overview of this experiment is represented in figure 2.7.
2.7.1 CFTR Constructs and Cell Line Generation
CFBE cells stably overexpressing wt-CFTR or F508del-CFTR (CFBE wt-CFTR or CFBE F508del-CFTR) were used.
2.7.2 Cell Culture, Seeding and Adding the Compounds CFBE cells were cultured in EMEM
supplemented with 10 % (v/v) FBS and 2.5µg/mL of puromycin (Sigma-Aldrich #P8833) at 37oC and 5 % CO2. Cells were trypsinized and approxi-mately 200,000 cells were seeded into each well of 6-well plates in 2 mL of EMEM supple-mented with 10 % (v/v) FBS and 2.5 µg/mL of puromycin. 24h after seeding the screening compounds were prepared in antibiotic-free EMEM supplemented with 0.1 % (v/v) FBS and added to the cells. The compounds and concentrations prepared were 3 µM VX-809, 5 µM VX-661, 10 µM C7, 0.1 µM C8, 10 µM C14, C16 in 1 µM and in 10 µM, C17 in 0.1 µM and in 1 µM, 10 µM C18, 0.1 µM C24 and 1 µM C25. Similarly to what was done in the immunofluorescence assay, all wells had the same concentration of DMSO, for consistency of results. EMEM with 0.1 % FBS and 0.1 % (v/v) DMSO was prepared as control treatment, both for wt-CFTR CFBE and F508del-CFTR CFBE.
Section 2. Materials and Methods 19
2.7.3 Sample Extraction, Quantification and SDS-PAGE
A detailed description of this protocol, including reagents, equipment and techniques is in Annex A. SDS-PAGE (sodium dodecyl sulfate–polyacrylamide gel electrophoresis) gels were made by stacking a 4 % (v/v) acrylamide for separation above a 7 % (v/v) acrylamide for resolving the protein samples. 48h after adding the screening compounds, the cells were washed 2 times with ice-cold PBS and lysed using a sample extraction buffer (SB, see Annex A), collected to tubes and kept on ice during the following procedures. Quantification of protein in the samples was assessed with a Bradford Assay (see Annex A). The loading samples were prepared with the same amount of protein in all samples for replicate (ideally more than 10 µg) and 1:4 (v/v) of loading buffer (see Annex A). Each gel was loaded with DMSO (wt-and F508del-CFTR) (wt-and VX661 (wt-and VX809 controls. Approximately 50 µL of sample were loaded onto the SDS-PAGE gel. The gels ran at 60-75V to concentrate the samples and separated with 100-120V, on ice. The content of the gels was transferred to PVDF (Polyvinylidene fluoride or polyvinylidene difluoride) membranes at 400 mA for 1h30min on ice.
2.7.4 Immunostaining
Membranes were blocked in 5 % (w/v) Non-fat-milk (powder) PBS-T for 30 min at room temperature. Membranes were then incubated with anti-CFTR 596 mouse primary antibody (1:3000 (v/v), Cystic Fi-brosis Foundation Therapeutics, Bethesda, MD; USA, #A4) and with Calnexin mouse primary antibody (1:3000 (v/v), BD Transduction LaboratoriesTM#610523)(as loading control) in 5 % (w/v) Non-fat-milk (powder) PBS-T overnight at 4oC. After primary antibody incubation the membrane was washed 3 times for 10 min with PBS-T with agitation. The membrane was then incubated with Goat Anti-Mouse IgG (H + L)-HRP Conjugate secondary antibody (1:3000 (v/v), Bio-Rad #1706516) in 5 % (w/v) Non-fat-milk (powder) PBS-T for 1h at room temperature. The membrane was washed 3 times for 10 min with PBS-T with agitation and kept on PBS-T at 4oC.
2.7.5 Imaging
Signal was developed with the Immun-StarTMWesternCTMChemiluminescence Kit (Bio-Rad #1705070). Detection was performed with the Chemidoc XRS+ system (Bio-Rad). Quantification was performed us-ing the ImageLabTMsoftware (Bio-Rad).
Section 3
Results and Discussion
3.1
Machine Learning Models – Determining Optimal Number of
Predic-tors
In this machine learning context, the predictors (sometimes called features or attributes), the variables used to predict biological activity values, are the array of bits of the fingerprints. The number of predic-tors used affects the performance of the machine learning models (Carhart et al., 1985). Also important to note, is that not all predictors have the same importance for predicting a molecules activity. Parallel to what happens in vivo and in vitro, not all parts of a molecule have the same importance in exerting a certain activity or reaction. In machine learning modeling, this is called feature selection (Kuhn and Johnson, 2013). In most cases, some of the bits have variance = 0 for the entire dataset, offering no information for the modelling and being an added computational cost and in the same logic as before, reducing the accuracy of the machine learning models, and as such, should be removed.
The first approach to this part of the modeling was to choose a good and not exceedingly time-consuming algorithm to determine importance of predictors. The algorithms tested were the importance function within the randomForest function of the randomForest package, the varImp function from the Caret package (Kuhn, 2008) using both Random Forests and SVM models, and recursive feature elimi-nation (RFE) with the rfe function of the caret package. RFE works by using a Random Forest algorithm on each iteration to evaluate the modeling in a way that explores all possible subsets of the attributes. These algorithms were tested on several different fingerprint settings on the dataset. A representation of their performance on 128 bits and 2 radius Morgan Fingerprints is on fig 3.1.
randomForest, varImp with RF and RFE all performed similarly, and markedly better than varImp with SVM. A control with the predictors with a random order of importance was used (Scrambled). By comparing the importance prediction algorithms with the scrambled control, it can be clearly seen how choosing an optimal number of predictors enables a more accurate prediction from the SVM models, while all the scores converge to the same values when the number of predictors approaches the complete set of bits of the fingerprints.
A similar performance was reported for all fingerprint settings. randomForest was chosen based on being the fastest algorithm and because of its familiarity, know reliability and good performance from previous studies within this research group (Teixeira et al., 2013). RFE is also a fast algorithm that per-formed remarkably but its use requires that the user be familiarized with Caret’s particular methodology and use of functions, which could be an obstacle for future users of this methodology.
Section 3. Results and Discussion 22
Figure 3.1: Comparison of algorithms for determining predictor importance.
Models were constructed with SVM using Morgan Fingerprints with 128 bits and radius = 2. For each algorithm of determining predictor importance, models were created with all possible numbers of predic-tors (variables). Models were scored with the MCC metric, with 7-CVx2. Scrambled order of predicpredic-tors was used as control.
3.2
Choosing the Best Models and Architecture
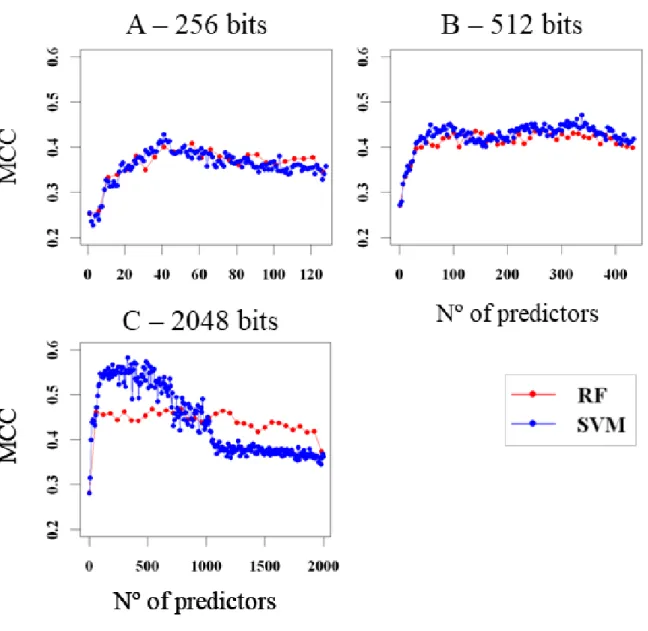
The two machine learning algorithms chosen to use were SVM and RF. Initial tests using a smaller dataset for predicting biological activity of small molecules on the Sigma1 receptor, using Morgan Fingerprints, indicated that while RF performed better without predictor selection, SVM with selection of number of predictors based on performance had better and more consistent results. It is also noteworthy that SVM are considerably faster than RF. Having these preliminary results in mind, the focus of this work was on mainly using SVM, while still testing the performance of RF on instances where it seemed appropriate. After choosing the algorithm for determining predictor importance, models were constructed for each fingerprint setting. An overall preliminary look comparing SVM against RF showed again that SVM seemed to perform better than RF when selecting an optimal number of predictors, which is especially noticeable in settings with higher number of bits (fig 3.2).
The initial approach to this project was to make regression machine learning models to predict ac-tivity for the entire dataset. This approach was proven to be flawed due to the nature of the dataset. The inactive molecules all had a score of 0, and the active molecules showed scores between 42 and 76 (fig 2.2). This is a big gap of data for a regression model that predicts activity based on continuous values.
Section 3. Results and Discussion 23
Figure 3.2: Initial Comparison of RF and SVM.
Models were constructed using Morgan Fingerprints with radius = 2, with 128 bits (A), 256 bits (B) and 2048 bits (C). Models were scored with the MCC metric, with 7-CVx2.
These models had unsatisfactory scores with a minimum RMSE of approximately 20. To address this issue, it was chosen to create a 2-layer model with a first layer consisting of one or several classification models and a second layer with a regression model to predict quantitative activity for only the molecules classified as active.
3.3
Classification - Choosing Best Setting for SVM with Morgan
Finger-prints
Two types of molecular fingerprints were chosen as the most promising to model the chemical structure, Morgan Fingerprints and Atom Pairs. Atom Pairs can be created under two types of configurations, binary or “standard”.
Section 3. Results and Discussion 24
Figure 3.3: Scoring SVM Classification Models Using Molecular Fingerprints as Predictors. SVM was used to create the models and MCC was used as score metric. For each fingerprint setting, the importance of the predictors was estimated, and the models were trained with increasing numbers of predictors.
vectors by attributing a particular bit to a simple attribute, like a structure or feature (Carhart et al., 1985). If this attribute is absent in the structure, it will be coded as an off-bit, which is a 0, and if it is present it will be registered as an on-bit. An on-bit in binary is always a 1, while in “standard” Atom Pairs it can be any positive integer value, usually corresponding to the amount of times that feature is