The Global Climate in
2011–2015
WEA
THER CLIMA
TE W
A
WMO, in collaboration with Members, began issuing annual statements on the status of the global climate in 1993. This publication was issued in collaboration with the African Centre of Meteorological Applications for Development (ACMAD), Niger; European Centre for Medium-Range Weather Forecasts (ECMWF), United Kingdom of Great Britain and Northern Ireland; Japan Meteorological Agency (JMA); Met Office Hadley Centre, United Kingdom; Climatic Research Unit (CRU) at the University of East Anglia, United Kingdom; Climate Prediction Center (CPC), the National Centers for Environmental Information (NCEI) and the National Hurricane Center (NHC) of the National Oceanic and Atmospheric Administration (NOAA), United States of America; National Aeronautics and Space Administration, Goddard Institute for Space Studies (NASA GISS), United States; Global Precipitation Climatology Centre (GPCC), Deutscher Wetterdienst, Germany; National Snow and Ice Data Center (NSIDC), United States; Commonwealth Scientific and Industrial Research Organization (CSIRO) Marine and Atmospheric Research, Australia; Global Snow Lab, Rutgers University, United States; International Research Centre on El Niño (CIIFEN), Ecuador; Royal Netherlands Meteorological Institute (KNMI), Netherlands; Institute on Global Climate and Ecology (IGCE), Russian Federation; All-Russian Research Institute for Hydrometeorological Information – World Data Center (ARIHMI-WDC), Russian Federation; Bulletin of the American Meteorological Society, annual State of the Climate reports; Centre for Research on the Epidemiology of Disasters (CRED), Université catholique de Louvain, Belgium; World Glacier Monitoring Service, University of Zurich, Switzerland; Joint Typhoon Warning Center (JTWC), Honolulu, United States; National Institute for Space Research (INPE), Brazil; Niger Basin Authority, Niamey; Intergovernmental Authority on Development (IGAD) Climate Prediction and Applications Centre (ICPAC), Nairobi; WMO Regional Climate Centres in Europe, Asia (Tokyo Climate Center), southern and western South America, and eastern and northern Africa; WMO Global Atmosphere Watch and Global Cryosphere Watch programmes; World Food Programme (WFP); United Nations Environment Programme (UNEP); and Office of the High Commissioner for Refugees (UNHCR). Other contributors are the National Meteorological and Hydrological Services or equivalent of: Algeria; Antigua and Barbuda; Argentina; Armenia; Australia; Austria; Azerbaijan; Barbados; Belarus; Belgium; Bosnia and Herzegovina; Brazil; Bulgaria; Burkina Faso; Canada; Chile; China; Colombia; Croatia; Cuba; Cyprus; Czechia; Denmark (including Greenland); Dominican Republic; Egypt; Estonia; Ethiopia; Fiji; Finland; France (including French Pacific, Caribbean and Indian Ocean territories); Germany; Haiti; Hong Kong, China; Hungary; Iceland; India; Indonesia; Iran, Islamic Republic of; Ireland; Israel; Italy; Jamaica; Japan; Jordan; Kenya; Libya; Lithuania; Luxembourg; Madagascar; Malawi; Malaysia; Mali; Mauritius; Mexico; Montenegro; Morocco; Netherlands; New Zealand; Niger; Norway; Pakistan; Panama; Papua New Guinea; Paraguay; Peru; Philippines; Poland; Qatar; Republic of Korea; Republic of Moldova; Russian Federation; Saint Lucia; Senegal; Serbia; Seychelles; Singapore; Slovakia; Slovenia; South Africa; Spain; Sudan; Sweden; Switzerland; Thailand; Turkey; Ukraine; United Kingdom; United Republic of Tanzania; United States; Uruguay; and Vanuatu.
The right of publication in print, electronic and any other form and in any language is reserved by WMO. Short extracts from WMO publications may be reproduced without authorization, provided that the complete source is clearly indicated. Editorial correspondence and requests to publish, reproduce or translate this publication in part or in whole should be addressed to:
Chairperson, Publications Board
World Meteorological Organization (WMO)
7 bis, avenue de la Paix Tel.: +41 (0) 22 730 84 03
P.O. Box 2300 Fax: +41 (0) 22 730 80 40
CH-1211 Geneva 2, Switzerland E-mail: [email protected]
ISBN 978-92-63-11179-1
NOTE
The designations employed in WMO publications and the presentation of material in this publication do not imply the expression of any opinion what-soever on the part of WMO concerning the legal status of any country, territory, city or area, or of its authorities, or concerning the delimitation of its frontiers or boundaries.
The mention of specific companies or products does not imply that they are endorsed or recommended by WMO in preference to others of a similar nature which are not mentioned or advertised.
The findings, interpretations and conclusions expressed in WMO publications with named authors are those of the authors alone and do not neces-sarily reflect those of WMO or its Members.
Cover illustration: Mykola Mazuryk (Adobe Stock)
WMO-No. 1179
Contents
Foreword 3
Executive summary 5
Key findings 6
The world’s warmest five-year period on record . . . 6
Concentration of long-lived greenhouse gases continues to increase . . . 8
Widespread melting of ice except in the Southern Ocean . . . 9
Sea levels continue to rise . . . .11
Precipitation . . . .12
Large-scale modes of climate variability . . . .16
Major extreme events of the period 2011–2015 . . . .16
Heatwaves a regular occurrence . . . .18
Despite overall warmth, some periods of significant cold and snow . . . .19
Destructive flooding in many parts of the world . . . .20
Prolonged droughts affected several continents . . . .21
Tropical cyclones . . . .23
Damaging tornadoes and windstorms . . . .25
Anthropogenic climate change contributed to some extreme events . . . .25
Excess deaths
attributed to drought
and famine in
2011–2012 in the
Horn of Africa
2011–2015
Warmest five-year period
on record
Probability that
climate change
affected occurrence of
many extremes
Deaths in Philippines attributed to
Typhoon
Haiyan (Yolanda
), 2013
Economic losses attributed to
Hurricane
Sandy
, 2012
Record minimum
Arctic sea-ice extent in 2012
3.39
million km
2>250 000
>4 100
>7 800
Deaths attibuted to heatwaves in
X10
EXTREME
EVENTS
Foreword
This report describes the evolution of the cli-mate system during the period 2011–2015. The World Meteorological Organization (WMO) has assessed this five-year period in order to contribute to a better understanding of multi-year warming trends and extreme events that can help governments to implement the United Nations Framework Convention on Climate Change more effectively. This applies in par-ticular to the 2015 Paris Agreement, which provides a historic opportunity for the global community to act with greater urgency in curbing greenhouse gas emissions, fostering climate resilience and mainstreaming climate adaptation into national development policies.
W h i l e t h e P a r i s A g r e e m e n t e n g a g e s governments in pursuing efforts to limit the global temperature increase to 1.5 °C above pre-industrial levels, this report confirms that the average temperature in 2015 had already risen by more than one degree (with 2016 on track to be even warmer) since the pre-industrial period. The report also confirms that the period 2011–2015 was the warmest five-year period on record, consistent with established long-term warming trends due to rising levels of greenhouse gases. In addition, it notes that many individual extreme weather and climate events recorded during 2011–2015 had their likelihood of occurring substantially enhanced by human-induced climate change. This evidence of climate change demonstrates the importance of taking immediate action under the Paris Agreement.
An advantage of a medium-term perspective is that it makes it possible to take into account multi-year events such as prolonged droughts and recurrent heatwaves. This time frame also enables scientists and decision-makers to more rigorously assess the validity of mid- and long-term projections of anthropogenic climate change through the persistence of extreme phenomena.
This five-year report expands on the approach taken by WMO since 1993 in consolidating the best available climate information from
National Meteorological and Hydrological Services into yearly statements on the status of the global climate. In 2013, WMO issued a decadal climate summary covering the period 2001–2010. Since 2006, WMO has also produced annual Greenhouse Gas Bulletins that report on atmospheric concentrations of the greenhouse gases that drive climate change.
The early effects of climate change have been consistently visible on the global scale since the 1980s: the increase of the global temperature, both over land and in the surface and deep ocean; sea-level rise; and the widespread melting of ice (with the interesting exception of the Southern Ocean). In addition, the influence of climate change on the daily lives of people has been clear due to the multiplication and intensification of extreme events, including heatwaves to record rainfall and damaging floods.
The WMO multi-year repor ts and annual statements on the state of the climate com-plement the assessments reports of the WMO/ United Nations Environment Programme Intergovernmental Panel on Climate Change (IPCC). They aim to inform governments, inter-national agencies and other WMO partners on a more frequent basis about global climate trends and extreme weather and climate events at the national and regional levels.
We believe that this report, together with those to follow, will help to strengthen the scien-tific foundation for implementing the Paris Agreement and adjusting national policies as needed to reflect changing climate conditions.
Executive summary
The five-year period from 2011 to 2015 has been the warmest five-year period on record globally, with 2015 being the warmest year on record to date.1 The period 2011–2015 was also the
warmest on record for every continent except Africa. During this period, concentrations of the major greenhouse gases continued to rise and reached record levels for the instrumental period.
The record high temperatures from 2011 to 2015, along with the annual record set in 2015, are consistent with established long-term warm-ing trends, the dominant cause of which is the emission of anthropogenic greenhouse gases. Year-to-year temperature fluctuations occur against the backdrop of the long-term warming trend, in particular as a result of El Niño and La Niña events. High temperatures have been accompanied by the continuation of long-term trends in other indicators that are consistent with warming, such as rising sea levels and declines in Arctic sea-ice extent and in continental glaciers and ice sheets in Arctic and high-mountain regions.
The single most significant event of the period in humanitarian terms was the 2011–2012 famine in the Horn of Africa, to which drought in late 2010 and 2011 was a major contributor. More than 250 000 excess deaths in the Horn of Africa were attributed to this event by the Famine Early Warning Systems Network. On shorter timescales, no single climate-related disaster in the period 2011–2015 was associated with short-term casualties on the scale of some of the worst events of the previous decade, such as the 2003 European heatwave and Cyclone
Nargis in Myanmar in 2008. However, many of the worst disasters of the period 2011–2015 still involved extreme weather and climate. Three tropical cyclones – including one implicated in the period’s worst single meteorological disaster, Typhoon Haiyan (Yolanda) – were each associ-ated with over 1 000 deaths in the Philippines.2
1 At the time of writing, it is likely that the 2015 record high annual
temperature will be exceeded in 2016.
2 Unless otherwise stated, casualty figures in this publication
are sourced from the EM-DAT Emergency Events Database maintained by the Centre for Research on the Epidemiology of Disasters at the Université catholique de Louvain, Belgium.
Casualties were on a comparable scale in India and Pakistan due to flooding in 2013 and heat-waves in 2015. The South-East Asian flooding of 2011 and Hurricane Sandy in the Caribbean (espe-cially Haiti) and the United States of America in 2012 both resulted in economic losses in excess of US$ 40 billion.3
Scientific assessments have found that many ex treme events in the period 2011–2015, especially those involving ex treme high temperatures, have had their probabilities sub-stantially increased, by a factor of 10 or more in some cases, as a result of anthropogenic climate change. More than half the events assessed scientifically manifested some degree of anthro-pogenic climate change signal. In addition, there have been longer-term events that have not yet been the subject of formal attribution studies but that are consistent with projections of near- and long-term climate change. These include, for example, increased incidence of multi-year drought in the subtropics, as mani-fested during the period in the southern United States, parts of southern Australia and, towards the end of the period, southern Africa. There also have been events, such as the unusually prolonged, intense and hot dry seasons in the Amazon basin of Brazil, in both 2014 and 2015 (especially the latter). While they cannot yet be stated with confidence to be part of a long-term trend, these are of considerable concern in the context of potential “tipping points” in the climate system as identified by the IPCC Fifth Assessment Report.
The present assessment describes the state of the key components of the climate system in the period 2011–2015.4 It focuses on events such as
multi-year droughts that require a longer-term perspective than is possible in an annual report.
3 Economic loss estimates for this event are from the World Bank
for the South-East Asian flooding in 2011, and from the National Oceanic and Atmospheric Administration National Centers for Environmental Information (NOAA NCEI) for Hurricane Sandy.
4 Some information is also included from events in late 2010 that
THE WORLD’S WARMEST FIVE-YEAR
PERIOD ON RECORD
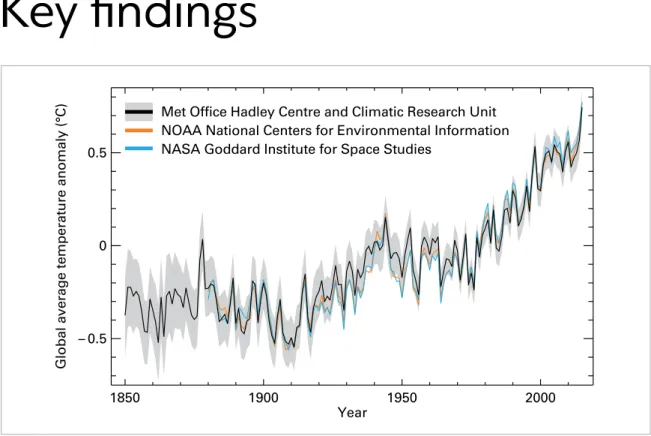
The period 2011–2015 was the warmest five-year period5 on record globally. Using the mean of
three major global datasets,6 temperatures for
the period were 0.57 °C (1.03 °F) above the aver-age for the standard 1961–1990 reference period. This compares with the period 2006–2010, in
5 For the purposes of this report, five-year periods are defined
as those five-year periods ending in a year ending in 5 or 0, for example, 2011–2015, 2006–2010, 2001–2005. However, global temperatures for 2011–2015 are higher than those of any other five-year period whether or not such a restriction is applied. The next highest unrestricted five-year average is 0.54 °C above the 1961–1990 average, set in 2010–2014.
6 Global temperature anomalies are computed using three global
datasets: HadCRUT4.4, jointly produced by the Met Office Hadley Centre and the Climatic Research Unit at the University of East Anglia, United Kingdom; the GISTEMP analysis (2016 version), produced by the National Aeronautics and Space Administration Goddard Institute for Space Studies (NASA GISS); and the NOA A Merged Land Ocean Global Surface Temperature Analysis Dataset (version 4.0), produced by NCEI. Continental temperature anomalies use NOAA data only, while national and sub-national anomalies use data supplied by the relevant National Meteorological or Hydrological Service unless otherwise stated.
Figure 1. Global annual average temperature anomalies (relative to 1961–1990) for 1850– 2015. The black line and grey shading are from the HadCRUT4 analysis produced by the Met Office Hadley Centre in collaboration with the Climatic Research Unit at the University of East Anglia. The grey shading indicates the 95% confidence interval of the estimates. The orange line is the NOAAGlobalTemp dataset produced by NCEI. The blue line is the GISTEMP dataset produced by NASA GISS.
(Source: Met Office Hadley Centre, United Kingdom, and Climatic Research Unit,
University of East Anglia, United Kingdom)
1850 1900 1950 2000
Year – 0.5
0 0.5
Global average temperature anomaly (°C)
Met Office Hadley Centre and Climatic Research Unit NOAA National Centers for Environmental Information NASA Goddard Institute for Space Studies
Key findings
which temperatures were 0.51 °C (0.92 °F) above average, and is consistent with a continued sustained warming trend that has been apparent in global data since the mid-1970s.
The warmest year on record to date was 2015, during which temperatures were 0.76 °C (1.37 °F) above the 1961–1990 average. The year 2015 was also the first year in which global temperatures were more than 1 °C above the pre-industrial average.7 The second-warmest
year was 2014, which was 0.61 °C (1.10 °F) above the 1961–1990 average, while 2013 ranks as the equal-fifth warmest year. Substantially influenced by La Niña events (especially the former), 2011 and 2012 were somewhat less warm but still warmer than any year prior to 1998, and warmer than any previous La Niña year. The world’s 12 warmest years have all occurred since 1998, 9 of them since 2005. While the high temperatures in 2015 were influenced by the El Niño event that developed during that year, the impact of El Niño on global temperatures is typically stronger in the second year of the event than in the first. Thus, the
7 A number of definitions are used by various sources for
primary impact of the 2015–2016 El Niño on annual global temperatures is expected to be in 2016 rather than 2015.8
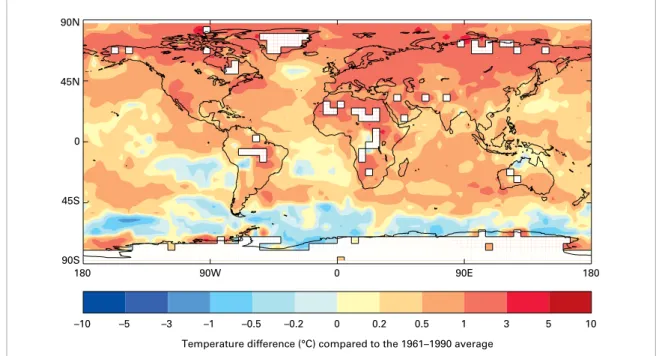
Warmth was widespread around the world throughout the period, both on land and in the ocean. Temperatures for the period 2011–2015 were more than 1 °C above the 1961–1990 aver-age over most of Europe, the Asian part of the Russian Federation and most remaining areas north of 60 °N, reaching 3 °C above aver-age locally on the Arctic coast of the Russian Federation. They were also more than 1 °C above average over much of the Saharan and Arabian regions, parts of Southern Africa, the south-west United States and north-south-west Mexico, and in interior Brazil. No large land areas were consistently cool through the five-year period, although some experienced individual cool years, for example, northern Australia in 2011 and 2012, central North America in 2013 and 2014, and central Asia and Alaska in 2012.
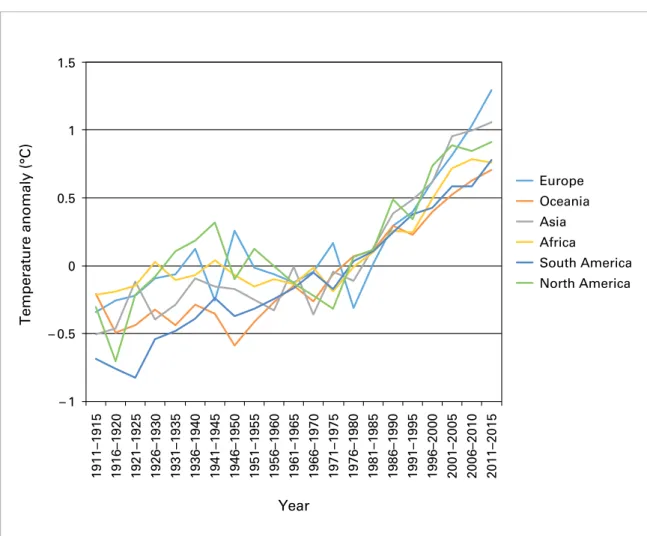
It was the warmest five-year period on record for Europe, South America, Asia, Oceania and North America, where record warm conditions
8 Mean temperatures for January–July 2016 were 0.91 °C (1.64 °F)
above the 1961–1990 average and 0.15 °C (0.27 °F) above the 2015 annual anomaly.
in the west offset near-average temperatures in parts of the east, and ranked second for Africa. The temperatures in Europe for that same period were 1.29 °C above the 1961–1990 average, 0.26 °C warmer than any previous five-year period. South America and Asia experienced their warmest year on record in 2015, Europe in 2014 and Oceania in 2013. Notable seasonal anomalies included the warmest spring on record for North America (2012) and Europe, South America and Oceania (all 2014); the hot-test summer on record for North America (2012), South America and Oceania (both 2015 and 2016); the warmest autumn and winter on record for South America (both 2015); the warmest autumn on record for North America (2015); and the warmest June–August and September– November on record for Africa (2015).
A particularly noteworthy feature of the period 2011–2015 was the occurrence of individual years in which records were set by large margins in substantial land areas. Previously existing records for annual mean temperatures were broken by between 0.17 °C and 0.40 °C in the continental United States in 2012, Australia in 2013, Europe in 2014 and South America in 2015.
Global ocean temperatures were also at unprec-edented levels. Globally averaged sea-surface temperatures for 2015 were the highest on
Figure 2. Global five-year average temperature anomalies (relative to 1961–1990) for 2011– 2015. The analysis uses HadCRUT4 analysis produced by the Met Office Hadley Centre in collaboration with the Climatic Research Unit at the University of East Anglia, United Kindgdom.
180 90W 0 90E 180
90S 45S 0 45N 90N
–10 –5 –3 –1 –0.5 –0.2 0 0.2 0.5 1 3 5 10
record for a calendar year, with 2014 in sec-ond place. Sea-surface temperatures for the period were above average in most of the world, although they were below average in parts of the Southern Ocean and the eastern South Pacific. Areas where 2011–2015 was the warmest five-year period on record include most of the South Indian Ocean, the Southern Ocean south of Australia, the central and eastern North Pacific, the western equatorial Pacific, most of the western half of the North Atlantic north of the tropics, parts of the subtropical western South Atlantic, and the Mediterranean Sea.
Two notable ocean temperature anomalies developed from late 2013 onward: a large area of very warm water in the eastern North Pacific, with sea-surface temperatures more than 2 °C above average in places, and a persistent pool of below-normal sea-surface temperatures in the eastern North Atlantic between the British Isles and the southern tip of Greenland.
CONCENTRATION OF LONG-LIVED
GREENHOUSE GASES CONTINUES
TO INCREASE
The concentration of major long-lived green-house gases in the atmosphere continued to increase during the period 2011–2015.
In 2015, the annual mean9 concentrations in the
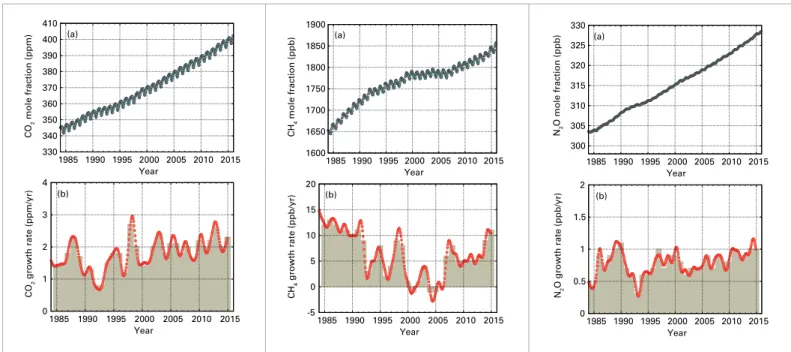
atmosphere of carbon dioxide (CO2), methane (CH4) and nitrous oxide (N2O) were, 400.0 parts per million (ppm), 1 845 parts per billion (ppb) and 328.0 ppb, respectively (CO2 is responsible for about 65% of the total radiative forcing from
9 These concentrations are averaged through the whole year and
across all suitable stations reporting as part of the WMO Global Atmosphere Watch. The annual cycle of CO2 is approximately 6-ppm magnitude, with concentrations at the seasonal peak in April and May typically about 3 ppm higher than the annual mean.
Figure 3. Average temperature anomalies in the six continental regions
(Source: Data used are
from NOAA NCEI)
– 0.5
– 1 0 1.5
1
0.5
Temperature anomaly (°C)
Europe Oceania Asia Africa
South America North America
1911–1915 1916–1920 1921–1925 1926–1930 1931–1935 1936–1940 1941–1945 1946–1950 1951–1955 1956–1960 1961–1965 1966–1970 1971–1975 1976–1980 1981–1985 1986–1990 1991–1995 1996–2000 2001–2005 2006–2010 2011–2015
long-lived greenhouse gases, CH4 for about 17% and N2O for 6%).
These concentrations increased consistently throughout the period from 2011 onward, with annual rates of increase ranging between 1.9 and 2.9 ppm per year between 2011 and 2015 for CO2, between 5 and 9 ppb per year for CH4 and about 1 ppb for N2O. The rate of increase of CO2 concentrations increased in 2015 and reached 2.3 ppm per year, while CH4 (11 ppb per year) showed its strongest annual growth since 1998. The growth rates observed for CO2 and N2O from 2011 to 2015 are slightly higher than the 1995–2015 average, while those for CH4 reflect a renewed period of growth following a period of little change in CH4 concentrations from 1999 to 2006.
The 2015 Greenhouse Gas Bulletin shows that approximately 4 4% of the total CO2 emitted by human activity from 2004 to 2015 remained in the atmosphere, with the remain-ing 56% removed by oceans and the terrestrial biosphere.
WIDESPREAD MELTING OF ICE
EXCEPT IN THE SOUTHERN OCEAN
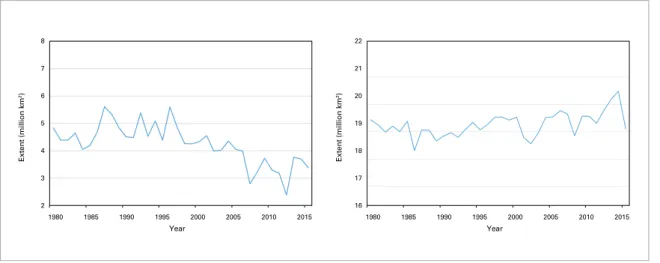
Arctic sea ice continued its decline in the period 2011–2015. The minimum summer sea-ice extent of 3.39 million km2 in 2012 was the lowest on
record. The summer sea-ice extent for 2011 was the third lowest and for 2015 the fourth lowest for the post-1979 satellite record. The mean Arctic sea-ice extent in September, normally the month with the smallest sea-ice extent, in the period 2011–2015 was 4.70 million km2,
28% below the 1981–2010 average and lower than the previous lowest five-year average of 5.04 million km2 in 2006–2010. Arctic sea ice
has not been declining as rapidly in winter as it has in summer, but nevertheless the lowest winter maximum on record, 14.54 million km2,
was in 2015. The winter maximum extents were below the 1981–2010 mean in all five years from 2011 to 2015.
By contrast, for much of the period 2011– 2015, the Antarctic sea-ice extent was above the 1981–2010 mean value, particularly for the winter maximum. In September 2014, the sea-ice ex tent in the Southern Ocean reached 20.16 million km2, 1.45 million km2
above the 1981–2010 average and the high-est value in the satellite record. The 2013 and 2012 maxima ranked second and third, respectively. However, an abnormally slow winter freeze-up in 2015 resulted in sea-ice extent returning to near-average levels by spring 2015, with the 2015 maximum (in early October) of 18.83 million km2, only 0.7% above
the 1981–2010 average. The observed long-term increase in Antarctic sea ice since 1979
Figure 4. Globally-averaged mole fractions (a measure of concentration) of CO2 in parts per million (left), CH4 in parts per billion (middle) and N2O in parts per billion (right); the period 1985–2015 is shown on the top row with growth rates on the bottom row; annually averaged growth rates shown as columns in the bottom row of plots 0
0.5 1 1.5 2
1985 1990 1995 2000 2005 2010 2015 Year
N2
O growth rate (ppb/yr)
(b) 1600 Year CH 4
mole fraction (ppb)
(a) -5 0 5 Y ( 4 ! " Year 0 1 2 3 4
#$ %& #$$ ' #$ $& )''' )'' & )'#' )'#&
* + 2 , -. / 0 1 -2 0 3 4 5 5 6 7 8 -9 : ;< 300 => ? =@> =@ ? =A> =A? = =>
@ BC ? @BB> @ B B? A> >> A>>? A> @> A>@? Year
N2
O mole fraction (ppb)
(a) 330 340 DE F DGF DHF DIF DJF KFF
LJIE L JJF LJ JE MFF F MF FE MFLF MFLE Year
(a)
CO
2
Figure 5. Difference from the 1981–2010 average number of melt days in 2015, 2014, 2013 and 2012 on the Greenland Ice Sheet; data from the MEaSUREs Greenland Surface Melt Daily 25km EASE-Grid 2.0 dataset (Source: National Snow and Ice Data Center/ Thomas Mote, University of Georgia, United States)
is the subject of continuing research, with stratospheric ozone depletion and resultant changes in the atmospheric circulation around the Antarctic considered among possible con-tributing factors.
Summer surface melting of the Greenland ice sheet continued at above-average levels, with the summer melt extent exceeding the 1981–2010 average in all five years from 2011 to 2015. In addition to its record low sea-ice extent, 2012 had clearly the most extensive Greenland surface melting of any year in the satellite record, with melting observed over approximately 90% of the ice sheet. Ice-core records from the Summit station suggest that 2012 was the first significant melting event at that location since 1889. Melting over more than half (52%) of the ice sheet’s area occurred in 2015. The other years in the period were less extreme, with melting focused on the edges
of the ice sheet. Uncertainties are large in the assessments of the state of the Antarctic ice sheet. A number of different studies, using various instruments and methodologies, have all concluded that net ice loss is continuing to occur in West Antarctica, but results are less consistent for East Antarctica.
Mountain glaciers also continued their decline in the period 2011–2015. Mass balance data from the World Glacier Monitoring Service indicate mean losses from the reference gla-ciers of between 600 and 1 200 mm of water equivalent in each of the years from 2011 to 2015,10 a rate of loss which is typical for the
post-2000 period. There was also a warming of temperatures at 20-metre depth in Arctic regions with permafrost. The strongest warm-ing was generally in the coldest regions, while in most regions with observations there was an increase in the thickness of the permafrost active layer.
Northern hemisphere snow cover extent anom-alies showed strong seasonal differences, but overall mean extent in the period 2011–2015 was close to the 1981–2010 average. Snow cover extent was well below average in all five years of the period in all months from May to August, continuing a strong downward trend in those months. New record lows for June and July were set in 2012, which was also notable for extensive melting of sea and land ice in the Arctic, as noted above. The large negative anomalies in these months, partic-ularly in May and June, reflect consistently earlier-than-normal melting of the snow cover in Arctic and sub-Arctic regions of Siberia, Canada and Alaska, as well as reduced summer snow cover at high elevations in western Canada, Tibet and the Himalayas. By contrast, snow cover in the northern hemisphere autumn was generally well above normal, including a record high November extent in 2014, which largely reflected an abnormally cold November in the central and eastern United States. Winter and early spring snow cover extent showed large interannual variability, but five-year averages were close to normal. The largest seasonal anomaly occurred in the 2012/2013 winter,
10 Data for 2015 are provisional at the time of writing.
when snow cover extent was well above normal through the winter, including a record high extent for December.
SEA LEVELS CONTINUE TO RISE
As the oceans warm, they expand, resulting in both global and regional sea-level rise. Increased ocean heat content accounts for about 40% of the observed global sea-level increase over the past 60 years and is expected to make a similar contribution to future sea-level rise. The warming of ocean waters adjacent to the ice sheets can also affect the flow of ice into the ocean, which is another key component of sea-level rise. In 2015, global ocean heat content reached record levels through both the upper 700 m and 2 000 m of the oceans.
Global sea levels continued to rise over the period 2011–2015. The level of interannual variability in global sea level over the period was high by the standards of the satellite era. The period began with global sea level about 10 mm below the long-term trend value in early 2011, due to the strong La Niña at that time, and resultant high rainfall over some land areas resulting in above-normal water storage on land (especially in Australia). Sea levels quickly rebounded as the La Niña ended and had returned to trend or above by mid-2012. There was a further marked rise in early 2015 as an El Niño developed, with sea levels about 10 mm above trend through the second half of 2015. Both the 2010–2011 and 2015 departures from trend were larger than anything observed between 1993 and 2009, including during the
Figure 7. (a) Global mean sea-level change 1993 to July 2016, with annual cycle removed from the data; monthly values shown in pale blue, three-month averages in dark blue and a simple linear trend in red; (b) five-year moving average ocean heat content in the upper 700 m (orange) and 2 000 m (blue) (Sources: (a) Commonwealth Scientific and Industrial Research Organization, Australia; (b) Data from NOAA NCEI Ocean Climate Laboratory, United States, updated from Levitus et al. (2012))
Figure 6. Arctic (left) and Antarctic (right) September 1979–2015 sea-ice extent measured in millions of square kilometres
(Source: Data provided by the National Snow and Ice Data Center, United States) 3 2 5 4 8 7 6
Extent (million km
2)
1980 1985 1990 1995 2000 2005 2010 2015
Year – 30 – 40 0 10 – 20 30 20 – 10 50 40 N O P Q R O S T R U V T R O T W T O X S S Z
Seasonal signal removed
Inverse barometer correction applied
Glacial isostatic ajustement (GIA) correction applied
Monthly
3-month running mean Trend = 3.4 mm/year
Time span: January 1993 -> July 2016
1992 1994 1996 1998 2000 2002 2004 2006 2008 2010 2012 2014 2016
[\]r (a) (b) 17 16 18 22 21 20 19
Extent (million km
2)
1980 1985 1990 1995 2000 2005 2010 2015
^_`a
5–year average
1960 1970 1980 1990 2000 2010 Year
–10 0 10 20
Ocean heat content (10
22
joules)
0–2 000 m
very strong 1997/1998 El Niño. The trend over the full satellite record from 1993 to present of approximately 3 mm per year is larger than the average 1900–2010 trend (based on tide gauges) of 1.7 mm per year.
A number of studies have concluded that the contribution of continental ice sheets, particu-larly Greenland and west Antarctica, to sea-level rise is accelerating. Cryosat-2 data show that the contribution of Greenland ice-sheet melting to global sea-level rise in the period 2011–2013, which includes the extreme melt year of 2012, was approximately 1.0 mm per year. This was well in excess of the 0.6 mm per year reported in the IPCC Fifth Assessment report for the period 2002–2011.
There have been strong regional differences in rates of sea-level rise in the Pacific Ocean over the period 1993–2015, largely associated with the El Niño/Southern Oscillation (ENSO),11 and
the predominance of El Niño events in the 1990s and La Niña events between 2007 and 2012. The world’s fastest rates of sea-level rise over
11 During El Niño years, sea levels are typically higher in the
eastern Pacific and lower in the western Pacific, largely due to weakened easterly trade winds in the tropics; the reverse is true in La Niña years.
this period have been in the western Pacific, more than 10 mm per year in places, whereas in parts of the eastern Pacific there has been little change in sea level over the period 1993–2015. Sea-level rise has been more consistent in the Atlantic and Indian Oceans, with most parts of both oceans showing rates similar to the global average.
PRECIPITATION
Global precipitation over land areas was strongly influenced early and late in the period 2011–2015 by ENSO, with La Niña conditions for much of 2011 and early 2012, and El Niño conditions in the later part of 2015. The National Oceanic and Atmospheric Administration assessed 2011 as being the world’s second-wettest year on record averaged over global land areas, with 2012, 2013 and 2014 all very close to the long-term average. Conversely, NOAA assessed 2015, a strong El Niño year, as the world’s driest year over land since 1993.
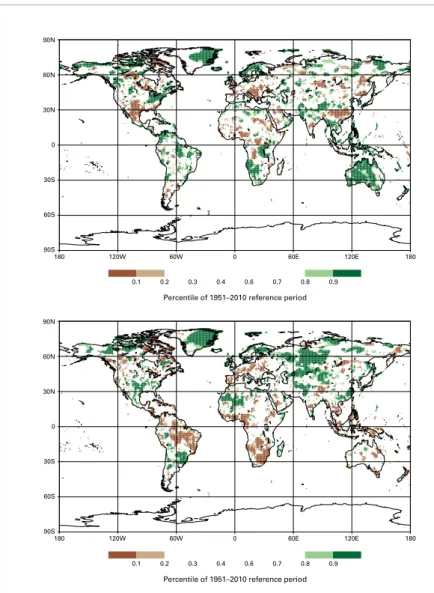
A major feature of the period was the existence of persistent multi-year rainfall anomalies in several parts of the world, most of which began after the end of the 2011/2012 La Niña. Three Figure 8. Total
precipitation for the period October 2012– September 2015 expressed as a percentile of the 1951–2010 reference period for areas that would have been in the driest 20% (brown) and wettest 20% (green) of years during the reference period, with darker shades of brown and green indicating the driest and wettest 10%, respectively
(Source: Global Precipitation Climatology Centre, Deutscher Wetterdienst, Germany)
180 120W 60W 0 60E 120E 180 90S
60S 30S 0 30N 60N 90N
0.1 0.2 0.3 0.4 0.6 0.7 0.8 0.9
Percentile of 1951–2010 reference period
D
a
m
ir S
a
g
o
lj (R
E
U
T
E
R
S
)
regions contained large areas in which rain-fall for the three years from October 2012 to September 2015 was below the 10th percentile. These regions include much of the eastern half of Brazil, the western United States and parts of eastern Australia, along with the North Island of New Zealand. Droughts in these regions are discussed in more detail on page 21. Regions where precipitation over the same period exceeded the 90th percentile included much of south-east Europe, the far east part of the Russian Federation, and an area of subtropical eastern South America incorporating northern Argentina, Uruguay, southern Paraguay and the far south of Brazil. Rainfall over the Sahel region of western and central Africa was generally close to or above normal during the period, except in 2011. Annual flood levels of the Inner Niger delta in Mali were near or above their average post-1970 levels in each of the years from 2012 to 2015, and higher-than-normal sea-sonal flooding also occurred in middle portions of the river in Niger during the period. Normal seasonal flooding also occurred elsewhere in this region during the rainy season.
The year 2011 was a very wet year in many areas that typically see high rainfall during La Niña years, including much of Australia, Indonesia, the Philippines and mainland South-East Asia, Pakistan, parts of southern Africa and north-west South America. Conversely, it was very dry in the southern United States (especially Texas) and northern Mexico. In areas not so strongly influenced by ENSO, there was a marked north– south split in Europe, with very wet conditions in Scandinavia and very dry conditions in much of central and south-east Europe.
Major precipitation anomalies at the annual timescale were less common in the years from 2012 to 2014. Outside those regions with major multi-year anomalies described above, significant annual wet anomalies occurred in north-east Europe in 2012 (wettest year on record in Estonia), much of China in 2012, and Argentina (wettest year on record) and south-east Europe in 2014. Meanwhile, regions that were very dry included much of the central United States and the central Russian Federation in 2012, parts of the southern half of Africa in 2013, and central Africa and the western Russian Federation in 2014.
In many regions with dry signals typical of those during El Niño, 2015 was a very dry year. Affected regions were most of Brazil except the south-east, Central America and the Caribbean, South-East Asia, Indonesia and many Pacific island countries, and southern Africa. El Niño effects were less consistent with historical patterns in parts of Australia and the Indian subcontinent. It was wet in many parts of sub-tropical South America, and in parts of the southern United States and northern Mexico. In Europe, 2015 was dry in the central and eastern parts of the continent but wet in Turkey. The dry anomalies in southern Africa have been par-ticularly acute, with widespread below-normal rainfall in both the 2014/2015 and 2015/2016 summer rainy seasons. South Africa had its driest year on record in 2015.
180 120W 60W 0 60E 120E 180
90S 60S 30S 0 30N 60N 90N
0.1 0.2 0.3 0.4 0.6 0.7 0.8 0.9
Percentile of 1951–2010 reference period
180 120W 60W 0 60E 120E 180
90S 60S 30S 0 30N 60N 90N
0.1 0.2 0.3 0.4 0.6 0.7 0.8 0.9
b c de cfg hicjklm n l op q l qd ck c dc fe cs c dh jt
MAJOR MODES OF CLIMATE
VARIABILITY
There are a number of major modes of variabil-ity that affect the world’s climate on timescales of weeks and months. These modes of vari-ability represent characteristic patterns of variability that are consistent over a large area and therefore have climatic consequences over many parts of the world.
Some of these modes, and their effects on the climate, are as follows:
El Niño/Southern Oscillation (ENSO) Under
normal conditions, cool ocean currents flow northwards along the west coast of South America and extend into a tongue of relatively cool water in the equatorial eastern and central Pacific. During El Niño conditions, this cool tongue weakens, with sea-surface tempera-tures above normal in the central and eastern Pacific; easterly trade winds through the tropical Pacific also weaken. Conversely, during a La Niña phase, the eastern and central equatorial Pacific are cooler than normal and trade winds through the Pacific are strengthened. Each phase – El Niño and La Niña – typically lasts for 9 to 12 months, and occurs on average two to three times per decade.
El Niño is associated with major climate anomalies in many parts of the world, typi-cally bringing abnormally dry conditions to eastern Australia, the Indian subcontinent, southern Africa, north-east Brazil, and Central America and the Caribbean, and abnormally wet conditions to the west and south-east United States, the tropical west coast of South America, and parts of subtropical eastern South America. The world’s warmest years also typically occur in conjunction with El Niño events. In La Niña many of the reverse impacts occur, with heavy rains and flooding typical in regions such as Australia and the Indian subcontinent.
Indian Ocean Dipole (IOD) This is a mode of
variability that involves the difference in sea-surface temperatures between the western and eastern Indian Oceans. In the positive mode of the IOD, waters are cooler than normal in the eastern Indian Ocean, south of the Indonesian
islands of Java and Sumatra and north-west of Australia, and are warmer than normal off the coast of eastern Africa. The reverse is true in the negative mode. Normally, IOD events last for a few months during the southern hemisphere winter and spring and are rarely prominent during the Australian monsoon season (December to April).
Positive modes of the IOD are associated with dry conditions in the southern hemisphere winter and spring over much of Australia and western parts of the Indonesian archipelago, and wet conditions in eastern Africa, with the opposite true for the negative mode. The IOD is influenced by ENSO, with positive modes of the IOD more likely during El Niño years, but the IOD also has substantial variability independent of ENSO.
A r c t i c O s c i l l a t i o n (AO)/N o r t h At l a n t i c Oscillation (NAO)/Northern Annular Mode
(NAM) This is a mode of variability of the
atmosphere in the middle to higher latitudes of the northern hemisphere. In the positive mode, air pressure is higher than average in mid-latitudes over a region focused on 40 °N to 45 °N, lower than average over most of the Arctic, and westerly winds are enhanced over the region in between the two (broadly 45 °N to 65 °N). In the negative mode, pressure gradients over mid-to-high latitudes are weaker, the flow is less zonal and there are more opportunities for polar air to move south to lower latitudes. (The AO refers to the whole hemisphere and the NAO to the North Atlantic sector, but both are broadly describing the same phenomenon; the NAM is a term covering both.) The AO/NAO/ NAM are most prominent and influential during the colder months in the northern hemisphere, particularly December to March.
the west coast of North America from Oregon northwards. Negative phases are associated with colder-than-normal winters in northern and central Europe and eastern North America.
Antarctic Oscillation (AAO)/Southern Annular
Mode (SAM). This is effectively the southern
hemisphere equivalent of the AO/AAO/NAM, with the positive phase associated with a south-wards displacement of the mid-to-high latitude westerlies, and the negative phase a northward displacement.
As the region from 45 °S to 65 °S is dominated by ocean, the major climatic impacts of the AAO/SAM on land are on the northern fringe of
the affected area. Positive phases of the SAM and associated southward displacement of the westerlies are associated with reduced winter and spring rainfall in regions exposed to those westerlies, such as the west and south-east coastal regions of Australia, western New Zealand and central Chile.
Ocean-based modes of climate variability, such as ENSO and the IOD, are potentially predictable on timescales of months and provide a large part of the basis for seasonal climate predic-tion. Purely atmospheric modes of variability, such as the AO/NOA/NAM and AAO/SAM, are not currently predictable on timescales longer than weeks.
El Niño
La Niña
E q u a to r
E q u a t o r i a l t h e r m o c l i n e
supressed upwelling
180° Date Line
140°W 180°
Date Line
100°W 140°E
E q u a to r
increased convection
increased convection
reduced chance of rain
reduced chance of rain
weaker
trade winds
weaker trade winds
E q u a t or i a l t h e r mo c
l i ne E q u a to r
stronger upwelling
180° Date Line
140°W 180°
Date Line
100°W 140°E
E q u a to r
increased chance of rain increased chance of rain increased convection increased convection
stronger trade winds
LARGE-SCALE MODES OF CLIMATE
VARIABILITY
The period 2011–2015 began with a strong La Niña event and finished with a strong El Niño. The 2010/2011 La Niña event was a significant event that had a major impact in numerous parts of the world. It ranked as one of the strongest La Niña events of the post-1950 period. The six-month mean of the Southern Oscillation Index for November 2010–April 2011 was +22, the highest since 1917, although ocean tem-peratures were less extreme; the lowest value of the NOAA Oceanic Niño Index12 was −1.4 °C,
similar to that of the 2007/2008 event and slightly higher than 2000.
The 2010/2011 La Niña broke down in the first half of 2011, but weak to moderate La Niña condi-tions redeveloped in late 2011 and early 2012. For the next three years, ENSO conditions remained generally neutral before an El Niño event devel-oped rapidly during the northern hemisphere spring of 2015. This event strengthened further through mid-2015 and became one of the three most intense El Niño events of the post-1950 period (alongside 1982/1983 and 1997/1998). Sea-surface temperatures were more than 2 °C above average over most of the central and eastern equatorial Pacific. The Oceanic Niño
12 Defined as the lowest/highest three-month running mean of
the Niño 3.4 index.
Index peaked at +2.3 °C, the equal-highest value on record along with 1997/1998.
Markedly negative phases of the Arc tic Oscillation (AO) and North Atlantic Oscillation (NAO) through the northern hemisphere winter of 2010/2011 led to very cold mean winter tem-peratures in much of Europe. The most extreme temperature anomalies were in December 2010; January and February 2011 had near-normal temperatures. The NAO and AO were subse-quently mostly positive through the remaining northern hemisphere winters of the period, although there was a notable negative phase during March 2013, which contributed to very cold conditions during that month in Europe. Short-term extreme phases of the Southern Annular Mode also contributed to significant climate anomalies in various parts of the south-ern hemisphere, notably when a sharp negative phase in September 2013 contributed to what was then Australia’s largest positive monthly temperature anomaly on record.
After being in a positive mode (that is, relatively warm waters in the western tropical Indian Ocean and cool waters in the east) for much of the period 2006–2010, the Indian Ocean Dipole was more variable in the period 2011–2015. There were positive phases for parts of the southern hemisphere winter and spring in 2011, 2012 and 2015, and negative phases in 2013 and 2014, but the 2011–2014 events were all relatively short-lived with significant anomalies (more than 0.5 °C) persisting for no more than two to three months.
MAJOR EXTREME EVENTS OF THE
PERIOD 2011–2015
The period 2011–2015 featured large numbers of extreme weather and climate events, including heatwaves and cold waves, tropical cyclones, flooding, droughts and severe storms.
In terms of casualties, the worst single short-period event of the period was Typhoon
Haiyan (Yolanda)13 in the Philippines in
13 Names in brackets are local names given to the cyclones in the
Philippines. – 0.5
– 1
– 1.5
– 2.5 – 2 0 1.5
1 2.5
2
0.5
Oceanic Niño Index (°C)
1950
1950 19551955 19601960 19651965 19701970 19751975 19801980 19851985 19901990 19951995 20002000 20052005 20102010 20152015
Year Figure 10.
Three-month running means of the sea-surface temperature anomaly in the Niño 3.4 region (the NOAA Oceanic Nino Index)
November 2013. The death toll for Haiyan (Yolanda) was estimated at over 7 800 people, with 4.1 million people displaced.14 Flooding and
14 The number of displaced persons from Typhoon Haiyan (Yolanda)
and information on displaced persons from Somalia in 2011–2012 were supplied by the Office of the United Nations High Com-missioner for Refugees.
associated landslides in northern India in June 2013 left more than 5 800 people dead or miss-ing. A flash flood in southern Brazil in January 2011 claimed more than 900 lives, and flooding in South-East Asia between July and October 2011 was responsible for more than800 deaths. More than 4 100 deaths were attributed to heatwaves in India and Pakistan in May and June 2015. At longer timescales, the famine in Somalia between late 2010 and early 2012,
Event Affected area Date Assessed impact
Drought
Australia 2012–2015 Severe rainfall deficit
Brazil 2012–2015 Severe restriction on water supply in São
Paulo
East Africa, in particular western Somalia
and eastern Kenya 2010–2012
Estimated 258 000 excess mortality in Somalia; 13 million people in need of humanitarian assistance
South-western United States 2011–2015 More than US$ 60 billion of economic losses
Southern Africa, in particular Angola, Namibia and the North West province of South Africa
2013–2015 18 million people in need of humanitarian
assistance
Drought combined with forest fires
South-East Asia and western Pacific 2015
Over 500 000 reported instances of respiratory illness in Indonesia and neighboring countries; 34 directly attributed deaths
Extreme cold
China January–
February 2011
Equivalent of US$ 1.8 billion of economic losses
Eastern and central United States and southern Canada
2013/2014 and 2014/2015 winters
Prolonged below freezing conditions and frequent snowfalls
Europe February 2012 Coldest February in three decades recorded in
several countries
Flooding and flash floods
Australia December 2010–
February 2011
Several US$ billion of economic losses in Queensland
Brazil January 2011 More than 900 deaths due to flash floods and
landslides
Central Europe May–June 2013
Most intense and extended flooding in the Danube and Elbe river catchment since at least 1950
India June 2013 Over 5 800 deaths, 8 due largely to landslides
Pakistan September 2012 5 million people affected, 460 000 homes
damaged or destroyed South-East Asia (Thailand, Lao People’s
Democratic Republic and Cambodia) 2011
Over 800 deaths; more than US$ 40 billion of economic losses
Heatwaves and extreme heat
Australia 2012/2013 and
2013/2014 summers
Record temperatures in many places, reaching 45.8 °C in Sydney in January 2013 East Asia (eastern China, Republic of Korea,
western Japan) July–August 2013 More than 41 people died in China
India and Pakistan May–June 2015 Over 4 100 deaths
West and Central Europe June–August 2015 Very hot summer, extended hot spells of days
with more than 30 °C in several places
Tropical cyclones
Hurricane Sandy, Caribbean and United
States October 2012
233 deaths; US$ 67 billion of economic losses in the United States
Typhoon Haiyan (Yolanda), Philippines November 2013 Over 7 800 deaths Tropical cyclone Patricia, west coast of
Mexico October 2015
Most intense cyclone ever recorded in the western hemisphere
to which the 2010–2011 drought was a major contributing factor, was estimated by the Famine Early Warning Systems Network to have been responsible for approximately 258 000 excess deaths, and resulted in many people fleeing Somalia for neighbouring countries.
There were also a number of events during the period that led to very large economic losses. Among those events, which were assessed by various sources15 as each having economic
losses in excess of US$ 20 billion, were the following:
• Hurricane Sandy in the Caribbean, espe-cially Haiti, and across the eastern United States and eastern Canada in October 2012 (assessed by NOAA NCEI at US$ 67 billion for the United States component);
• Flooding in South-East Asia in 2011;
• Drought in the southern and central United States in 2012 and 2013;
15 The major sources used are the NOA A NCEI billion-dollar
disasters list for events inside the United States, and the EM-DAT Emergency Events Database maintained by the Centre for Research on the Epidemiology of Disasters at the Université catholique de Louvain, Belgium, for events elsewhere in the world. Supporting information was also obtained from the AON-Benfield series of global catastrophe reports.
• Flooding in central Europe in May and June 2013.
HEATWAVES A REGULAR
OCCURRENCE
While no individual heatwave during the period 2011–2015 had the extreme impact of the heat-waves of 2003 in central Europe or 2010 in the Russian Federation, major heatwaves were a regular feature of the period.
As noted above, the most significant heatwaves of the period in terms of documented casualties occurred in May and June 2015 during the pre-monsoon periods in India and Pakistan. Although temperatures near or above 45 °C are not uncommon at that time of year in many parts of interior India and Pakistan, such temperatures during the 2015 pre-monsoon extended to near-coastal regions that do not normally experience such extreme heat, including the Karachi region in Pakistan and Andhra Pradesh in eastern India, where the heat was also accompanied by very high humidity.
Western and central Europe experienced their most significant heatwave since 2003 in the first half of July 2015. A national record of 40.3 °C was set in Germany and equalled a few weeks later, while all-time records for specific locations were set in countries including Spain, France and Switzerland. It was the longest
Year Country
2015
Belarus China Colombia Cuba Estonia
Finland Lithuania Mexico Morocco
Russian Federation
Singapore South Africa Spain Switzerland
2014
Austria Belgium Croatia Czechia Denmark France
Germany Hungary Iceland Italy Luxembourg Netherlands
Norway Poland Serbia Slovakia Sweden United Kingdom
2013 Australia Bulgaria
2012 Argentina United States
2011 Madagascar Reunion
2010 or earlier
Canada India Ireland Israel
Japan New Zealand Republic of Moldova Seychelles
Turkey
United Republic of Tanzania Uruguay
heatwave on record for Spain, which had its hottest July on record, as did Switzerland and Austria. There were also significant heatwaves in parts of Europe in the summers of 2012, 2013 and 2014. All three set national records in one or more countries, including the first recorded temperatures of 40 °C or above in Austria (2013). The impact of these heatwaves, especially the 2015 heatwave, was modest compared with the 2003 heatwave that resulted in tens of thousands of deaths, indicating the benefits of improvements in heatwave warning and response since 2003.
A prolonged heatwave affected many parts of eastern Asia in July and August 2013. It was the hottest summer on record in both Japan and the Republic of Korea. Japan also experiencing a national record of 41.0 °C in August 2013. Parts of eastern China, especially in the vicinity of Shanghai, were also badly affected. Hangzhou, with a previous record high temperature of 40.3 °C, exceeded that value on 10 separate days in late July and early August, with a peak of 41.6 °C.
Australia experienced extreme heat in the sum-mers of 2012/2013 and 2013/2014. January 2013 was the hottest month on record in Australia, with records being set at many locations, includ-ing Sydney (45.8 °C) and Hobart (41.8 °C). In January 2014, records were set for persistent heat in places, including four consecutive days above 41 °C in Melbourne.
In October 2014, a major heatwave affected large parts of South America, including northern Argentina, Uruguay, Paraguay and southern and central Brazil. All-time record high temperatures were recorded at São Paulo and Brasilia, and readings were as high as 46 °C in northern Argentina. Extreme heat also affected northern and central Argentina in December 2013, when Buenos Aires experienced its longest recorded heatwave.
Southern Africa was affected by a number of major heatwaves during the 2015/2016 summer from October onward, in conjunction with the major drought affecting that region. Numerous locations broke previous records for their highest temperature on multiple occasions in November, December and early January.
After initially setting all-time records in early November 2015, on 7 January 2016 Pretoria and Johannesburg ultimately reached 42.7 °C and 38.9 °C, respectively, which were both 3 °C or more above their pre-2015 records (39.7 °C and 35.4 °C, respectively).
DESPITE OVERALL WARMTH, SOME
PERIODS OF SIGNIFICANT COLD
AND SNOW
Despite the overall warmth of the period 2011–2015, there were still some episodes of abnormal cold and snow in the major northern hemisphere continents.
A prolonged period of extreme cold affected large parts of Europe in February 2012. It was the most significant cold spell since either 1985 or 1987 in many parts of central and western Europe. Temperatures remained below 0 °C continuously for two weeks or more in most of central Europe, although no significant low temperature records were set. This event also brought extremely heavy snow in some places, especially in parts of eastern Italy downwind of the Adriatic Sea. March 2013 was also notably cold in much of Europe, with significant bliz-zards in places.
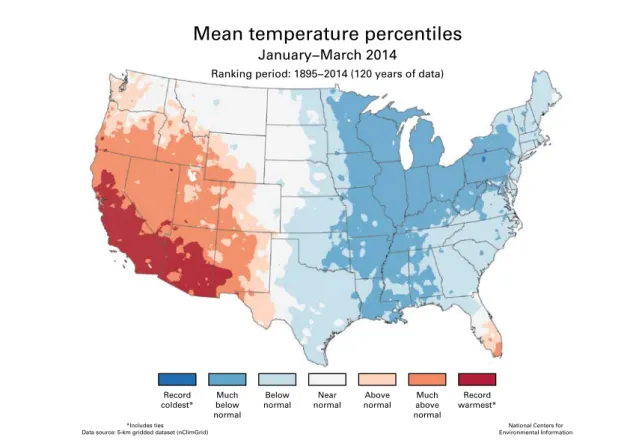
The winters of 2013/2014 and 2014/2015 were both significantly colder than normal in many central and eastern parts of the United States
40
30
20
10
0
–10
–40 –20
–30 Per cent
Figure 11. Percentage of warm days (exceeding the 90th percentile of the reference period, 1981–2010) relative to average during European summer 2015
(Source: Royal Netherlands
Figure 13. Northern hemisphere snow cover extent since 1970 (blue line for January, red line for June)
(Source: Data from the Global Snow Lab, Rutgers University, United States)
and southern Canada. Low temperatures per-sisted through the region for extended periods, although the lowest temperatures reached were mostly several degrees above record levels. By contrast, winter temperatures during these winters were at record highs on the west coast. The cold was especially persistent in February 2015, when temperatures at locations such as Montreal, Toronto and Syracuse did not rise above 0 °C at any time during the month. In coastal regions, the cold conditions in the
2014/2015 winter were accompanied by frequent snowfalls, with Boston experiencing its greatest seasonal snowfall on record.
DESTRUCTIVE FLOODING IN MANY
PARTS OF THE WORLD
Destructive flooding in many parts of the world, which had a number of humanitarian impacts, contributed to major casualties and heavy economic losses.
India and Pakistan were particularly affected, with destructive flooding occurring in one or both countries in each monsoon season from 2011 to 2014. The most destructive single event occurred in June 2013, when very heavy rain in the far north of India, particularly in Uttarakhand state, was a major contributor to a series of events that resulted in more than 5 800 deaths. Four-day rainfalls over the most severely affected region were unprecedented, and the wettest day (16 June) had one-day rain-fall 105% higher than that of any previous June day. Many of the deaths occurred in landslides, while the flooding was exacerbated by snowmelt
10
0 20
Snow cover extent (million km
2)
1970 1975 1980 1985 1990 1995 2000 2005 2010 2015
January June 60
50
40
Year
Mean temperature percentiles
January−March 2014 Ranking period: 1895−2014 (120 years of data)
*Includes ties
Data source: 5-km gridded dataset (nClimGrid) Environmental InformationNational Centers for
Record coldest*
Much below normal
Below normal
Near normal
Above normal
Much above normal
Record warmest*
Figure 12. January– March temperature percentile map depicting a cold winter in the eastern United States and a warm winter in the western part of the country
at higher elevations (due to an above-average seasonal snowpack and the unusually early timing of the storm during the monsoon season) and glacial lake outbursts. Destructive flooding also occurred in Kashmir and downstream areas in both India and Pakistan in September 2014. Pakistan also experienced significant flooding in both 2011 and 2012, although in both years the flooding was more localized than it had been in the historic flooding in 2010. In September 2012, nearly 5 million people were affected and 460 000 homes were damaged or destroyed due to flooding.
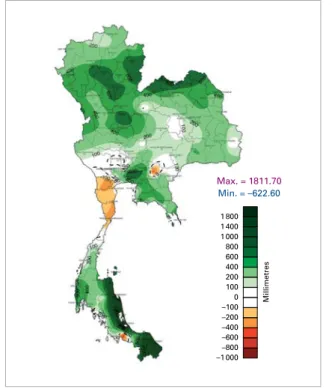
Further east in Asia, persistently above-aver-age rainfall during the peak rainy season of June–September 2011 was responsible for major and long-lived flooding in South-East Asia. Seasonal rainfall totals were about 35% above normal over an area centred on the upper Chao Phraya catchment in northern Thailand. Thailand was the worst-affected country, with initial flooding in rural areas moving down-stream to inundate large areas of Bangkok by late October. Neighbouring countries, espe-cially the Lao People’s Democratic Republic and Cambodia, were also badly affected. More than 800 deaths occurred in the flooding and economic losses were estimated by the World Bank at US$ 40 billion or more, much of it through lost industrial production as flooding led to factory closures and interrupted supply chains.
Flash floods led to significant casualties in many parts of the world during the period 2011–2015. The worst single event occurred in January 2011, when more than 900 lives were lost in a flash flood north of Rio de Janeiro, Brazil.
Along with flooding in South-East Asia in 2011, a number of other events affected large areas. Flooding occurred in the Danube and Elbe basins of central Europe in May–June 2013, and in east-ern Australia (especially Queensland) in early 2012. Economic losses were estimated in the tens of billions of dollars in both cases, although casualties were relatively modest compared with events in Asia. Extensive flooding in the Paraná river basin in central South America in June and July 2014, although limited in direct casualties, affected more than 700 000 peo-ple in Paraguay, western Brazil and northern
Argentina, with some displaced persons in Paraguay still unable to return to their homes in late 2014. There was further significant flooding in this region in late 2015 and early 2016.
PROLONGED DROUGHTS
AFFECTED SEVERAL CONTINENTS
Brazil was badly affected by drought for much of the period 2011–2015. The north-east of the country suffered significant drought in 2012 and 2013. A relatively localized drought also developed in the São Paulo region during 2013, which spread to many other parts of eastern Brazil during the second half of 2014 and early 2015. Conditions improved slightly in some parts of eastern Brazil from February 2015, although the north-east remained dry. Meanwhile, large parts of the Amazon basin, centred on Brazil but also extending into neigh-bouring countries, were extremely dry in the southern hemisphere winter and spring in both 2014 and 2015, especially the latter; for example, rainfall at Manaus for June–October 2015 was 58% below normal. (While this is normally the drier part of the year, rainfall still averages 50 to 100 mm per month; the 2015 rainfall totals were more typical of the dry season of a savannah climate than a rainfor-est climate.) The dry conditions, which were
Figure 14. Annual rainfall anomalies in Thailand for 2011, expressed as millimetres above or below the long-term average (Source: Thai Meteorological Department)
Max. = 1811.70
Min. = –622.60
Millimetres
accompanied by temperatures generally 2 °C to 3 °C above normal, contributed to very high fire activity, with the number of fires in Amazonas state in 2015 at record levels. The drought in the São Paulo region placed great stress on local water resources, with levels in local water storages falling to below 10% during the 2014/2015 summer, and resultant severe restrictions on water supply.
The United States and adjacent areas of north-ern Mexico also experienced significant drought over large areas in the period 2011–2015. Texas and northern Mexico underwent a severe drought year in 2011, with drought conditions spreading to cover much of the central United States during 2012 and 2013. In July 2012, 64.5% of the continental United States was classified as being in drought, the largest extent since the Dust Bowl years of the 1930s. From 2013 onward, conditions improved east of the Rockies but worsened in the west, where California experienced one of its most severe droughts on record. Californian rainfall was at least 20%
below normal in each of the four rainfall years16
from 2011/2012 to 2014/2015, an unprecedented event. The total rainfall for the four years from October 2011 to September 2015 was 30% below normal, well below the previous record for an equivalent period (26% below normal in 1986–1990). There was only modest recovery in 2015/2016, when rainfall was close to normal, well below expectations for a strong El Niño year. Total economic losses due to drought in the United States between 2011 and 2014 were estimated by NOAA NCEI at approximately US$ 60 billion.
Significant long-term droughts also occurred in Australia and southern Africa. In Australia, much of inland Queensland and adjacent areas of northern inland New South Wales had
16 As California receives nearly all its rainfall in the winter half-year,
for the purpose of this section, a rainfall year for California is defined as extending from October of one year to September of the following year.
B
ru
n
o K
e
ll
y (R
E
U
T
E
R
S
)
rainfall well below normal since mid-2012, with multi-year rainfall deficits over many parts of the region reaching levels not seen since the 1930s. Sustained below-normal rainfall also occurred since mid-2012 over an area focused on western Victoria, spreading to cover most remaining parts of Victoria and southern South Australia from mid-2014 onward. These rainfall deficits continued into early 2016 before being substantially relieved by heavy rains from May 2016 onward.
Parts of southern Africa were also affected by drought from late 2013, particularly Namibia, Angola and the North West province of South Africa in the 2013/2014 wet season, and much of South Africa from mid-2014 onward. The period from July 2014 to June 2015 was the driest on record for the province of KwaZulu-Natal, and the fifth-driest for South Africa as a whole, while the 2015 calendar year was the driest on record for South Africa. Drought in this region is typically associated with El Niño. The humanitarian impact of this drought continued into 2016, with the World Food Programme estimating that 18 million people would require assistance by January 2017.
Indian monsoon season (June–September) rainfall was more than 10% below normal in both 2014 and 2015, the first time this had occurred in two consecutive years since 1986 –1987. However, the impact of this was moderated by improvements in agricultural productivity in recent decades, as well as above-normal rainfall outside the core monsoon season. Nevertheless, the dry conditions of 2014 and 2015 resulted in water shortages in parts of India towards the end of the 2015/2016 dry season, before being relieved by the 2016 summer monsoon. Dry conditions during the normal rainy season in 2015 had a significant impact towards the end of the 2015/2016 dry season in parts of the Mekong basin, especially in Viet Nam.
Shorter-term droughts had a major impact in some parts of the world. The 2010 –2011 drought in the Horn of Africa, resulting from the successive failure of the October–November 2010 and March–May 2011 rainy seasons, had major humanitarian impacts (including stock and crop losses, food shortages and large-scale displacement of the population), especially in
Somalia, and adjacent areas of northern Kenya. The United Nations Office for the Coordination of Humanitarian Affairs estimated that 13 million people required humanitarian aid, while the Famine Early Warning Systems Network esti-mated excess mortality of 258 000 in Somalia during the October 2010–April 2012 period. Further drought redeveloped in parts of East Africa, particularly northern Ethiopia and Eritrea, during 2015.
From mid-2015 onward, significant drought, associated with El Niño, affected many parts of Indonesia, as well as parts of nearby countries in South-East Asia and the western Pacific, such as Papua New Guinea, Vanuatu and Fiji. The drought conditions contributed to exceptional levels of fire activity on the islands of Sumatra and Borneo, causing severe smoke pollution over large parts of the region. The smoke haze triggered widespread disruption in Indonesia, Singapore and Malaysia. In Indonesia, 2.6 mil-lion hectares were reported to have burned, and over 500 000 instances of respiratory problems, including 34 deaths directly attributed to the haze, were reported between July and October 2015. Subsequent studies showed a substantial increase in overall mortality across the region. Drought associated with El Niño also affected parts of the Caribbean, Central America and north-west South America in 2015 and early 2016. Numerous Caribbean islands experi-enced their driest year on record in 2015, as did Colombia, which had its two wettest years on record during the 2010/2011 La Niña.
During the period November 2013–April 2014, extreme drought conditions were recorded over an area extending from the Mediterranean coastal Middle East, northward through Turkey and eastward through Kazakhstan, Uzbekistan and Kyrgyzstan. Averaged over the area, pre-cipitation deficit was the largest seen in many decades.