Relevant environmental issues
E
NEASS
ALATI,Â
NGELOA
UGUSTO DOSS
ANTOS &I
SRAELK
LABINIntroduction
T
his paper, originally presented at the seminar “Brazil: the country in the future — 2022”, is a specific contribution to the proposed modelling of a Brazilian forecast in the next seventeen years, so that the modelling may be thought upon and may be enriched with the environmental agenda issues, whose impacts are, in our point of view, crucial to and determinative of our future. In our analysis, the prospective project must take into account the political, economic and social consequences of the transformation of the globe and of Brazilian biomes, which will fatally modify the vectors of a simple geopolitical analysis.What would the most relevant environmental issues to Brazil be? Rigorously speaking, every human being (so that we won’t generalize and say every “living being”) is inexorably related to the environment, altering it somehow. Demonstrating coevolutive interactions between the human being and the environment would be an interesting approach to delineate the fault lines in a future scenario, but it would part us from the objective of this paper. The most relevant environmental issues to Brazil have been chosen according to the point of view and experience of the authors and analyzed personalities, and to their impacts on nature. For the next 20-30 years, some of the relevant issues, not in a priority order, are:
Population growth
and the demand for goods and services
The increase of the world population pressures the environmental services that are gratuitously supplied by nature — for example, a greater emission of CO2 has impacts on the atmosphere. Food supply for the extraordinary population contingent of the 21st century no longer presents
Impacts of Global Climate Change (GCC) on the biomes
Loosely speaking, we may accept that tropical regions are richer in ecosystems and species due to their climatic characteristics. Biodiversity is not homogeneously distributed throughout the planet. It is concentrated in some tropical regions.
The elaboration of greenhouse gas (GHG) emission scenarios,
through modelling, indicates an increase in temperature in the Southeast and Center-West regions between 0.4°C and 1.1°C in 2025; and this figure may
reach 5°C in 2080. Also, an increase in precipitation between 10% and 15% during the 21st century is expected. The present diversity and distribution of the Characidium lauroi species group show a strict relationship with the cold mountain waters of the Southeast region. Changes in water temperature inhibit the presence of this species and have already led to its disappearance in other areas.
A temperature increase has also been forecasted for the Amazon region. However, the conclusions about precipitation variations are still uncertain. Short-cycle species or those with a better photosynthetic
performance have been favored in certain parts of the interior of the Amazon, to the detriment of long-cycle species, due to the increased presence of CO2 in the atmosphere.
Loss and fragmentation of habitats due to deforestation
This is the first global factor of biodiversity destruction. The Atlantic Forest used to occupy an area of 1.3 million square kilometers. Nowadays, however, it is fragmented as only 5% of its original extension is left. The same predatory cycle is being repeated in the Amazon. Deforestation has direct effects on the reduction of the habitats of plant and animal species (the elimination of the vertebrates that disperse seeds compromises germination) and indirect ones as well, such as: 1.
the production of great quantities of organic waste, fuel material that, combined with garbage and dead biomass (from fragmentation), makes the region even more susceptible to fires; 2. the edge effect that causes the fall of adult trees, which, in turn, stifle young trees causing their mortality and the increase in the number of lianas, of parasite species, and of species adapted to poor soil (Tabarelli et al., 2004).
Introduction of exotic species and diseases – invasive plants
(Limnoperma fortunei), the African land snail (Achatina fulica), the Aedes aegypti (yellow fever mosquito) and the Rattus rattus (black rat) are the best examples of exotic species that have become an environmental problem in Brazil.
Excessive exploitation of plant and animal species
The over-exploitation of natural resources has become a threat to several species. The most common examples are: lion monkey, Brazilwood, Juçara palm or heart-of-palm (Euterpe edulis) — for palm heart consumption
—, rosewood (Aniba rosaeodora Ducke) — for the essential oil used in perfumery —, manjuba and Brazilian sardine. According to the Ecological Footprint analysis, which measures human use of the natural resources, in 2000, global population used all the biological productivity capacity of the planet. In 2001, humanity exceeded the biological productivity capacity in 20%. This over-exploitation of the natural capital of the planet will only be possible for a limited period of time. How long?
Deforestation in the Brazilian Amazon
The deforestation alters the water and energy cycles, leads to an
increase in air temperature and a decrease in precipitations, which may reduce the quantity of water vapor transported to other regions. The fragmentation of forested areas reduces the number of habitats available to biological species.
Degradation of fresh water resources in both quantity and quality
Superficial waters near urban centers are generally polluted due to point sources of domestic and industrial effluents or due to diffuse pollution deriving from farming activities. Water shortage in some regions may become critical due to the increase in water consumption for industrial and irrigation activities.
Degradation of sea water resources along the Brazilian coast
Many studies indicate the degradation of water resources along the Brazilian coast. The information concerning the coastal regions of the state of São Paulo and Rio de Janeiro is more detailed. The data indicate that
leisure activities in many areas are compromised during a great part of the year or even during the whole year. Pollution usually comes from urban and industrial effluents. However, one should also consider port activities and oil spills.
Relationship between poverty and urban environmental degradation
degradation. Thus, poverty becomes, simultaneously, cause and consequence of this pernicious cycle.
Direct and indirect impacts on energy production and transportation (hydroelectric, thermoelectric and nuclear power plants)
The direct environmental impacts of hydroelectric plants are well-known. Nevertheless, the indirect impacts are often much stronger, especially in the Amazon region, where enterprises, such as Tucuruvi hydroelectric plant, accelerate the deforestation process in their surroundings.
Direct and indirect impacts on the production and transportation of petroleum and its derivatives
The most critical environmental impacts derive from oil spills that take place during its transportation. The classical examples are Guanabara Bay and São Sebastião (SP) oil spill incidents.
Anthropogenic pressure on the remains of the Atlantic Forest
Five percent of what is left from the Atlantic Forest is under constant threat from the activities in its surroundings. Its destiny will highly depend on the management capacity of environmental control organs.
Impacts of human activities on the Pantanal
The Pantanal rivers have been suffering direct environmental impacts with the increase of cattle-raising, mining and agricultural activities in the plateau region. These activities silt up the rivers and affect the quality of the waters. There is also a constant threat from the increased barge navigation. A recent project planned the construction of canals in several regions, which would intersect natural meanders.
Destiny of urban and industrial solid debris
The volume of solid debris (waste and sewage mud) has been increasing in Brazil. There are already serious problems regarding the construction of landfills in metropolitan areas. The solution to this problem is a challenge to be faced in the next decades. In many countries (the United States of America, England, Germany, France and Austria), incineration has been used as a solution.
Shortage and management of water resources in the Brazilian Semi-Arid
This has been a secular problem. Intensive agriculture may be developed all year long in the semi-arid Northeast due to the temperature and to the abundance of solar power. The limiting factor is water supply;
Tocantins and Amazon River Basins represent the largest liquid fresh water reserve in the planet, with an average outflow of 220,000m3 discharged in
the ocean per second.
The São Francisco River water transposition project may be the first
step. However, one should remember that there are large areas near this source that also need irrigation. In these studies, it is important that the management of water resources be taken into account as well as the risks of increasing the salinization of the waters in the region. This may happen if there are no adequate outlets for the drainage of the highly salinized waters.
Loss of soil fertility and erosion
The agricultural activities developed without the observance of the adequate techniques for the kind of soil and the declivity of the land may result in the loss of fertility and the silting up of rivers. An example of this is the expansion of coffee cultivation in the states of São Paulo and Paraná.
The experiments of rubber tree intensive planting in the Amazon, which have been hindered by a fungus, and, more recently, the economic and environmental disasters of the Jari Project, in Pará, must also be mentioned.
Inadequate use of agrochemicals
The use of agrochemicals in quantities above the necessary ones is a constant problem. There is a world tendency of decreasing their use, at the same time that there is an increase of organic products, which are free of chemicals, in the market.
Loss of gallery forests
This is a problem that affects the entire national territory. Gallery forests are an important agent of environmental protection of the associated fauna and flora. It also provides direct protection to water resources from the diffuse pollution in hydrographical basins.
Introduction of Genetically Modified Organisms (GMO) and bio-security
In 2002, around 6 million agriculturists have cultivated 60 million hectares of transgenic products in 16 countries. In Brazil, transgenic plants are grown without due attention to the Principle of Precaution, as indicated by the Convention on Biological Diversity. That’s the case of illegal RoundUp soya plantations in the state of Rio Grande do Sul.
Impacts of GCC on Brazilian ecosystems
General remarks
The concentration of greenhouse gases in the Earth’s atmosphere has been increasing for the last 150 years, especially in the last five decades (IPCC, 2001). Considering the most relevant climate forcings, the increases were: CO2 — 31 ± 4%; CH4 — 150 ± 25%; N2O — 17 ± 5%.Tropospheric O3 increased 35 ± 1% from the year 1750 to the year 2000, depending on
the analyzed region; and it decreased in the stratosphere in the period from 1970 to 2000, varying according to the altitude and latitude. Atmospheric concentrations of HFC, PFC and SF6have registered a global increase in the last 50 years (ibidem).
Global forecasts for the 21st century indicate a temperature increase
of 1.4°C to 5.8°C. Simulations of global models with different scenarios agree on the increase of the average of water vapor concentrations in the atmosphere as well as on an increase in precipitations in the 21st century. A
9cm to 88cm sea level rise in the period from 1990 to 2100 is also expected.
Some climate tendencies in Piracicaba region, SP
A study based on data from Esalq/USP meteorological station searched for the variations of precipitation and of the monthly average minimum, mean and maximum temperatures from 1989 to 2003 and from 1917 to 1988 (Villa Nova et al., 2004). It shows that:
Mean temperature: data in Figure 1 show an average increase of 0.78°C. This is in agreement with what has been observed in other regions in the world, which indicate an increase of 0.6°C for the 20th century.
Figure 1
Maximum temperature: data in Figure 2 indicate that the variations observed are very little, and that there’s a tendency towards positive values.
Figure 2
Maximum temperature: difference among the monthly averages from 1989 to 2003 and from 1917 to 1988.
Minimum temperature: data in Figure 3 indicate an increase in the minimum temperatures, following the same coursepredicted by the greenhouse effect, which decreases the energy sent into outer space through infrared radiation.
Figure 3
Minimum temperature: difference among the monthly averages from 1989 to 2003 and from 1917 to 1988.
Figure 4
Precipitation: difference among the monthly averages from 1989 to 2003 and from 1917 to 1988.
Scenarios of possible impacts of GCC on water balance
For the 21st century, IPCC-2001 forecasts an increase of 4°C to 4.5°C
in the average air temperature in Brazilian South, Southeast and Center-West regions and a possible increase of 10% to 15% in autumn precipitations. There is also an indication of possibility of droughts in the summer.
Based on this information, a study considered five scenarios with an increase of 15% in annual precipitations equally distributed throughout a year and with a temperature increase of 1°C, 2°C, 3°C, 4°C and 6°C. The
values 2°C, 4°C and 6°C correspond approximately to the ones forecasted
for the following decades: 2020, 2050 and 2080. The data used as basis in these studies are the averages of the period from 1961 to 1990. Based on these scenarios, a water balance using Thornthwaite-Mather model has been developed, with an available water capacity of 100 mm for several cities, such as: Arco Verde, Bagé, Brasília, Cuiabá, Curitiba, Londrina, Manaus,
Piracicaba, São Joaquim and Uberaba (Salati, 2004).
The water balances for Piracicaba are represented in Figure 5. The “excess” represents deep percolation or surface flooding water in the specified month (mm/month) and “deficit %” indicates the percentage of lack of water in plant demand for PET (Potential Evapotranspiration) or (DEF/PET) x 100. Deficit is the difference between PET and the plant’s need of AET (Actual Evapotranspiration).
The study has indicated a reduction in water resources availability that may have negative consequences to agricultural production and river flow, affecting natural biomes (Table 1). The harshest impacts are expected in the regions of Piracicaba, Cuiabá and Campo Grande. In these regions, a 2°C rise
balance is less sensitive to temperature rise in other regions; especially in the states of Rio Grande do Sul, Santa Catarina and Paraná. It is, however, quite
sensitive in the semi-arid region of the Brazilian Northeast, where one may see a harsh decrease in water excess. This 2°C rise in the average temperature
could happen in the 2020s.
Table 1 – Variations in water resources quantity percentage for surface flooding and aquifer recharge (values refer to the relation excess/precipitation x 100)
T + 0 T + 2 T + 4 T + 6 Manaus 35 28 24 21
Belém 48 39 35 32
Cuiabá 11 5 0 0
Brasília 46 40 27 20 Campo Grande 26 15 9 4 Uberaba 40 31 24 18 Piracicaba 21 10 6 3 Curitiba 45 41 33 22 São Joaquim 60 58 54 48
Bagé 42 36 31 25
Londrina 39 30 21 10
Consequences of the deforestation in the Amazon
The Amazon region, especially the Brazilian Amazon, is currently under pressure from two climatic forcings: a regional one, derived from the deforestation; and another one caused by GCC. Evidences show that both contribute to regional/global temperature rise. The deforestation contributes to the decrease in local precipitation. Data from global climate models are still inconsistent in respect of rainfall variations in the 21st century.
The dimension of deforestation in the Brazilian Amazon
Until 35 years ago, this biome was covered with different native forest formations. Nowadays, the dynamics of the Amazon colonization go through an expansion that cannot be compared to any other in its history. Tax incentives, the main propeller of deforestation up to the 1980’s, have been replaced by market forces, which, in turn, have substituted the government as an inducer of regional developments. Private businesses became lucrative on its own (such as the extractions of hardwood, mining, cattle-raising, and above all, soya agribusiness). This shift from the public to the private is the main vector behind the expansion of the current agricultural frontier in the Amazon region (Magulis, 2003; Alencar et al., 2004).
In the initial years of the 1990’s, deforestation rates remained at a mean level: 17,000 km2/ year (Prodes-Inpe). As from this date, the government
has been announcing tendencies of increase in this level at every annual deforestation inventory. In 2001-2002, the deforestation rate was 23,260 km2
— highly above the 15,000 km2 expected for the previous year. In 2002-2003,
this rate reached 23,750 km2. And in 2003-2004, the deforested area reached
26,130km2, at that time, the largest deforestation ever. This surge is associated
with the increase of soya plantation areas in the state of Mato Grosso, which confirms the role of the agribusiness as a great power of regional transformation. Data from Prodes allow us to calculate that, until 2003, the accumulated deforestation throughout the region of the Legal Amazon added up to 652,908 km2 — an area as large as the state of Minas Gerais.
Additionally, there’s an “invisible” deforestation that concerns the hardwood tree removal and small forest fires. This fact leads some authors to believe deforestation corresponds to much more than official figures.
Climatological aspects/ water and energy fluxes
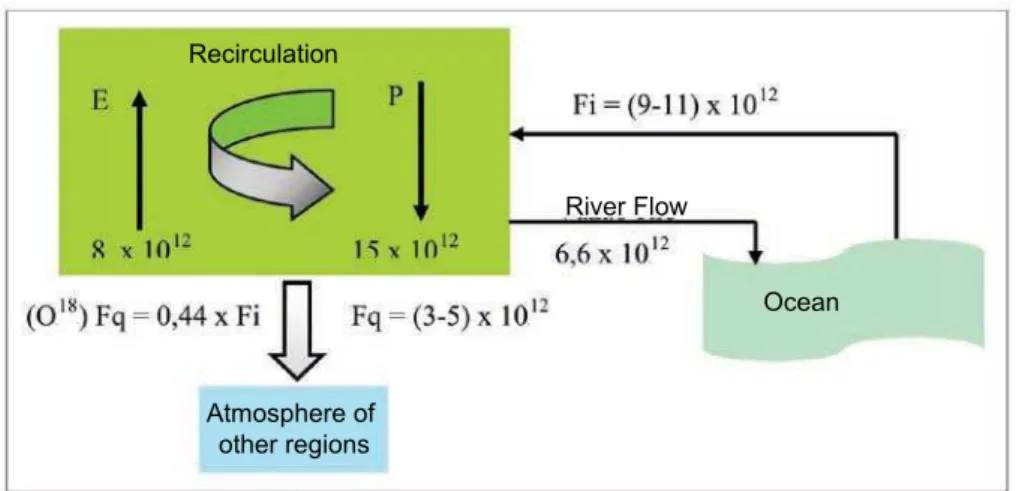
Summarizing, primary vapors come from the Atlantic Ocean and penetrate in the region through trade winds that blow from the East Quadrant and vary according to the time of the year and the movement of the Intertropical Convergence Zone.The rain derived from the condensation of water vapor partly (approximately 60%) returns to the atmosphere through evapotranspiration of forest systems and another part flows off along the Amazon River trough. There is a high recirculation of water vapor in the region due to its vegetation cover and geomorphology. Precipitation water is a mixture of primary vapor from the ocean and vapor produced by
evapotranspiration of forest systems and by the direct evaporation of surfaces that are free of water.
Roughly speaking, 50% of the precipitation in the region would derive from this water vapor recirculation. Additionally, vapor from
evapotranspiration is of the same order of magnitude as the vapor that comes from the ocean. Estimates based on the study of 018 of the water vapor that
enters the region (Figure 6) and the waters of the Amazon River (Salati et al., 1979) show that great part (0.44 Fi where Fi is the water flux coming from the ocean) of the vapor that comes through trade winds eventually leaves the basin. This flux corresponds to approximately 3 to 5 x 10¹² m3 per year. Part of
it goes to the Center-South region of the South-American continent.
Figure 6 – Amazon Basin. Water balance — fluxes in m3/year
Quantification of fluxes has been developed in recent projects. Among them, the studies on the “South American Low-Level Jets” gain prominence. They demonstrate the importance of the water balance in several regions (Herdies et al., 2001). Silva Dias and Marengo (1999) explored the dynamic processes that define precipitation levels and their variability in Brazil.
from evapotranspiration and increase, in a first phase, the river flows, once there will also be an increase of surface flooding in deforested areas. This implies a reduction of the available water resources in the soil-plant system of the region, which would reduce the residence times of water molecules in the considered ecosystems and decrease the offer of water vapor in other regions.
Radiation balance studies in the region of Manaus concluded that the average solar radiation rate in the region is around 425 cal/cm2 a day.
Fifty percent of the radiation balance were used in the production process of water vapor through forests’ evapotranspiration and evaporation of surfaces free of water (latent heat); and 50% were used in air warming (sensible heat). Due to the deforestation, the quantity of energy used for air warming should increase.
There are evidences that these modifications are already happening together with the enhancement of the deforestation. Costa et al. (2003) found, in a 176-thousand-km2-sub-basin of the Tocantins River, an increased
flux derived from deforestation. There were no sensible changes in the totals of precipitation. This implies a reduction of evapotranspiration, which alters the local and regional water cycles. The registered values indicate a 25% flux increase from 1980 to 1990, compared to the values of 1950-1960. This variation was registered in rainy periods as well as in dry periods. There was a 20% rise in deforestation in the region from 1960 to 1995.
Fires can also alter the water balance through Cloud Condensation Nuclei (CCNs), which have biological origin and come from biogenic gases that undergo gas-to-particle conversion (Artaxo, 2005). These microscopic aerosol particles have the ability of condensing water on the surface. Thus, coupled with water vapor, they contribute to the formation of cloud droplets (Silva Dias et al., 2004; Andreae et al., 2004). The difference in the
concentration of CCNs between the wet and the dry seasons (from about 200 to 20,000 p.p cm-3), derived from fires in large areas of the Amazon, alters
the microphysical properties of the clouds, which change their development conditions and, later, the derivative pluviometric precipitations (Artaxo et al., 2003; Andreae et al., 2004).
Intensive experiments designed to study soil-plant-atmosphere interactions from the microclimatic perspective in forests and pasturelands in the Amazon region (Abraços, 1990-4) concluded that a reduction of
6% to 20% in regional precipitation may occur in a scenario of substitution of pasturelands for forests. Comparative studies on air temperature of pasturelands and native forests show a decrease of 2.4°C in deforested areas.
The Amazon in the Global Climate Change (GCC) context
GCC consequences for the Amazon ecosystems, predicted by Global Climate Models (GCMs), vary according to the type of GCMs used and to each different scenario of greenhouse gas emissions. Temperature variations for the years 2020, 2050 and 2080 range from + 1°C in scenario B2 (2020) to + 8°C in 2080 — scenario A2 (Marengo, 2005).
Figure 7 shows the projections of temperature anomalies for September, October and November, relative to the base-period 1961-1990 for South America. The forecasts were made by HadCM3 for the time slices in 2020, 2050 and 2080 for both B2 and A2 emission scenarios.
Other models, such as CCCMA (Canada), CSIRO (Australia), GFDL (United States) and CCRS-NIES (Japan), also predict a temperature increase. However, their values are not as high as those predicted by HadCM3 (Marengo, 2005).
In reference to pluviometric precipitations, the models show a high degree of uncertainty as to increases or decreases (IPCC, 2001; Marengo, 2005).
Figure 7 – Temperature anomaly projections (°C) for SON, relative to the period of 1961-1990, for South America. Forecasts from HadCM3 model. The time slices in 2020, 2050 and 2080 of the scenarios are A2 and B2 (Marengo, 2005).
,/!'#" ,/!'#"
,/!'#"
Having in mind that the increase in near-surface temperature enhances air capacity of retaining a greater quantity of water vapor, one may expect a more dynamic water cycle, with possible increases in number and intensity of extreme events, such as harsh storms. At the moment, the uncertainties regarding the trend of precipitation changes make it difficult to predict the impacts of Global Climate Change on the Amazon ecosystems.
As regards temperature variations, the tendencies derived from GCC go in the same direction as those derived from deforestation. A 0.56°C
temperature rise observed in the 20th century indicates a serious alteration
in the climate of the region (Victoria et al., 1998). It is necessary to define whether this rise derived from deforestation or from GCC.
The temperature rise on its own causes many impacts such as changes in the water balance and a consequent higher probability of forest fires (Alencar et al., 2004).
Summarizing, studies and observations in the Amazon indicate a temperature increase for the next decades due to deforestation and GCC.
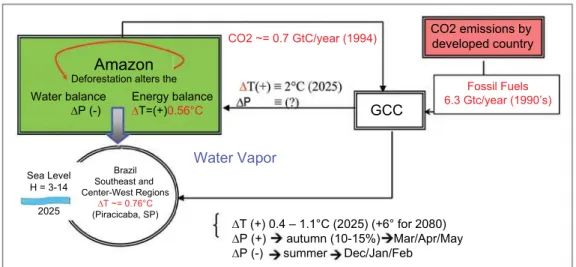
Also, precipitations are likely to decrease due to deforestation. However, the effects of GCC are not clear (Figure 8). For the Southeast and Center-West regions, there are forecasts of a temperature increase.
An increase in precipitations of approximately 10% to 15% is also expected during the autumn and a decrease during the summer.
Figure 8 – Possible climate variations for Brazil. Observed (red) and estimated (black) variations of precipitation and temperature tendencies in Brazil.
Impacts on biodiversity
for economic uses. Its different levels are not very well known or measured. Considering only the diversity of living beings, estimates range from 10 million to 100 million species. Scientists have described 1.7 million of these species so far. Therefore, there’s a huge challenge to be faced by researchers that intend to map global biodiversity. Most of what is left to be discovered is located in the American tropics; half of which is in Brazilian territory. The Amazon represents one of the most instigative scientific challenges for the global biodiversity inventory.
The quantification of Brazilian biodiversity is imprecise. The numbers of species, separated in large groups, vary according to the authors and,
therefore, they should be cautiously read. A first evaluation of the fauna species in biological collections registered around 200,000 species (at an interval of 180 to 225 thousand). Most of them were organized in large taxa whose classification in known species is still very incomplete. National fauna diversity would represent around 17% of the world’s biota, considering estimates that there are 2 million animal species in Brazil, with the exception of insects (Dias, 2001; Lewinsohn & Prado, 2000). According to data from Conservation International, there are about 55 thousand plant species in the country (22% of the world’s total), 524 mammal species (131 endemic ones), 571 amphibious species (294 endemic ones), 1,622 bird species (191 endemic ones) and 468 reptile species (172 endemic ones), besides three thousand fresh water fish species and around 10 to 15 million insect species.
Table 2 – Evaluation of Brazilian biodiversity
Kingdom Number of species - scientific collection
- Brazil
Number of estimated species - Brazil
Number of estimated species - planet
Viruses 400 55,000 400,000
Bacterium 1,400 136,000 1,000,000
Amphibious 150 600 4,220
Protozoa 3,200 27,000 200,000
Fungi 13,000 205,000 1,500,000
Algae 4,900 55,000 400,000
Plants 47,000 52,000 320,000
Arthropoda 116,000 1,214,999 8,900,000
Other invertebrates 9,700 116,000 850,000
Vertebrates 6,200 8,000 50,000
Current state of knowledge on the Amazon biodiversity
Although it is one of the most studied Brazilian biomes in the last decades, as to their ecological functioning, the different levels of the Amazon biodiversity are little known. According to estimates, 70% of the Amazon species do not have scientific names and, considering the current momentum of inventory works, this situation will last for a long time.
According to a study developed by Goeldi Museum, flora wealth comprises approximately 30,000 species, about 10% of the plants in the planet and around two-thirds of the flora from all other Brazilian biomes. In the diverse Amazon ecosystems, there are about 5,000 species of trees of more than 15 cm diameters; and the diversity of trees in terra-firma forests range from 40 to 300 different species per hectare.
Scientific collections state that 7,500 butterfly species are known around the world; 1,800 of them are in the Amazon. As to ants, who contribute with almost one-third of the animal biomass in the trees’ crowns of the Amazon, there are estimates of more than 3,000 species. With regard to bees, there are more than 30,000 described species in the world, 2,500 to 3,000 of which are in the Amazon. It is estimated that the fish fauna is superior to 1,300 species. In Rio Negro (Black River) alone 450 species have been registered. A total of 163 registers of amphibious species was found in the Brazilian Amazon. This figure corresponds to approximately 4% of the supposed 4,000 species in the world and 27% of the 600 species that supposedly exist in Brazil. The total number of reptile species in the world is estimated at 6,000 — around 240 species have been identified in the Brazilian Amazon, many of which are restricted to the Amazon or to part of it. The birds constitute one of the most studied groups of vertebrates, with the number of species in the world estimated at 9,700. In the Amazon, there are more than 1,000 species — 283 of them either have restricted distribution or are very rare. The total of mammals in the world is 4,650. In the Amazon, 311 species have already been registered. Even though it is the most notorious group of mammals in the Amazon, many species of primates have been discovered in the last years, including the black-crowned dwarf marmoset and the white-faced marmoset (Callithrix saterei).
Endangered species in Brazil
Cerrado (112), Marine (92), Campos Sulinos (60, Amazon – 58), Caatinga (43), and Pantanal (30). This means that, together, the Atlantic Forest and the Cerrado account for more than 78% of the species on the list, i.e., 495 taxa.
Amazon deforestation and loss of biodiversity
The loss of biodiversity is one of the fundamental environmental issues to Brazil throughout the 21st century. However, there are no reliable
calculations that assess the magnitude of this extinction. There is little doubt that the extinction is increasing and that a significant loss of tropical biodiversity will take place in the following decades, considering the current increase of the Amazon and Indonesia’s deforestation.
More species are currently being extinct than new ones are appearing. The current extinction rate is of one every 100 or 1,000 years, whereas in the fossil records the average species life expectancy used to be of 10 million years. We acknowledge that 724 species have become extinct since the year 1600. We also know that, around the Earth, 60 birds and mammals became extinct from 1900 to 1950. Knowing the exact extinction rate is very important to establish a biodiversity conservation policy.
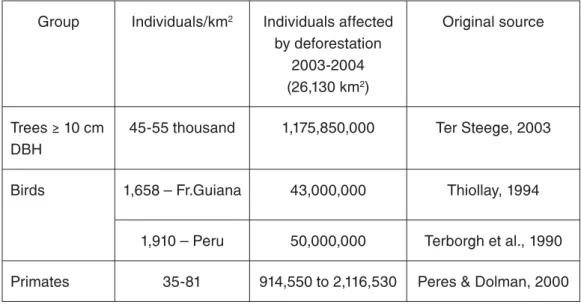
Quantifying the extinction rate of species in the Amazon, in absolute terms or in relation to the deforested area, is a hard task. How many endemic species are there? In what areas are they? How many endemic species are there per forest hectare? These figures are necessary for the calculation of the extinction rate in relation to the deforestation. There is an evaluation of the number of individuals affected by the deforestation per square kilometers (Table 3). Considering the very high endemism (in the plants they go up to 90%), it is inferred that the loss of species is significant.
Table 3 – Individuals affected by deforestation
Group Individuals/km2 Individuals affected by deforestation
2003-2004 (26,130 km2)
Original source
Trees 10 cm DBH
45-55 thousand 1,175,850,000 Ter Steege, 2003
Birds 1,658 – Fr.Guiana 43,000,000 Thiollay, 1994
1,910 – Peru 50,000,000 Terborgh et al., 1990
Studies on the extinction rate of birds, both resident and migratory, in forest fragments of the Amazon show that the time to extinction is correlated with the fragment area. In order to decrease the extinction rate by a factor of 10 in a specific fragment, it is necessary to increase its area by a factor of 1,000, that is, forest fragments with an area of 100 hectares lose half of their species in 15 years, a very short time for the implementation of serious conservation measures (Ferraz et al., 2003).
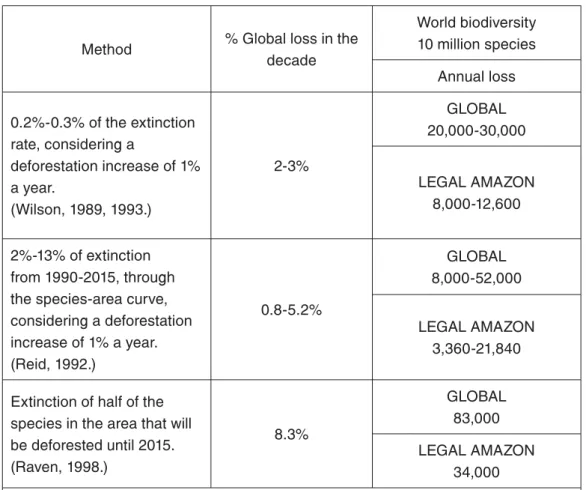
Table 4 shows the author’s evaluation of the extinction rate in the
Amazon, based on three previous evaluations of the percentage of species that became extinct in the decade of 2000 in global tropical forests. We assume that: the area of the Amazon Basin is of 6.5 million km2, the area of the planet
originally covered with tropical forests was 15.5 million km2; and the numbers
of species present in the diverse tropical forests are comparable.
Table 4 – Extinction rate in the Amazon
Method % Global loss in the decade
World biodiversity 10 million species
Annual loss
0.2%-0.3% of the extinction rate, considering a
deforestation increase of 1% a year.
(Wilson, 1989, 1993.)
2-3%
GLOBAL 20,000-30,000
LEGAL AMAZON 8,000-12,600
2%-13% of extinction from 1990-2015, through the species-area curve, considering a deforestation increase of 1% a year. (Reid, 1992.) 0.8-5.2% GLOBAL 8,000-52,000 LEGAL AMAZON 3,360-21,840
Extinction of half of the species in the area that will be deforested until 2015. (Raven, 1998.) 8.3% GLOBAL 83,000 LEGAL AMAZON 34,000
The percentage of loss has been obtained by each of the authors through the following equation S=K.A2, in relation to the species-area curve.
Note
1 The original paper including the water balance calculations in 12 Brazilian cities and four different global climate change scenarios and graph representations was developed as a request of the Center for Strategic Management and Studies (CGEE – Centro de Gestão e Estudos Estratégicos) in May 2004.
Bibliography
ALENCAR, A. et al. Desmatamento na Amazônia: indo além da “Emergência Crônica”. Belém: IPAM – Instituto de Pesquisa Ambiental da Amazônia, 2004. ANDREAE, M. O. et al. Smoking Rain Clouds over the Amazon.Science, v.303, p.134245, 2004.
ARTAXO, P. O papel das partículas de aerossóis no ciclo hidrológico da Amazônia, 2005 (not published).
ARTAXO, P. et al. O mecanismo da floresta para fazer chover. Scientific American Brasil, v.1, n.11, p.38-45, 2003.
BIODIVERSITAS. Lista da fauna brasileira ameaçada de extinção. Organização de Ângelo B. Machado. Belo Horizonte: Fundação Biodiversitas, 2005.
COSTA, M. H. et al. Effects of large-scale changes in land cover on the discharge of theTocantins River, southeastern Amazonia.J. Hydrol., p.283, 206-17, dio-10.1016/
S0022-1694 (03) 00267-1, 2003.
DALL’OLIO, A. et al. Modelo de francionamento isotópico da água na Bacia Amazônica.Acta Amazônica, v.9, n.4, p.675-87, 1979.
DIAS, B. F. S. Balanço da biodiversidade na Amazônia: uma introdução ao
desconhecido. Seminário Especial: “A Biodiversidade como Estratégia Moderna de Desenvolvimento da Amazônia”.Estudos e Pesquisas, INAE - Instituto Nacional de Altos Estudos,Rio de Janeiro, n.17, set. 2001.
GASH, J. H. C. et al. Amazon Reforestation and Climate. New York: John Wiley and
Sons, 1996.
FERRAZ, G. et al. Rates of species loss from Amazonian forest fragments. PNAS, v.100,n.24, p.14069-73, 2003.
HERDIES, D. L. et al. The Bi-Modal Pattern of the Summer Circulation Over South América.Journal of Geophysical Research, 2001 (not published).
IPCC.Climate Change. The Scientific Basis. Executive Summary. Cambridge University Press, 2001.
KOREN, I. et al. Measurement of the Effect of Amazon Smoke on Inhibition of Cloud Formation. Science, v.303, p.1337-42, 2004.
LAURENCE, W.; VASCONCELOS, H. A década da decisão para a Amazônia.
Opiniões. PDBFF. Inpa, 2004.
MARENGO, J. A. Cenários climáticos para a América do Sul: projeções dos AOGM
Globais do IPCC. 2005 (not published).
MARGULIS, S. Causas do desmatamento da Amazônia brasileira. Brasília: Séries Banco Mundial, 2003. 100p.
MARQUES, J. et al. O campo do fluxo de vapor d’água atmosférico sobre a Região Amazônica.Acta Amazônica, v.9, n.4, p.701-13, 1979.
MMA. GEOBRASIL – Environmental Outlooks in Brazil. Organização de Tereza C.
de Carvalho e João B. D. Câmara. Brasília: Ibama, 2002.
MOLION, L. A Climatonomic Study of the Energy and Moisture Fluxes of the Amazon Basin with Consideration on Deforestation. Madison, 1975. Dissertation (Ph.D.) – University of Wisconsin.
PERES, C.; DOLMAN, P. M. Density Compensation in Neotropical Primate Communities: Evidence from 56 Hunted and Nonhunted Amazonian Forests of Varying Productivity. Oecologia, n.122, p.175-85, 2000.
REID, W. R. How many species will there be?Ed. T. C. Whitmore and J. A. Sayer. New York: Chapman and Hall. 1992. Chapter 3 “Tropical deforestation and species extinction”.
SALATI, E. Impactos das mudanças climáticas globais em algumas regiões do Brasil através do estudo da variação do balanço hídrico. In: “Cenários Climáticos do Semi-árido em Implicações para o Desenvolvimento do Nordeste”. Workshop in Fortaleza on 11.24.2004. Available at: www.fbds.org.br.
SALATI, E.; MARQUES, J. Climatology of Amazon Region. In: SIOLI, H. (Ed.)
TheLimnology and landscape-ecology of a mighty river and its Basin. Dordrecht, Junk Publishers, 1984. p.85-126.
SALATI, E.; NOBRE, C. A. Possible Climatic Impacts of Tropical Deforestation.
Climatic Change, v.19, p.177-96, 1991.
SALATI, E.; VOSE P. B. Amazon Basin: a system in equilibrium. Science, v.225, p.129
38, 1984.
SALATI, E. et al. Origem e distribuição das chuvas na Amazônia.Interciência, v.3, n.4, p.200-6, 1978.
___________. Recycling of Water in the Amazon, Brazil: an isotopic study. GeophysicalResearch. Water Resources Research, v.15, n.5, p.1250-8, 1979.
SILVA DIAS, M. A. F. et al. Aerosols impact clouds in the Amazon Basin. GEWEX
Newsletter, v.14, n.4, p.4-6, 2004.
SILVA DIAS, P. L.; MARENGO, J. A. Águas atmosféricas. In: Águas doces do Brasil
–Capital ecológico, uso e conservação. São Paulo: Instituto de Assuntos Avançados
–USP, Escrituras, 1999.
TABARELLI, M. et al. Forest Fragmentation, synergisms and the Impoverishment of Neotropical Forest. Biodiversity and Conservation, v.13, p.1419-1425, 2004.
TER STEEGE, H. (Ed.) Long-term changes in tropical tree diversity: Studies from theGuiana Shield, Africa, Borneo and Melanesia. The Netherlands: Tropenbos International,Wageningen, 2003. 215p. (Tropenbos Series 22).
THIOLLAY, J. M. Structure, Density and Rarity in an Amazonian Rainforest Bird
Community. Journal of Tropical Ecology, n.10, p.449-81, 1994.
VICTORIA, R. L. et al. Surface Air Temperature Variations in the Amazon Region andIts Borders during This Century. American Meterological Society, v.11, n.5, p.1105-10,1998.
VILLA NOVA, N. A. et al. Estimativa de evapotranspiração na Bacia Amazônica.Acta
Amazônica, v.6, n.2, p.215-28, 1976.
VILLA NOVA, N. A. et al. Variações climáticas em Piracicaba de 1917 a 2003. 2004
(FBDS internal report).
WILSON, O. E. Global Biodiversity Map. Science, v.29, p.289, 2000.
ZILLER, S. R. Espécies exóticas invasoras e restauração de áreas degradadas. Instituto
Hórus de Desenvolvimento e Conservação Ambiental. 2000. Available at:<www. institutohorus.org.br>.
A
BSTRACT —This paper indicates the environmental issues that must necessarily beapproached, in Brazil, in a near future (2022). A study on some aspects of the effects of deforestation and Global Climate Change has been developed. A temperature rise around 0.78% was observed from 1917 to 2003 in the region of Piracicaba. For the Amazon region a rise of 0.56% was observed in the 20th Century. The existing
information indicates that not only deforestation but also Global Climate Changes act upon temperature rise. Deforestation has direct influence on precipitation decrease. The consequences of Global Climate Change are still unknown; some models indicate a precipitation rise and others a decrease. Deforestation also causes great biodiversity loss, estimated between 8,000 to 34,000 species, considering a deforestation increase of 1% a year.
K
EYWORDS:Temperature Rise, Precipitation, Deforestation, Amazon, Global Climate Change, Biodiversity, Biodiversity in the Amazon, Extinction Rate.Eneas Salatiis technical director of the Brazilian Foundation for Sustainable Development (FBDS). @ – [email protected].
Ângelo Augusto dos Santos is biodiversity coordinator of the Brazilian Foundation for Sustainable Development (FBDS). @ – [email protected].
Israel Klabin is the president of the Brazilian Foundation for Sustainable Development (FBDS). @ – [email protected].
Translated by Cecília Mattos. The original in Portuguese is available at http://www. scielo.br/scielo.php?script=sci_issuetoc&pid=0103-401420060001&lng=pt&nrm=iso.