RICARDO RIBEIRO DE CASTRO SOLAR
EFFECTS OF LAND-USE CHANGE ON TROPICAL FOREST BIODIVERSITY: A MULTI-SCALE ASSESSMENT IN THE BRAZILIAN
AMAZON
Tese apresentada à Universidade Federal de Viçosa, como parte das exigências do Programa de Pós-Graduação em Entomologia, para a obtenção do título de Doctor Scienciae.
VIÇOSA
MINAS GERAIS – BRASIL 2014
Ficha catalográfica preparada pela Seção de Catalogação e Classificação da Biblioteca Central da UFV
T
Solar, Ricardo Ribeiro de Castro, 1985-S684e
2014
Effects of land-use change on tropical florest biodiversity : a multi-scale assessment in the Brazilian Amazon / Ricardo Ribeiro de Castro Solar. – Viçosa, MG, 2014.
xix, 161 f. : il. (algumas color.) ; 29 cm.
Texto em inglês.. Inclui apêndices.
Orientador: José Henrique Schoereder.
Tese (doutorado) - Universidade Federal de Viçosa. Inclui bibliografia.
1. Biodiversidade - Conservação - Amazônia. 2. Solo - Uso - Amazônia. 3. Besouro. 4. Formiga. 5. Abelha. I. Universidade Federal de Viçosa. Departamento de Entomologia. Programa de Pós-Graduação em Entomologia. II. Título.
“Do not go where the path may lead; go instead where there is no path and leave a trail.”
AGRADECIMENTOS
À Universidade Federal de Viçosa, ao Departamento de Entomologia e ao
Programa de Pós-Graduação em Entomologia. Agradeço aos Professores e
funcionários cujo trabalho e dedicação permitem que os trabalhos sejam
desenvolvidos.
Ao Conselho Nacional de Desenvolvimento Científico e Tecnológico (CNPq)
pela concessão da bolsa de Doutorado, taxa de bancada e pelo financiamento do
período de Doutorado Sanduíche (dentro do âmbito do Programa Ciência sem
Fronteiras). Todos estes recursos foram vitais para a boa execução do trabalho
apresentado.
À EMBRAPA – Amazônia Oriental (SEG:02.08.06.005.00), Instituto
Nacional de Ciência e Tecnologia – Biodiversidade e Uso da Terra na Amazônia
(CNPq 574008/2008-0), Museu Paraense Emílio Goeldii, Universidade Federal de
Lavras, Universidade Estadual do Pará, The Nature Conservancy, IMAZON, UK
government Darwin Initiative (17-023), University of Cambridge, Lancaster
University, NERC e todas as demais instituições que abrigaram ou financiaram o
desenvolvimento deste trabalho.
À Rede Amazônia Sustentável e todos os seus centenas de integrantes. Fazer
parte de uma rede colaborativa de pesquisa com tantas instituições trouxe suporte e
aprendizado para o trabalho que desenvolvi. Agradeço a todos os colegas de trabalho,
cujos nomes seria injusto mencionar, dado o risco de a memória não fazer a devida
justiça. A convivência com cada um de vocês tornou este trabalho possível. Agradeço
também aos inúmeros produtores das cidades de Paragominas e Santarém que
permitiram as coletas e nos cederam “ganchos para as redes” e dividiram conosco
suas casas e mesas. Especialmente agradeço aos orientadores externos, Dr. Jos
Barlow e Dr. Toby Gardner, grandes homens e pesquisadores com quem tive o prazer
de conviver e trabalhar.
Aos mais que colegas de trabalho, amigos dos laboratório e offices onde
passei nesse tempo, que participaram e participam desta etapa. Thank you all guys
from Tropical Research Group and from the Lancaster crew, you helped me to
survive – and indeed enjoy – the harshest weather I’ve ever experienced. A special
mention is nevertheless necessary to my dear friends Erika and Darren Lloyd
Aos colegas que ajudaram no “trabalho hercúleo” de triar e identificar os
centenas de milhares de insetos coletados na tese. Júlio Chaul, Dra. Vanesca
Korasaki, Dra. Márcia Maués, Talyanne Moura, André Muccida, Letícia Helena,
Fernanda Tanure, Dr. Fernando Vaz-de-Mello, Dra. Vivian Sandoval, Dr. André
Nemésio, Dr. Rodrigo Feitosa. A ajuda de cada um de vocês foi certamente
imprescindível e a minha gratidão pelo suporte não cabe somente em palavras.
Aos professores Frederico Neves, Flávia Maria do Carmo e Ricardo Campos,
por terem aceito o convite de integrarem a banca avaliadora desta tese. Certamente os
comentários e sugestões que trazem enriquecerão o trabalho.
Aos professores e coorientadores. Tathiana Sobrinho, Carlos Sperber, Júlio
Louzada, Joice Ferreira, Og de Souza, Lúcio Campos e demais mestres que me
mostraram muitos caminhos que ao trilhá-los encontrei subsídios para tonar esta tese
possível.
To my co-authors hereby alphabetically listed: Alexander Lees, Carla Ribas,
Erika Berenguer, Ima Célia Vieira, James Thomson, Joice Ferreira, Jos Barlow, José
Schoereder, Júlio Chaul, Júlio Louzada, Márcia Maués, Nárgila Moura, Ralph Mac
Nally, Toby Gardner and Victor Oliveira. I am really grateful for the invaluable
suggestion you gave.
Ao meu orientador, Prof. José Henrique Schoereder (Zhé). São incontáveis as
marcas de suas contribuições ao cientista que me tornei. Seu exemplo de caráter e
ética profissional me fazem sentir um profissional capaz de enfrentar de forma mais
justa e honesta os percalços da carreira.
À minha família, mas em especial à “Dona Cotinha”! Mãe, a gente conseguiu!
Ao meu pai, de quem hoje muito alegre me orgulho do exemplo de superação. À
Paulinha, minha irmã querida! Aos meus tios Welton e Lídia, primos e demais tios,
por todo apoio durante minha vida. Por fim, mas não menos importante à Ana Paula
pelo companheirismo, doçura e força para superarmos juntos as diversas fases destes
SUMÁRIO
LISTA DE FIGURAS ... ix
LISTA DE TABELAS ... xiii
RESUMO ... xvi
ABSTRACT ... xviii
GENERAL INTRODUCTION ... 1
CHAPTER 1 ANTS, ORCHID BEES AND DUNG BEETLES DIVERSITY AND DISTRIBUTION IN DIFFERENT LAND-USE TYPES OF PARAGOMINAS, AMAZONIA, PA, BRAZIL. Abstract ... 8
Introduction ... 10
Material & Methods ... 12
Study site ... 12
Insect sample ... 13
Statistical analyses ... 14
Results ... 15
Ants ... 15
Orchid bees ... 16
Dung beetles ... 16
Patterns of species richness and evenness in different land-uses ... 17
Discussion ... 18
Conclusion ... 21
References ... 22
CHAPTER 2 LAND-USE ERODES REGIONAL DIVERSITY AND SHIFTS COMPOSITION OF ANT COMMUNITIES IN THE BRAZILIAN AMAZON Abstract ... 59
Introduction ... 61
Material & Methods ... 63
Ant sample ... 64
Environmental variables ... 65
Statistical analyses ... 65
Results ... 69
Question 1: Species composition ... 69
Question 2: How does species richness and diversity respond to land-use changes? ... 69 Question 3: What variables are better predictors of ant diversity in human- modified tropical forest landscapes? ... 69
Discussion ... 70
Conclusion ... 73
References ... 75
CHAPTER 3 IS BIOTIC HOMOGENIZATION WIDESPREAD IN HUMAN-MODIFIED TROPICAL FORESTS? Abstract ... 102
Introduction ... 104
Material & Methods ... 107
Sampling region ... 107
Sampling design ... 107
Data analyses ... 108
Diversity partitioning ... 108
Decomposition of β-diversity ... 109
Statistical analyses ... 110
Results ... 111
Patterns of species richness (α and γ diversities) across land-use classes ... 111
Patterns of species β-diversity ... 112
Relative importance of processes underlying β diversity ... 112
Discussion ... 113
Relative contribution of species loss and turnover in determining patterns of biotic homogenization
... 116
Conclusion ... 118
References ... 119
GENERAL CONCLUSION ... 136
Appendix I ... 138
LISTA DE FIGURAS
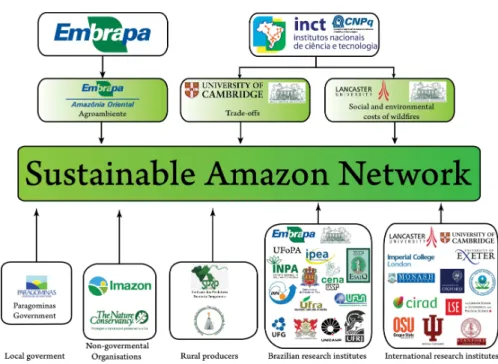
Figure Intro 1 Collaborative scheme of the Sustainable Amazon Network. It was
leaded by EMBRAPA and INCT, through an international partnership.
Several governmental, society and research organisation worked
together to generate the data ………. 2
Figure C1.1 Map of the sampling region and sampling design. We stratified our
sampling at: regional, catchment and transect scales ………. 34
Figure C1.2 Species accumulation curves for the three studied taxonomic groups.
Each curve was drawn after 10.000 randomisations of original data and
the shaded area represents the standard deviation. In the x axis we have
number of sampled transects, in the y axis, accumulated species
richness ………... 35
Figure C1.3 Boxplots of average species richness per transect as response variable
plotted against land-use type. Letters above bars represent significant
differences among levels within the factor. PFU – undisturbed primary
forest, PFL – logged primary forest, PFLB – logged and burnt primary
forest, SEF – secondary forest, REF – reforestation (silviculture), PAS
– pasture and AGR – mechanised agriculture. We considered
significant those probabilities under 5% ……… 36
Figure C1.4 Boxplots of average species evenness per transect as response variable
plotted against land-use type. Evenness was measured as Smith &
Wilson (1996) Evar. Letters above bars represent significant differences
among levels within the factor. PFU – undisturbed primary forest, PFL
– logged primary forest, PFLB – logged and burnt primary forest, SEF
– secondary forest, REF – reforestation (silviculture), PAS – pasture
and AGR – mechanised agriculture. We considered significant those
Figure C2.1 Map of Paragominas region and sampling design representation. The
region is located in Para state, north Brazil. In the map, the pink
colours represent non-forest habitats, while the green colour represent
forests of any kind (Primary or secondary). A detail of a catchment
sampled and the transect design are represented in the boxes
…………..…………..………..…………..…………. 89
Figure C2.2 NMDS map of species composition according aboveground biomass
(point sizes) and land-use types (point colours). We analysed
significance PERMANOVA ……….. 90
Figure C2.3 Relationship between species richness and land-use class. In (A) we
provide boxplots with results for transect scale species richness.
Colours are only to distinguish between forest transects and production
landscapes. On the top of the bars, those grouped under the same letter
code are statistically similar. In (B) we present species accumulation
curves per land-use, rarefied to eight as the minimum comparable
sampling effort. Shaded polygons around each curve represent 95%
confidence intervals. Significant relationships were considered with
P<0.05 ……… 91
Figure C2.4 Positive relationship between catchment species richness and primary
forest cover at catchment scale (PFP(c)), as depicted in model
averaging. There is a positive trend between the variables and PFP(c)
Figure C3.1 Map of the sampling region and sampling design. In the map, the pink
colours represent non-forest habitats, while the green colour represent
forests of any kind (Primary or secondary). We stratified our sampling
within three spatial scales that are: regional, catchment and transect. In
each transect all five taxa were sampled according the figure
……… 128
Figure C3.2 α and γ components of diversity. Diversity is expressed as average species richness per taxon and within each land use class. In a) α
diversity, as the species richness at the transect scale and in b) γ
diversity, as the pooled species richness at the regional scale. Different
colours express forest and non-forest land-uses, we used P<0.05 as
significant and errors bars are standard errors ………. 129
Figure C3.3 Panel with diversity components shown to all taxa across all land-use
classes after resampling. First row (a), shows α diversity (i.e. average number of species per transect). The second and third rows (b and c)
are β-diversity at among-transects and among-catchments,
respectively. Finally, γ-diversity is in the fourth line (d). Different colours express forest and non-forest land-uses, we used P<0.05 as
significant and error bars represent standard errors and when they are
missing we could only calculate a single value ……… 130
Figure C3.4 β diversity at among transects and among catchment scales. β diversity
was calculated as the multiplicative Wittaker’s β and sampling size is
standardized through the data via resampling all land use classes to the
same sample size. Data is presented as average β diversity per taxon and within each land use class. a) is β diversity among transects in a catchment and b) is the β diversity among catchments in a region. Different colours express forest and non-forest land-uses, we used
P<0.05 as significant and in the values and errors bars are standard
Figure C3.5 Percentage contribution of the nestedness component to the total beta
diversity observed at among transects and among catchment scales.
Decomposition was computed following Baselga (2010) procedure
(βNES= βSOR- βSIM) and standardized through the data via resampling all land use classes to the same sample size. Data is presented as average
percentage contribution of the nestedness component per taxon and
within each land use class. (a) is the decomposition of beta diversity
among transects in a catchment and (b) is the decomposition of beta
diversity among catchments in a region. Different colours express
forest and non-forest land-uses, we used P<0.05 as significant and in
LISTA DE TABELAS
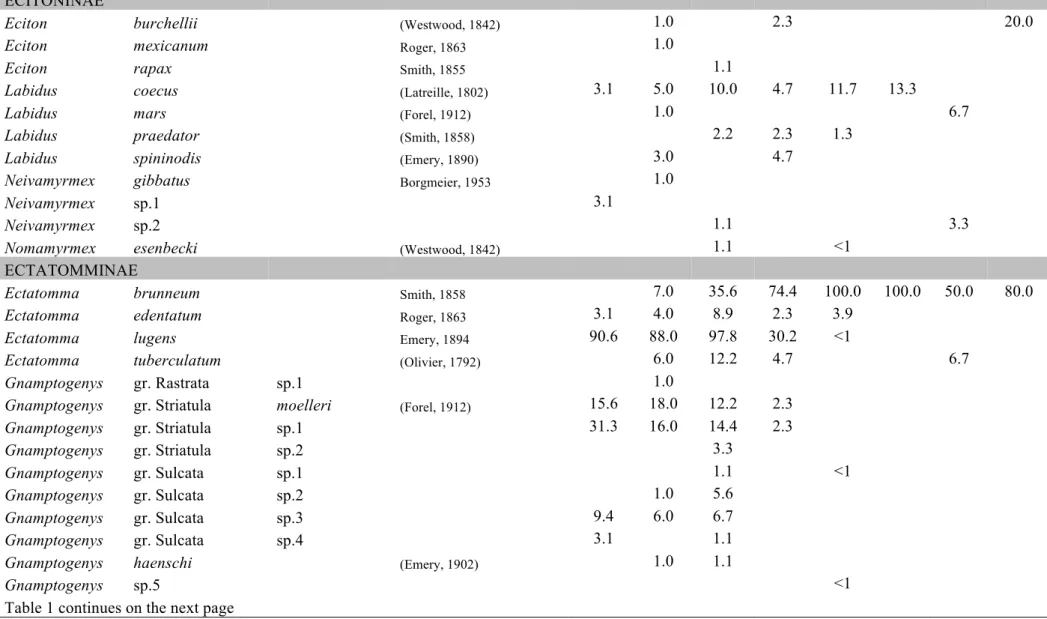
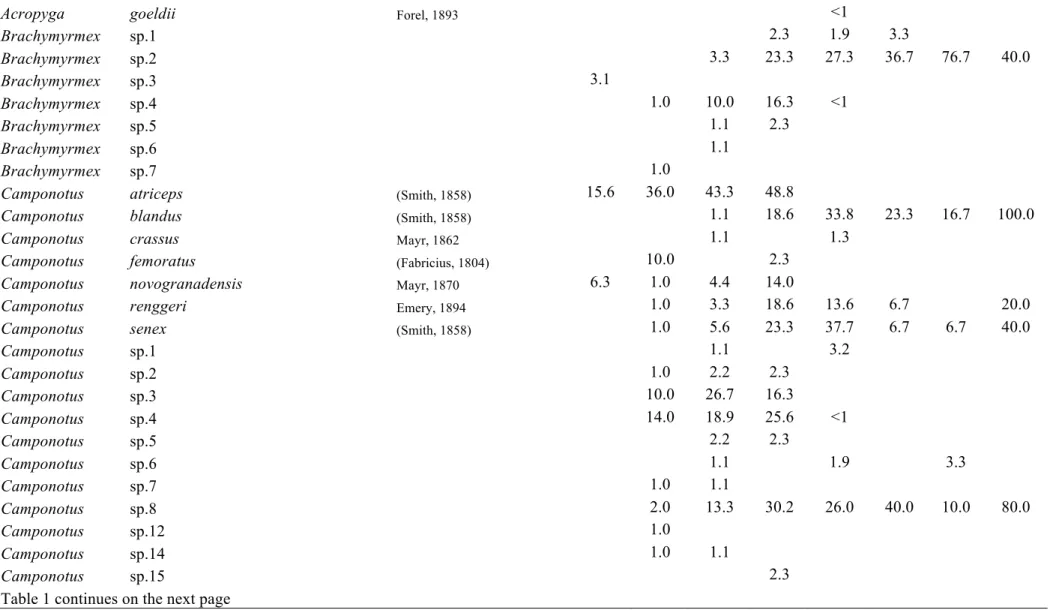
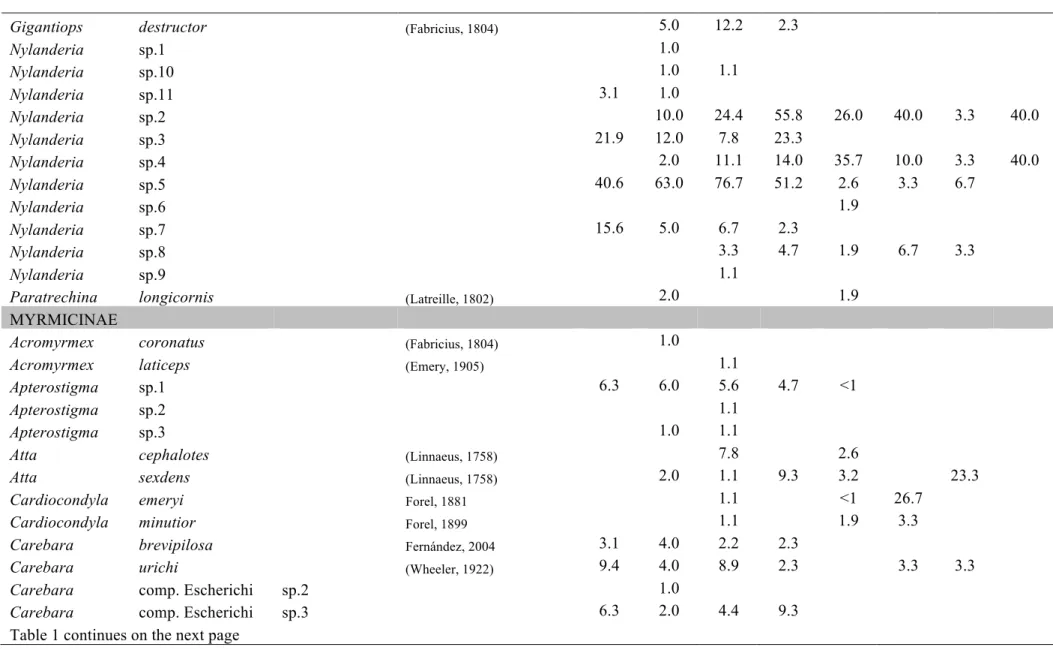
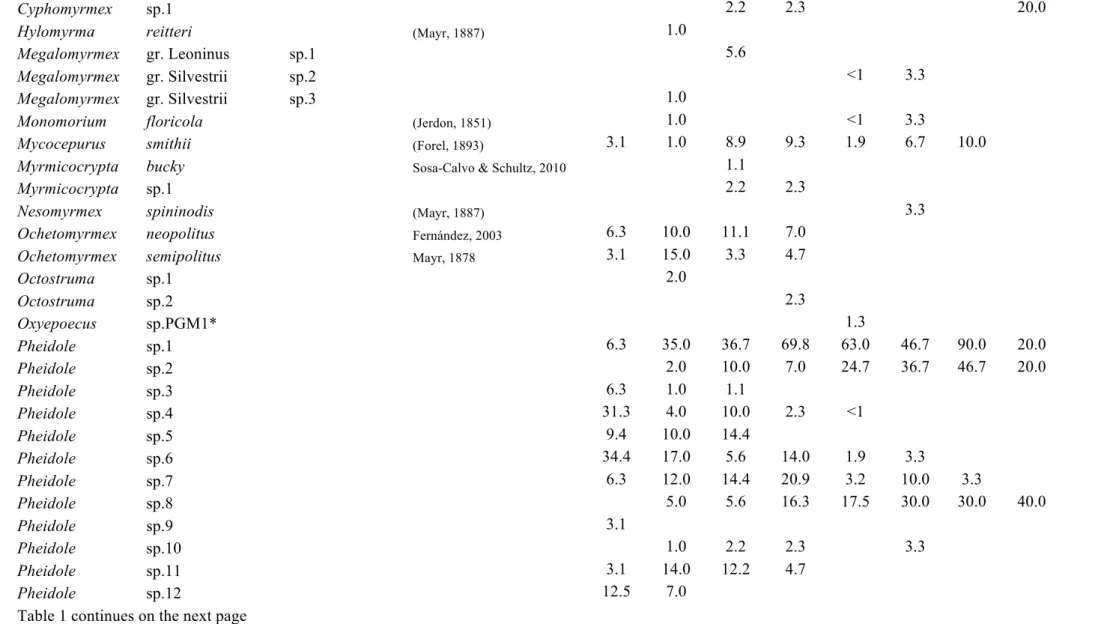
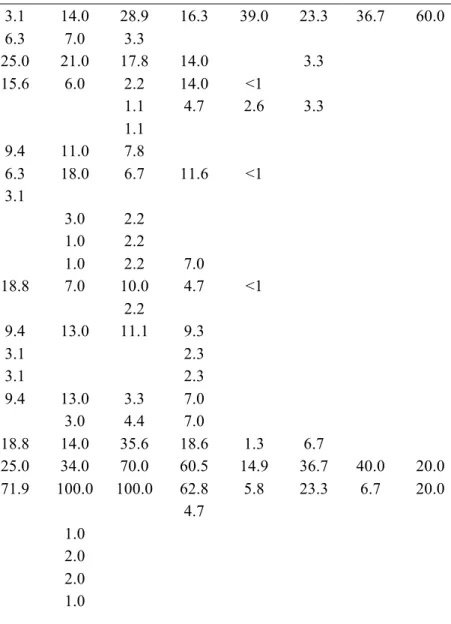
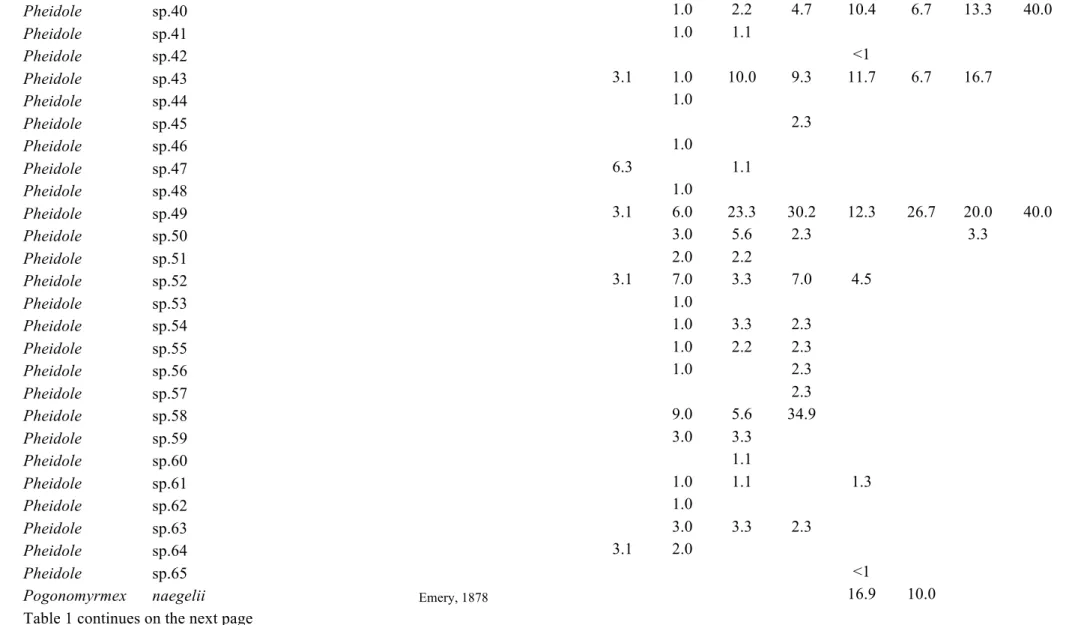
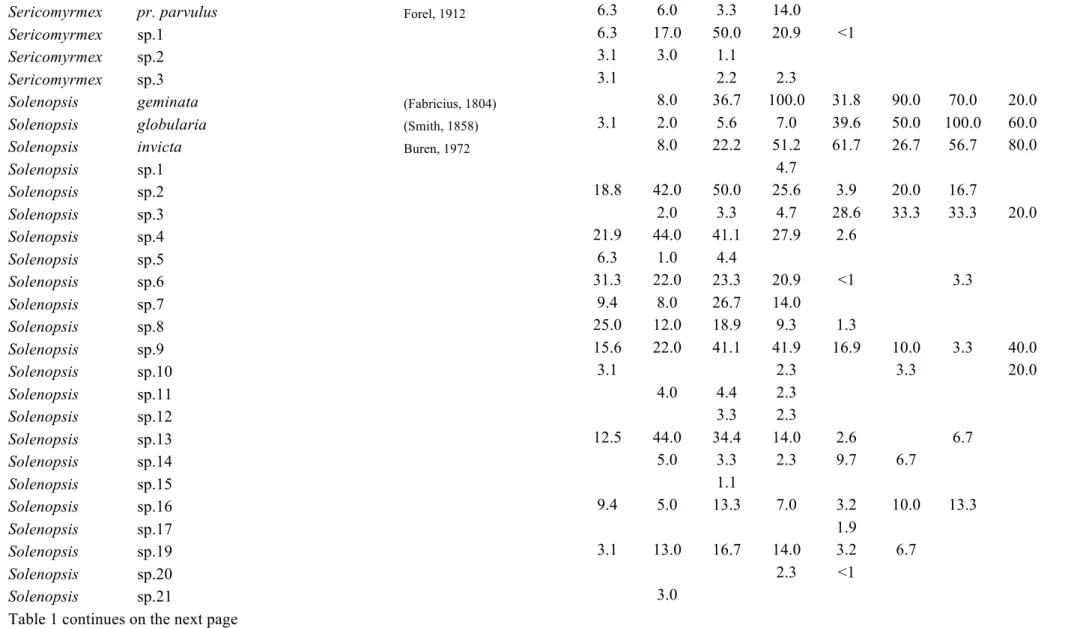
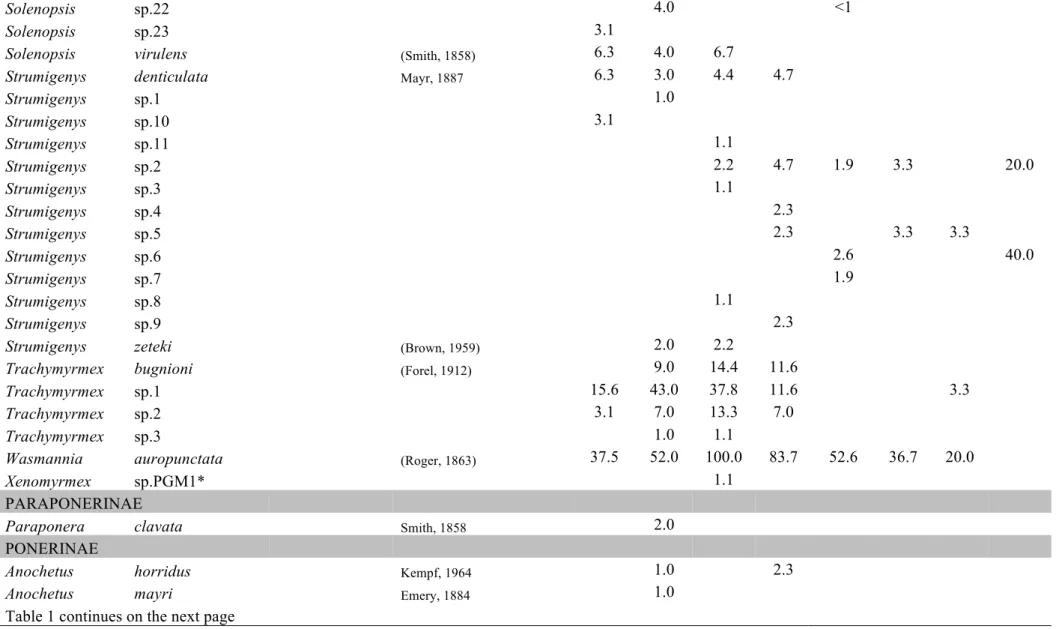
Table C1.1 List of ant species collected in this study. Values represent the relative
frequencies (%) of each species in each land-use type: PFU – primary
forest undisturbed, PFL – primary forest logged, PFLB – primary
forest logged and burnt, SEF – secondary forest, REF – reforestation
with commercial species, PAS – pasture, AGR – agricultural areas, AP
– abandoned plantation, SHA – small holder agriculture. The last
land-use type present in the table is not land-used in analyses, as it was
represented by very few transects ………... 39
Table C1.2 List of orchid bees species collected in this study. Values represent the
relative frequencies (number of individuals) of each species in each
land-use type: PFU – primary forest undisturbed, PFL – primary forest
logged, PFLB – primary forest logged and burnt, SEF – secondary
forest, REF – reforestation with commercial species, PAS – pasture,
AGR – agricultural areas, AP – abandoned plantation, SHA – small
holder agriculture. The last land-use type present in the table is not
used in analyses, as it was represented by very few transects ……… 51
Table C1.3 List of dung beetles species collected in this study. Values represent
the relative frequencies (number of individuals) of each species in each
land-use type: PFU – primary forest undisturbed, PFL – primary forest
logged, PFLB – primary forest logged and burnt, SEF – secondary
forest, REF – reforestation with commercial species, PAS – pasture,
AGR – agricultural areas, AP – abandoned plantation, SHA – small
holder agriculture. The last land-use type present in the table is not
used in analyses, as it was represented by very few transects …….... 53
Table C2.1 Variables sampled in this study, followed by the acronym adopted,
scale they were sampled and brief description of methods. Details
Table C2.2 Model averaging results for transect scale species richness. All
candidate models within ΔAICc<4 had their coefficients and relative importance values averaged and estimates of all parameters is
provided, as well as standard error (SE) and confidence intervals (CI).
Relative importance values are also shown (RIV). CC – canopy cover,
FWD – fine wood debris, LB – litter biomass, PFP(t) – primary forest
percentage at transect scale, SBD – soil bulk density, FCCP(t) –
deforestation trajectory at transect scale, LUC – Land-use class, df –
degrees of freedom ………. 86
Table C2.3 Model averaging results for catchment scale species richness. All
candidate models within ΔAICc<4 had their coefficients and relative importance values averaged and estimates of all parameters is
provided, as well as standard error (SE) and confidence intervals (CI).
Relative importance values are also shown (RIV). PFP(c) – primary
forest percentage at catchment scale, SBD – soil bulk density, FCCP –
deforestation trajectory ………... 87
Table C2.S1 Complete set of models generated by multimodel selection procedure
for transect species richness in forest transects. Here a listed all
possible variables in the models, followed by model R2, degrees of
freedom (df), model log-likelihood (logLik), AICc and ΔAICc and
finally model weight (ω). FWD – fine wood debris, LB – litter biomass, CC – canopy cover, FCCP – deforestation profile, PFP(t) –
primary forest percentage in a 500m buffer, SBD – soil bulk density.
………..……….. 93
Table C2.S2 Complete set of models generated by multimodel selection procedure
in production landscapes transects. Here a listed all possible variables
in the models, followed by model R2, degrees of freedom (df), model
log-likelihood (logLik), AICc and ΔAICc and finally model weight
(ω). FWD – fine wood debris, LB – litter biomass, CC – canopy cover,
FCCP – deforestation profile, PFP(t) – primary forest percentage at a
Table C2.S3 Complete set of models generated by multimodel selection procedure
for catchment species richness. Here a listed all possible variables in
the models, followed by model R2, degrees of freedom (df), model
log-likelihood (logLik), AICc and ΔAICc and finally model weight (ω). LB – litter biomass, FCCP_Catch – deforestation profile at the
catchment scale, PFP(c) – primary forest percentage in a catchment,
SBD – soil bulk density ……….. 99
Table C3.1 List of sampled land-uses in both municipalities. Acronyms for each
land-use are also clarified here, as well as the maximum number of
transects of each land-use class sampled in each region. PGM states for
Paragominas and STM states for Santarém ……….. 125
Table C3.S1 Mantel tests results detailed for each taxon. Mantel statistic is result of
species Bray-Curtis dissimilarities against geographical distances
RESUMO
SOLAR, Ricardo Ribeiro de Castro, D.Sc., Universidade Federal de Viçosa, março
de 2014. Efeitos de mudanças no use da terra sobre a biodiversidade de florestas
tropicais: uma avaliação em múltiplas escalas na Amazônia Brasileira.
Orientador: José Henrique Schoereder. Coorientadores: Tathiana Guerra Sobrinho e Carlos Frankl Sperber.
A Amazônia Brasileira compreende cerca de 40% das florestas tropicais do
globo, abrigando uma enorme parte da biodiversidade mundial. Todavia, taxas
alarmantes de desmatamento são encontradas por toda a região amazônica.
Demandas cada vez mais altas por recursos naturais são uma das maiores ameaças a
este ecossistema e portanto conservacionistas necessitam de informações precisas
sobre a biodiversidade e processos do ecossistema, bem como dados da esfera
socioeconômica. Dentro das necessidades desta agenda, uma iniciativa de pesquisa
denominada Rede Amazônia Sustentável foi desenvolvida. O objetivo desta rede é
gerar dados que possam subsidiar planos de conservação para a região. Esta tese traz
os resultados de alguns dos objetivos ligados à biodiversidade componentes desta
rede. No primeiro capítulo nosso objetivo é fornecer a mais completa lista de
espécies até o momento de formigas, abelhas de orquídeas e besouros rola-bostas
para a região de Paragominas, bem como descrever os padrões de diversidade de
espécies ao longo do gradiente de uso da terra da região. No segundo capítulo, nosso
objetivo é responder à pergunta de como as mudanças no uso da terra alteram a
composição e a riqueza da comunidade de formigas em Paragominas? Também é
nosso objetivo explorar quais os fatores ambientais regula a riqueza de espécies de
formigas em escalas local e regional. Por fim, para o terceiro capítulo nossa pergunta
é até que ponto existe um processo em andamento de homogeneização biótica
acontecendo em consequência do processo de desflorestamento e degradação
florestal? Para tal, pesquisamos cinco taxa (plantas, aves, besouros rola-bostas,
formigas e abelhas de orquídeas), nos municípios de Paragominas e Santarém. Os
resultados do primeiro capítulo incluem a lista de espécies, a qual esperamos possa
ser uma referência para estudos de monitoramento do estado de conservação, bem
como iniciativas de recuperação florestal, as quais estão em fase inicial em
Paragominas. Ainda, encontramos que a diversidade de espécies dos três grupos
(formigas, besouros e abelhas) foi reduzida pelo desflorestamento e degradação
espécies da comunidade de formigas com a mudança no uso da terra, bem como um
processo de perda de espécies. Estes padrões de riqueza são principalmente
explicados pela cobertura de floresta primária remanescente, que foi uma importante
variável na explicação dos padrões encontrados. Por fim, no terceiro capítulo
encontramos um padrão geral de perda de espécies em escala local com a
intensificação do uso da terra. Por outro lado, em escalas maiores, só observamos
perda de espécies quando comparamos áreas florestas versus áreas não florestais. Os
padrões de diversidade β só foram afetados pelo uso da terra em escalas menores (entre locais), sendo que a mesma é maior em áreas florestais e menor em áreas
desflorestadas. Há entretanto um padrão marcado de maior contribuição de
aninhamento para a diversidade β em áreas não florestais em ambas as escalas. Portanto, como conclusão geral, encontramos que as mudanças no uso da terra
implementadas pelo uso humano estão depauperando a biodiversidade e que, se
nenhuma ação for tomada prontamente para proteger as áreas ainda existentes de
floresta primária, podemos testemunhar um processo ainda mais severo de perda de
espécies. Como uma rede de pesquisa multidisciplinar, esperamos que os resultados
apresentados nesta tese possam compor estratégias conjuntas, considerando as
esferas ecológicas e sociais, os quais podem culminar em um processo mais razoável
ABSTRACT
SOLAR, Ricardo Ribeiro de Castro, D.Sc., Universidade Federal de Viçosa, March, 2014. Effects of land-use change on tropical forest biodiversity: a multi-scale assessment in the Brazilian Amazon. Advisor: José Henrique Schoereder. Co-advisors: Tathiana Guerra Sobrinho and Carlos Frankl Sperber.
The Brazilian Amazon comprises around 40% of all tropical forests in the
world, harbouring a gigantic part of the world’s biodiversity. Yet, alarming rates of
deforestation are spread across the Amazon. Increasing rates of resource demands
harm this ecosystem and conservationists need precise information about
biodiversity and ecosystem processes, as well as socioeconomic data. Within the
needings of this agenda, a research initiative called Sustainable Amazon Network
was developed, aiming to generate data that can foster conservation plans for the
regions. This thesis brings results regarding some of the biodiversity aims of this
research network. In the first chapter we aim to provide the most comprehensive
species list of ants, orchid bees and dung beetles to date to the region of
Paragominas, as well as describe patterns of species diversity across the different
land-use types in the region. In the second chapter, we aimed to answer how land-use
changes affect ant species composition and richness in Paragominas? We also aim to
explore which environmental variables regulate ant species richness at local and
regional scales. Finally, for the third chapter we ask whether there is an ongoing
process of biotic homogenization happening with forest degradation and conversion
to production landscapes. We surveyed five taxa (plants, birds, dung beetles, ants and
orchid bees) in this chapter, across the municipalities of Paragominas and Santarém.
In the first chapter we provided the list, which we hope will be a baseline for the
monitoring of forest conservation initiatives taking place in the region. We also
found that species richness of the three groups is being reduced by deforestation and
forest degradation. In the second chapter, we observe a marked shift in species
composition with land-use changes, as well as a process of species loss, highly
associated with primary forest cover, being this the variable with the highest
importance in explaining species richness. Lastly in the third chapter, we found a
general pattern of steady decrease in local diversity with land-use intensification
whereas at larger scales this loss can only be noticed for forest versus non-forest
contribution of nestedness to β diversity in non-forest habitats at both scales. Thus, as a general conclusion, we found that land-use changes are eroding biodiversity and
if any action is readily implemented in the region to protect the extant forest patches,
we can witness a severe biodiversity loss that is already being observed at the local
scale. We do expect as a multidisciplinary network that our results can nurture joint
strategies, considering natural and socioeconomic sides, which can culminate in a
GENERAL INTRODUCTION
Around 40% of tropical forests in the world are located in the Brazilian
Amazon and it harbours a huge part of the world’s biodiversity (Malhi et al. 2008;
Barlow et al. 2011). Therefore, the Brazilian Amazon stands out as having a
central role in biological conservation. Yet, the region suffers the most intense
absolute rates of deforestation in the last decades (Lindenmayer et al. 2004;
Hansen et al. 2008) and despite since 2004 deforestation rates have been
decreasing (Nepstad et al. 2009), the region is the most active frontier of
land-cover change in the world (Barlow et al. 2011). Increasing resource demands
keeps pressuring the Amazonian region, which represents a major challenge to
conservationists (Gardner et al. 2009). Science can thus help with this challenge
by identifying proximate problems to be addressed, as well as providing baselines
for long-term strategies (Foley et al. 2011).
Bearing this context in mind, in the last four years a multidisciplinary
research initiative, namely Sustainable Amazon Network (in Portuguese Rede
Amazônia Sustentável, RAS, Gardner et al. 2013). RAS is a multidisciplinary
research initiative involving more than 30 institutions and organisations (Fig. 1)
that aims to explore both social and ecological aspects of the eastern Brazilian, in
order to shed some light on the main challenges faced by the region. While most
studies in the Amazon are done either at the scales of the whole region (Asner et
al. 2006) or in few small-scale intensively studied sites (Peres et al. 2010), RAS
explored the mesoscale. By exploring this scale (spanning hundreds of kilometres
and matching political unities), we expect we can foster local decision within the
range of action of political and social decisions. This is especially important if we
– are now boarding upon very ambitious sustainability initiatives (Gardner et al.
2013).
Figure 1: Collaborative scheme of the Sustainable Amazon Network. It was leaded by EMBRAPA and INCT, through an international partnership. Several governmental, society and research organisation worked together to generate the data.
Specifically, this thesis deals with some of the biodiversity aims of the
network. The main aim of this work is to explore the effects of land-cover
changes and human impacts on five different groups of organisms.
• The first chapter explores the effects of land-use changes on diversity of three insect groups, namely ants (Hymenoptera: Formicidae), orchid bees
(Hymenoptera: Apidae: Euglossini) and dung beetles (Coleoptera:
Scarabeidae: Scarabeinae). In this first chapter we work with data from
Paragominas and present the most comprehensive species list to date for
the three groups.
• In the second chapter we ask how ant species composition at transect scale responds to forest disturbance and conversion to production landscapes?
affected by land-use intensification? Finally, we assess which
environmental variables best predict the patterns of species richness across
the entire gradient at both scales. We work with data from Paragominas.
• For the third chapter we explore whether there is an ongoing process of biotic homogenization in human-modified landscapes. Accordingly, we
asked: (1) what is the pattern of species loss at both α- and γ-diversities
components as function of land-cover changes in a mosaic landscape? (2)
how does β-diversity respond to land-cover changes and to what extent is
β-diversity scale dependent? Finally, (3) do the processes underpinning β
REFERENCES
Asner, G.P., Broadbent, E.N., Oliveira, P.J.C., Keller, M., Knapp, D.E. & Silva,
J.N.M. (2006). Condition and fate of logged forests in the Brazilian
Amazon. Proceedings of the National Academy of Sciences of the United
States of America, 103, 12947-12950.
Barlow, J., Ewers, R.M., Anderson, L., Aragao, L.E.O.C., Baker, T.R., Boyd, E.
et al. (2011). Using learning networks to understand complex systems: a
case study of biological, geophysical and social research in the Amazon.
Biological Reviews, 86, 457-474.
Foley, J.A., Ramankutty, N., Brauman, K.A., Cassidy, E.S., Gerber, J.S.,
Johnston, M. et al. (2011). Solutions for a cultivated planet. Nature, 478,
337-342.
Gardner, T.A., Barlow, J., Chazdon, R., Ewers, R.M., Harvey, C.A., Peres, C.A.
et al. (2009). Prospects for tropical forest biodiversity in a
human-modified world. Ecology Letters, 12, 561-582.
Gardner, T.A., Ferreira, J., Barlow, J., Lees, A.C., Parry, L., Guimaraes Vieira,
I.C. et al. (2013). A social and ecological assessment of tropical land uses
at multiple scales: the Sustainable Amazon Network. Philosophical
Transactions of the Royal Society B-Biological Sciences, 368.
Hansen, M.C., Shimabukuro, Y.E., Potapov, P. & Pittman, K. (2008). Comparing
annual MODIS and PRODES forest cover change data for advancing
monitoring of Brazilian forest cover. Remote Sensing of Environment, 112,
Lindenmayer, D.B., Foster, D.R., Franklin, J.F., Hunter, M.L., Noss, R.F.,
Schmiegelow, F.A. et al. (2004). Ecology - Salvage harvesting policies
after natural disturbance. Science, 303, 1303-1303.
Malhi, Y., Roberts, J.T., Betts, R.A., Killeen, T.J., Li, W. & Nobre, C.A. (2008).
Climate change, deforestation, and the fate of the Amazon. Science, 319,
169-172.
Nepstad, D., Soares-Filho, B.S., Merry, F., Lima, A., Moutinho, P., Carter, J. et
al. (2009). The End of Deforestation in the Brazilian Amazon. Science,
326, 1350-1351.
Peres, C.A., Gardner, T.A., Barlow, J., Zuanon, J., Michalski, F., Lees, A.C. et al.
(2010). Biodiversity conservation in human-modified Amazonian forest
CHAPTER ONE
ANTS, ORCHID BEES AND DUNG BEETLES DIVERSITY AND DISTRIBUTION IN DIFFERENT LAND-USE TYPES OF PARAGOMINAS, AMAZONIA, PA,
BRAZIL
ANTS, ORCHID BEES AND DUNG BEETLES DIVERSITY AND
DISTRIBUTION IN DIFFERENT LAND-USE TYPES OF
PARAGOMINAS, AMAZONIA, PA, BRAZIL
Ricardo Ribeiro de Castro Solar1,2, Júlio Cézar Mário Chaul1, José Henrique
Schoereder3, Júlio Louzada4, Fernando Vaz-de-Mello5, Toby A. Gardner6, Joice
Ferreira7, Jos Barlow2
1) Universidade Federal de Viçosa, Departamento de Entomologia. Av. PH Rolfs s/n.
Viçosa, Minas Gerais, Brazil. CEP 36570-900. [email protected]
2) Lancaster Environment Centre, Lancaster University. Lancaster UK. LA1 4YQ.
3) Universidade Federal de Viçosa, Departamento de Biologia Geral. Av. PH Rolfs s/n.
Viçosa, Minas Gerais, Brazil. CEP 36570-900.
4) Universidade Federal de Lavras, Setor de Ecologia. Lavras, Minas Gerais, Brazil. CEP
37200-000.
5) Universidade Federal de Mato Grosso, Instituto de Biociencias, Departamento de
Biologia e Zoologia. Cuiaba, MT, Brazil. CEP 78060-900.
6) University of Cambridge, Department of Zoology. Cambridge, UK. CB2 3EJ.
7) EMBRAPA Amazônia Oriental. Belém, Pará, Brasil. CEP 66095-100.
ABSTRACT
The Sustainable Amazon Network (in Portuguese Rede Amazônia Sustentável;
RAS) is an interdisciplinary research initiative concerned with understanding the
social and ecological dimensions of land-use sustainability in the eastern Brazilian
Amazonia to better promote land management and conservation actions in that
region. Within the scope of this project, we sampled ants, dung beetles and orchid
bees to produce a list of species of ants, orchid bees and dung beetles collected in
Paragominas, PA, Brazil, as the most complete list of species to date of these
groups for the western Amazon. Also we aim to compare diversity of these three
taxa between major land-uses in the region. Both aims wrap up towards
establishing a baseline of vital biodiversity data for ongoing environmental
monitoring. We sampled the insects across several land-use types. In total we
sampled 289 species of ants, 85 species of dung beetles and 39 species of orchid
bees. Species richness was two times higher in forests than in production
landscapes and. For ants, primary forests were richer than secondary forests and
for dung beetles undisturbed primary forests were the richest sites, followed by
disturbed primary forests and then by secondary forests. Assemblage evenness
was generally higher in forests for all groups, with production landscapes being
dominated by few over-abundant species, such as the orchid bee Eulaema nigita
and the dung beetles Trichillum sp.1 and Pseudocanthon aff. xanthurus. The use
of different sampling methods has the potential to feed the list with species not
sampled in this study, and we recommend this to the future studies. With the
implementation of governance agendas to preserve and restore forests in the
effectiveness of ongoing changes in forest conservation and land management
practices.
Keywords: Biodiversity baseline, Conservation, Deforestation, Land-use,
INTRODUCTION
That the Brazilian Amazon harbours a gigantic portion of the Earth’s
biodiversity is a general fact (Barlow et al., 2011; Laurance et al., 2012). Yet, the
region has been suffering intense human-impacts and is indeed the most active
frontier of land-cover changes in the world. Governmental efforts are yielding
positive results, and deforestation rates – although still high – have decreased
since 2004 (Nepstad et al., 2009). Give this scenario, it would be desirable that
the scientific knowledge could foster conservation plans and actions in the region.
However, due to poor infrastructure and the vast size of the region, our knowledge
about Amazonian biodiversity is insignificant and most of the species lists only
represent a bare underestimate (Barlow et al., 2011).
Aiming to collaborate with better understanding of the region, some large
scale, multidisciplinary research networks have been developed in the Amazon.
Among them is the Sustainable Amazon Network (Rede Amazônia Sustentável,
RAS, in Portuguese, Gardner et al., 2013). A broad spectrum of sampling
campaigns were done in the agricultural frontier of Pará state of northern
Brazilian region, including socioeconomic, floristic and faunistic. The region has
also been suffering of intense deforestation since the 70’s (Lindenmayer et al.,
2004), although several governmental and social initiatives have been
contributing to minimise and revert this process (Viana et al., 2014). Bearing this
context in mind, amongst the faunistic surveys, we performed a comprehensive
survey of terrestrial invertebrates groups of ecological importance. Desirable
characteristics are easy sampling, be present across the whole system, observable
bees (Hymenoptera: Apidae: Euglossina) and dung beetles (Coleoptera:
Scarabeidae: Scarabeinae) (Underwood & Fisher, 2006; Gardner et al., 2008b).
Because habitat loss is the most serious threat facing biodiversity (Laurance et al.,
2012; Laurance et al., 2014), regional inventories constitute an important tool to
conservation of insect communities. Recording patterns of species occurrence in
space and time, as well as across human-modified landscapes is a valuable tool
for studying population ecology and biodiversity responses to human impacts and
so measure to which extent human activities are affecting biodiversity (Lach et
al., 2010).
Ants (Hymenoptera: Formicidae) are a ubiquitous group of insects, being
numerically and ecologically dominant in tropical forests (Hölldobler & Wilson,
2009; Lach et al., 2010). They play roles as seed dispersers (Christianini et al.,
2007), nutrient moving among soil layers (Sousa-Souto et al., 2007) and control
of species populations, e.g. due to predation (Folgarait, 1998). Ants are also easy
to sample, have a relatively well established taxonomy and are present nearly
everywhere in the Neotropics throughout the year (Underwood & Fisher, 2006).
Orchid bees are a group endemic to the Neotropics and have around 250
species (Nemesio & Rasmussen, 2011). Pollination of closely associated plant
species is one of the striking characteristics of this group (Janzen, 1971). Their
potential to indicate shifts in species composition, as they are sensitive to
environmental changes (Nemesio & Vasconcelos, 2013), associated with the easy
methodology to sample (Gardner et al., 2008b) means that they also provide a
cost-effective ecological disturbance indicator group (Gardner, 2010).
Nemesio, 2013a), and there are few studies in the Amazon (Oliveira & Campos,
1996; Barlow et al., 2007; Storck-Tonon et al., 2009; Nemesio & Ferrari, 2011).
Further research is needed on this group if conservation strategies in the Amazon
are able to take account of their diversity and distribution (Nemesio, 2013b).
Finally, dung beetles are among the most functionally important insect
groups in the tropics (Andersen & Feer, 2005). They play a role in several
ecological processes, such as dung removal, seed dispersal, nutrient
decomposition and cycling, bioturbation and controlling parasites of vertebrates
(Nichols et al., 2007; Nichols et al., 2008). Similarly to ants and orchid bees,
dung beetles are relatively easy to sample and identify, as well as well as being
sensitive to environmental changes (Gardner et al., 2008b).
Here in this paper, we have two main aims. 1) we present the resulting list
of species of ants, orchid bees and dung beetles collected in Paragominas, PA,
Brazil, as the most complete list of species to date of these groups for the eastern
Amazon. 2) we aim to compare diversity of these three taxa between major
land-uses in the region. Both aims wrap up towards establishing a baseline of vital
biodiversity data for ongoing environmental monitoring.
MATERIAL AND METHODS
Study site
We sampled the insects in Paragominas, a 2 million ha. municipality in
Pará state, north Brazil. The region comprises the Amazonian biome, with
(Andrade, 2011) and mean annual temperatures of 26.3ºC (Pinto et al., 2009). We
took all samples between January-June 2011, during the rainy season.
To perform the sample, we selected 18 catchments (ca. 5.000 ha. each)
covering the entire municipality, where we established from 8-12 transects
(300m) in each catchment, in a density of 1 transect/400ha (Figure 1). In total, we
sampled 192 transects across the major land-use classes present in the region
including undisturbed primary forests, varyingly disturbed primary and secondary
forests due to logging and fire and production areas (silviculture – Eucalyptus and
Schyzolobium amazonicum, pastures and agricultural fields). We determined age
of secondary forests based on satellite imagery of a 22-year image sequence, and
the average age of the secondary forests sampled is 17 years old (SD=8.27).
Insect sampling
Within each transect we sampled the three insect groups at the same time.
To sample the ants, we employed epigaeic pitfall traps, consisting of plastic
containers (8cm diameter), half filled with a solution of water, salt (5%) and soap
(5%) and baited with sardine and honey, both unreachable to the ants. In each
transect we installed six pitfall traps distanced 50m from each other. We also
sampled dung beetles with epigaeic pitfall traps, but in this case we baited then
with 50g of dung (80% pig and 20% human, Marsh et al., 2013). We installed
three sampling points along the transect with three traps in each dug at the corners
of a 3-m side triangle and sampled at three points along the transect. To sample
orchid bees, we used four plastic bottles per transect (2L, 10cm diameter, 35cm
height), tied to a tree trunk, 1.5m above the ground. Male orchid bees were
eucalyptol), separated by 50 m from each other. We tied the traps to a tree trunk,
1.5 m above the ground. In all cases, we installed traps for any taxa 25m far from
each other and all traps remained in field for 48h prior removal. In Fig. 1 there is a
graphical representation of our sampling design. We processed and identified the
ants to the most precise taxonomic level possible using available taxonomic keys
(Fernández, 2003; Bolton, accessed at 02/Jan/2014) and checking against the
reference collection of Universidade Federal de Viçosa. Processing and
identification of the dung beetles followed the taxonomic key by Vaz-de-Mello et
al. (2011) and reference collections of Universidade Federal de Lavras and
Universidade Federal do Mato Grosso. Finally, we processed and indentified
orchid bees at EMBRAPA – Amazônia Oriental, adapting available taxonomic
keys (Nemesio, 2009) and reference collection of EMBRAPA – Amazônia
Oriental. We deposited voucher specimens of ants in the reference collection of
the Community Ecology Lab, Universidade Federal de Viçosa. Orchid bees are
deposited on the reference collection in EMBRAPA – Amazônia Oriental. Dung
beetles are deposited in Seção de Entomologia da Coleção Zoológica da UFMT
(CEMT), Cuiabá. References used for specific species identification are listed in
Table S1.
Statistical analyses
To assess our sampling sufficiency, we built site based species
accumulation curves (Colwell et al., 2004) and also estimated the total number of
species to be sampled in each taxon using the first order Jackknife richness
To understand the effects of land-use change on sampled biota, we
analysed how total species richness and evenness change with different land-use
classes. For species richness, we performed an ANOVA with number of
species/transect as response variable and land-use class as the explanatory
variable. We used Poisson errors corrected for overdispersion whenever necessary
(Crawley, 2012). For evenness, we opted to use the Evar index (Smith & Wilson,
1996; Tuomisto, 2012), as this index fulfils desirable characteristics, such as
independence of differences in species richness among the treatments, and
symmetry with regards to influence of rare or dominant species (Magurran, 2003)
.
To estimate ant abundance we used the relative frequency of each species
(i.e. number of traps found in) in a transect. For dung beetles and orchid bees, we
simply counted the number of individuals sampled in each transect as their
relative abundances. We analysed evenness differences using ANOVA. As
evenness is expressed between 0 and 1, we used arcsine transformed values . For
both models with species richness and evenness we employed generalized linear
mixed models (GLMM, Bolker et al., 2009) with catchments set as random
factors to account for the hierarchical nature of the sampling design.
All analyses were performed using the R platform (R Core Team 2013).
Species accumulation curves and diversity estimators are implemented in the
package vegan (Oksanen et al., 2013). GLMM procedures used the package lme4
(Bates et al., 2013).
RESULTS
We sampled a total of 289 species of ants, placed in 56 ant genera,
belonging to 10 subfamilies. We assigned a name to all genera and among them,
112 are identified to species names, 23 are placed in species groups or complexes
where exact species identification was impossible. The rest 154 are identified
until morphospecies. A list of the species and morphospecies is given in Table 1.
Two new species, one for the genus Oxyepoecus (Oxyepoecus sp.PGM1) and one
for the genus Xenomyrmex (Xenomyrmex sp.PGM1) were sampled (R. Feitosa and
L. Prado, personal communication, respectivelly). The regional species
accumulation curve is not asymptotic (Fig. 2a), however we sampled 77.5% of the
total species richness estimated by the 1st order Jacknife.
Orchid bees
We sampled 3.769 individuals of orchid bees of 39 species, belonging to
four of the five known genera of this group. Thirty-seven species could be
identified to species level. Only one species of Eufrisea and one of Eulaema were
assigned to morphospecies. The complete list of species is available in Table 2.
Species accumulation curve is near-asymptotic (Fig. 2b), and we sampled 87% of
the total species richness estimated by 1st order Jacknife.
Dung beetles
We sampled a total 53.113 individuals of 85 species of dung beetles,
belonging to 23 genera and six tribes. From the 85 species, 59 (69.4%) could be
identified to species and the remainder (26 species) were assigned to
morphospecies. The complete list of species is available in Table 3. A new species
of the genus Deltochilum (Deltochilum sp.PGM1) was sampled (F. Silva, under
stabilising with around 100 randomly sampled transects, and encompassing 93%
of the total richness estimated using the 1st order Jacknife.
Patterns of species richness and evenness in different land-uses
There was a general trend of species richness loss from primary forests to
productions areas with agricultural fields being the most depauperate. For ants,
primary forest transects (undisturbed and disturbed) harboured the highest species
richness, followed by secondary forests, then reforestation and pastures together
and with the fewest number of species in agricultural fields (Fig. 3a, χ23,14=105,
P<0.001). The richest assemblage of Orchid bees was found in secondary forests,
primary forests (undisturbed and disturbed) had similar richness but lower than
secondary forests, followed by reforestation and pastures and the fewest species in
agricultural fields (Fig. 3b, χ21,16=76.7, P<0.001). Dung beetles had the highest
species richness in undisturbed primary forests, followed by disturbed primary
forests, than secondary forests and the lowest richness in all production areas (Fig.
3c, χ23,14=148.8, P<0.001).
Species evenness was similar across all taxa, being higher in forests
(primary and secondary) and lower in production areas. In general, evenness was
higher for ants, followed by orchid bees and then dung beetles (Fig. 4,
χ22,15=334.3,P<0.001). For ants the general pattern was observed with forests
presenting higher evenness than production areas (Fig. 4a, χ21,16=34.1,P<0.001),
as for the dung beetles (Fig. 4c, χ21,16=10.57, P=0.001). For orchid bees, we found
that logged and burnt primary forests and reforestation had higher richness values,
and pasture and the lowest values in agricultural fields (Fig. 4b, χ21,16=32,
P<0.001).
DISCUSSION
Here we present results of the most comprehensive sampling to date of
dung beetles, ants and orchid bees for any area of the eastern Amazon. We
provide information about three major important insect groups that will be useful
for future studies in that region, and assessments of the impacts of ongoing
changes in forest conservation and land management programs.
We consider our sampling effort sufficient for all three taxa at the regional
scale, with at least 77% of the estimated diversity sampled for all taxa. For ants,
the only previous study we are aware of in Paragominas yielded only 74 species
belonging to 30 genera (Kalif et al., 2001). By using a different sampling method
(Winkler extractors), the authors managed to sample species not represented in
our study, demonstrating the importance of considering the use of complementary
methods to survey this region as well as others. Exploring seldom studied habitats
such as the forest canopies (Basset et al., 2012) or underground soil layers
(Rabeling et al., 2008; Schmidt & Solar, 2010; Schmidt et al., 2014) also offers
significant potential to increase the number of species described for the region.
Few other studies have surveyed orchid-bees in the Amazonian region.
The number of species we sampled is in agreement with other studies (Oliveira &
Campos, 1996; Nemesio & Silveira, 2007b; Storck-Tonon et al., 2009;
Abrahamczyk et al., 2011). We sampled in a very diverse range of habitats and in
a large area, however species are likely to be sampled by using a greater diversity
In the case of dung beetles accumulation curves and richness estimators
suggest that we sampled most species attracted to dung in the region, with
comparable numbers of species to that reported in other studies (Gardner et al.,
2008a; Barlow et al., 2010). Apart from the large scale sampling, we recommend
the use of mixed human-pig dung in order to optimise sampling efficiency (Marsh
et al., 2013). Even so we still have sampled single or rare individuals, especially
those associated with specific habitats, such as canopy species or those
individuals preferentially captured by other sampling methods, such as
Anomiopus aff. foveicollis, Eurysternus harlequin Genier, 2009 and Bdelyrus sp.1.
Patterns of species richness and evenness in different land-use types
Unsurprisingly forests are more species rich than non-forest habitats.
However, we also observed more subtle patterns of diversity within and between
the major land-use types. In the case of ants we found fewer species in secondary
forests, demonstrating that the recovery of species in these forests is not
guaranteed even considering we sampled in relatively mature secondary forests on
average (Mazzei et al., 2010). As expected few ant species were sampled in
production areas with the lowest numbers in agricultural fields.
By contrast to the other groups orchid bees exhibited similar levels of
richness in all forest types. This is an expected result, considering orchid bees
have a high vagility, being able to fly several kilometres a day (Janzen, 1971).
Therefore, they can rapidly colonize new habitats, also considering orchid bees
may be able to sustain viable populations in relatively small forest patches
(Nemesio & Silveira, 2007a, 2010). Nevertheless orchid bees are seriously
and forest-dependent species are seriously threatened, as described by Nemesio
(2013a) for the Atlantic forest.
Dung beetles, as they apart from changes in habitat characteristics, rely on
mammal dung and carcasses as food and nesting resources (Nichols et al., 2013)
are expected to show the most marked patterns of diversity change in different
land-uses. Indeed, we found the highest number of species undisturbed primary
forests, where also large mammals are more expect to be better surviving (Prist et
al., 2012). Primary forests disturbed by logging and fire had fewer dung beetle
species, however still sustaining a considerably large dung beetle fauna (Fig. 3c).
Other researchers have also found that even logged areas can sustain a large
portion of the original fauna (Laurance & Laurance, 1996; Putz et al., 2012).
Secondary forests exhibit a substantial drop in species richness, indicating that
dung beetles are not being able to colonise or coexist in these areas in the same
levels they do in primary forests.
Evenness was generally higher in forest areas for both ants and dung
beetles, with eveness only decreasing for orchid bees in agricultural fields. Open
areas are often the least hospitable environments (Gascon et al., 1999), and are
commonly dominated by generalist species. This is the case of the orchid bee
Eulaema nigrita Lepeletier de Saint Fargeau, 1841, and the case of the dung
beetles Trichillum sp.1 and Pseudocanthon aff. xanthurus. All these three species
are examples of organisms rarely present in forest fragments, which on the other
hand became massively abundant in open areas. Individuals of Trichillum sp.1
reach huge numbers of 7000 individuals of in a single agricultural transect, with
Similar for orchid bees, where other species in pasture transects have relative
frequency of less than 1% compared to Eulaema nigrita.
CONCLUSION
Enhanced documentation of local diversity patterns of insects and other
organisms are invaluable in helping to assess conservation priorities and assess
management effectiveness. Indeed, it would be high desirable to develop
conservation strategies or conclusion to take into account a more comprehensive
understanding of diversity and distribution of the major groups of organisms
inhabiting a given locality. We hope this assessment provides the baseline for new
community and population studies on these groups of insects in the region.
Paragominas is the flagship municipality in the state of Para for the Green
Municipalities Program (in Portuguese, Programa Municípios Verdes –
http://municipiosverdes.com.br/), an initiative aiming to stop deforestation and
promote secondary forest recovery and sustainable land-use practices in the region
(Viana et al., 2014). We suggest therefore this study and the patterns of species
distributions can be used as baselines for future studies of forest changes in that
region. Thus, enabling strong conclusions to be drawn upon the evolution of the
REFERENCES
Abrahamczyk, S., Gottleuber, P., Matauschek, C. & Kessler, M. (2011) Diversity
and community composition of euglossine bee assemblages
(Hymenoptera: Apidae) in western Amazonia. Biodiversity and
Conservation, 20, 2981-3001.
Andersen, E. & Feer, F. (2005) The role of dung beetles as secondary seed
dispersers, their effect on plant regeneration in tropical rainforests. Seed
fate: predation, dispersal, seedling establishment. (ed. by P.M. Forget,
J.E. Lambert, P.E. Hulme and S.B. Van Der Wall). CABI Piblishing,
Wallingforg, Oxfordshire, UK.
Andrade, F.S. (2011) Variabilidade da precipitação pluviométrica de um
município do estado do Pará. Engenharia Ambiental, 8, 138-145.
Barlow, J., Louzada, J., Parry, L., Hernandez, M.I.M., Hawes, J., Peres, C.A.,
Vaz-de-Mello, F.Z. & Gardner, T.A. (2010) Improving the design and
management of forest strips in human-dominated tropical landscapes: a
field test on Amazonian dung beetles. Journal of Applied Ecology, 47,
779-788.
Barlow, J., Ewers, R.M., Anderson, L., Aragao, L.E.O.C., Baker, T.R., Boyd, E.,
Feldpausch, T.R., Gloor, E., Hall, A., Malhi, Y., Milliken, W., Mulligan,
M., Parry, L., Pennington, T., Peres, C.A., Phillips, O.L., Roman-Cuesta,
R.M., Tobias, J.A. & Gardner, T.A. (2011) Using learning networks to
understand complex systems: a case study of biological, geophysical and
social research in the Amazon. Biological Reviews, 86, 457-474.
Barlow, J., Gardner, T.A., Araujo, I.S., Avila-Pires, T.C., Bonaldo, A.B., Costa,
Hoogmoed, M.S., Leite, R.N., Lo-Man-Hung, N.F., Malcolm, J.R.,
Martins, M.B., Mestre, L.A.M., Miranda-Santos, R., Nunes-Gutjahr, A.L.,
Overal, W.L., Parry, L., Peters, S.L., Ribeiro-Junior, M.A., da Silva,
M.N.F., Motta, C.d.S. & Peres, C.A. (2007) Quantifying the biodiversity
value of tropical primary, secondary, and plantation forests. Proceedings
of the National Academy of Sciences of the United States of America, 104,
18555-18560.
Basset, Y., Cizek, L., Cuenoud, P., Didham, R.K., Guilhaumon, F., Missa, O.,
Novotny, V., Odegaard, F., Roslin, T., Schmidl, J., Tishechkin, A.K.,
Winchester, N.N., Roubik, D.W., Aberlenc, H.-P., Bail, J., Barrios, H.,
Bridle, J.R., Castano-Meneses, G., Corbara, B., Curletti, G., da Rocha,
W.D., de Bakker, D., Delabie, J.H.C., Dejean, A., Fagan, L.L., Floren, A.,
Kitching, R.L., Medianero, E., Miller, S.E., de Oliveira, E.G., Orivel, J.,
Pollet, M., Rapp, M., Ribeiro, S.P., Roisin, Y., Schmidt, J.B., Sorensen, L.
& Leponce, M. (2012) Arthropod Diversity in a Tropical Forest. Science,
338, 1481-1484.
Bates, D., Maechler, M., Bolker, B. & Walker, S. (2013) lme4: Linear
mixed-effects models using Eigen and S4 - version 1.0-5.
Bolker, B.M., Brooks, M.E., Clark, C.J., Geange, S.W., Poulsen, J.R., Stevens,
M.H.H. & White, J.-S.S. (2009) Generalized linear mixed models: a
practical guide for ecology and evolution. Trends in Ecology & Evolution,
24, 127-135.
Bolton, B. (accessed at 02/Jan/2014) An online catalog of the ants of the world.
Chiarucci, A., Enright, N.J., Perry, G.L.W., Miller, B.P. & Lamont, B.B. (2003)
Performance of nonparametric species richness estimators in a high
diversity plant community. Diversity and Distributions, 9, 283-295.
Christianini, A.V., Mayhe-Nunes, A.J. & Oliveira, P.S. (2007) The role of ants in
the removal of non-myrmecochorous diaspores and seed germination in a
neotropical savanna. Journal of Tropical Ecology, 23, 343-351.
Colwell, R.K., Mao, C.X. & Chang, J. (2004) Interpolating, extrapolating, and
comparing incidence-based species accumulation curves. Ecology, 85,
2717-2727.
Crawley, M.J. (2012) The R book, 2nd edn. Wiley, London, UK.
Fernández, F. (ed.^eds) (2003) Introducción a las hormigas de la región
Neotropical. Instituto de Investigacíon de Recursos Biológicos Alexander
von Humboldt, Bogotá, Colombia.
Folgarait, P.J. (1998) Ant biodiversity and its relationship to ecosystem
functioning: a review. Biodiversity and Conservation, 7, 1221-1244.
Gardner, T.A. (2010) Monitoring Forest Biodiversity: Improving Conservation
through Ecologically-Responsible Management Routledge, London, UK.
Gardner, T.A., Hernandez, M.I.M., Barlow, J. & Peres, C.A. (2008a)
Understanding the biodiversity consequences of habitat change: the value
of secondary and plantation forests for neotropical dung beetles. Journal
of Applied Ecology, 45, 883-893.
Gardner, T.A., Barlow, J., Araujo, I.S., Avila-Pires, T.C., Bonaldo, A.B., Costa,
J.E., Esposito, M.C., Ferreira, L.V., Hawes, J., Hernandez, M.I.M.,
Hoogmoed, M.S., Leite, R.N., Lo-Man-Hung, N.F., Malcolm, J.R.,
L., Peters, S.L., Ribeiro-Junior, M.A., da Silva, M.N.F., Motta, C.d.S. &
Peres, C.A. (2008b) The cost-effectiveness of biodiversity surveys in
tropical forests. Ecology Letters, 11, 139-150.
Gardner, T.A., Ferreira, J., Barlow, J., Lees, A.C., Parry, L., Guimaraes Vieira,
I.C., Berenguer, E., Abramovay, R., Aleixo, A., Andretti, C., Aragao,
L.E.O.C., Araujo, I., de Avila, W.S., Bardgett, R.D., Batistella, M.,
Begotti, R.A., Beldini, T., de Blas, D.E., Braga, R.F., Braga, D.d.L., de
Brito, J.G., de Camargo, P.B., dos Santos, F.C., de Oliveira, V.C., Nunes
Cordeiro, A.C., Cardoso, T.M., de Carvalho, D.R., Castelani, S.A., Mario
Chaul, J.C., Cerri, C.E., Costa, F.d.A., Furtado da Costa, C.D., Coudel, E.,
Coutinho, A.C., Cunha, D., D'Antona, A., Dezincourt, J., Dias-Silva, K.,
Durigan, M., Dalla Mora Esquerdo, J.C., Feres, J., de Barros Ferraz, S.F.,
de Melo Ferreira, A.E., Fiorini, A.C., Flores da Silva, L.V., Frazao, F.S.,
Garrett, R., Gomes, A.d.S., Goncalves, K.d.S., Guerrero, J.B., Hamada,
N., Hughes, R.M., Igliori, D.C., Jesus, E.d.C., Juen, L., Junior, M., de
Oliveira Junior, J.M.B., de Oliveira Junior, R.C., Souza Junior, C.,
Kaufmann, P., Korasaki, V., Leal, C.G., Leitao, R., Lima, N., Lopes
Almeida, M.d.F., Lourival, R., Louzada, J., Mac Nally, R., Marchand, S.,
Maues, M.M., Moreira, F.M.S., Morsello, C., Moura, N., Nessimian, J.,
Nunes, S., Fonseca Oliveira, V.H., Pardini, R., Pereira, H.C., Pompeu,
P.S., Ribas, C.R., Rossetti, F., Schmidt, F.A., da Silva, R., Viana Martins
da Silva, R.C., Morello Ramalho da Silva, T.F., Silveira, J., Siqueira, J.V.,
de Carvalho, T.S., Solar, R.R.C., Holanda Tancredi, N.S., Thomson, J.R.,
Torres, P.C., Vaz-de-Mello, F.Z., Stulpen Veiga, R.C., Venturieri, A.,
ecological assessment of tropical land uses at multiple scales: the
Sustainable Amazon Network. Philosophical Transactions of the Royal
Society B-Biological Sciences, 368
Gascon, C., Lovejoy, T.E., Bierregaard, R.O., Malcolm, J.R., Stouffer, P.C.,
Vasconcelos, H.L., Laurance, W.F., Zimmerman, B., Tocher, M. &
Borges, S. (1999) Matrix habitat and species richness in tropical forest
remnants. Biological Conservation, 91, 223-229.
Hölldobler, B. & Wilson, E.O. (2009) The Superorganism: The Beauty, Elegance,
and Strangeness of Insect Societies. W. W. Norton & Company, New
York, NY, United States of America.
Janzen, D.H. (1971) EUGLOSSINE BEES AS LONG-DISTANCE
POLLINATORS OF TROPICAL PLANTS. Science, 171, 203-&.
Kalif, K.A.B., Azevedo-Ramos, C., Moutinho, P. & Malcher, S.A.O. (2001) The
effect of logging on the ground-foraging ant community in Eastern
Amazonia. Studies on Neotropical Fauna and Environment, 36, 215-219.
Lach, L., Parr, C. & Abbott, K. (2010) Ant Ecology. Oxford University Press,
USA.
Laurance, W.F. & Laurance, S.G.W. (1996) Responses of five arboreal
marsupials to recent selective logging in tropical Australia. Biotropica, 28,
310-322.
Laurance, W.F., Sayer, J. & Cassman, K.G. (2014) Agricultural expansion and its
impacts on tropical nature. Trends in ecology & evolution, In press
Laurance, W.F., Useche, D.C., Rendeiro, J., Kalka, M., Bradshaw, C.J.A., Sloan,
S.P., Laurance, S.G., Campbell, M., Abernethy, K., Alvarez, P.,