sep-dec. 2014, Vol. 24, No. 59, 305-312. doi: 10.1590/1982-43272459201404
People routinely face bad news presented in the majority of means of communication. Scenes of murder, robbery or accident are announced day and night (Pimentel, Gunther, & Black, 2012). This interest in negative aspects, however, is not exclusive to the media, as, for a long time, Psychology also ignored the positive aspects of human life, emphasizing questions related to suffering and illness, focusing only on
Article
The Positivity Dimension of Well-Being: Adaptation and Psychometric Evidence
of a Measure
1Abstract: This research aimed to adapt the Positivity Scale (PS) to the Brazilian context, gathering evidence of validity and reliability. Two studies were performed. Study 1 was composed of 200 people from Paraíba, with a mean age of 23.4 years old (SD = 4.53), who answered the PS and demographic questions. Results pointed to a one-factor solution in this scale, which presented satisfactory
reliability (α = .85). Study 2 gathered 290 undergraduate students with a mean age of 23.9 years old (SD = 7.60), who answered the
PS, the Satisfaction with Life Scale, the Subjective Vitality Scale and demographic questions. Conirmatory factor analyses (ML
and ADF estimators) corroborated the one-factor structure, which presented an acceptable reliability (CR = .65). Furthermore, its
convergent validity was conirmed based on the average variance extracted (AVE = .60) and on its correlations with satisfaction with
life and vitality (p < .001). In conclusion, this measure has been shown to be psychometrically adequate for use in Brazil.
Keywords: assertiveness, scaling, measurement, test validity, test reliability
A Dimensão Positividade do Bem-Estar: Adaptação e Evidências Psicométricas
de uma Medida
Resumo: Este artigo objetivou adaptar a Escala de Positividade (EP)para o contexto brasileiro, reunindo evidências de validade e consistência interna. Dois estudos foram realizados. O estudo 1 contou com 200 paraibanos, com idade média de 23,4 anos (DP = 4.53), que responderam a EP e perguntas demográicas. Os resultados apontaram para uma solução unifatorial
desta escala, que apresentou consistência interna satisfatória (α = .85). O estudo 2 reuniu 290 estudantes universitários com
idade média de 23,9 anos (DP = 7.60), que responderam a EP, a Escala de Satisfação com a Vida, a Escala de Vitalidade Subjetiva e perguntas demográicas. Análises fatoriais conirmatórias (ML e ADF) corroboraram a estrutura unifatorial
preconizada, obtendo consistência interna aceitável (CC = .65). Sua validade convergente foi conirmada a partir da variância média extraída (.64) e correlações com satisfação com a vida e vitalidade (p < .001). Conclui-se que esta medida se mostrou
psicometricamente adequada para utilização na realidade brasileira.
Palavras-chave: assertividade, escalas, medidas, validade do teste, precisão do teste
La Dimensión Positividad del Bienestar: Adaptación y Evidencias Psicométricas
de una Medida
Resumen: Esta investigación tuvo como objetivo adaptar la Escala de Positividad (EP) al contexto brasileño, recolectando evidencias de validez y iabilidad. Fueron desarrollados dos estudios. En el estudio 1 participaron 200 personas de Paraíba con promedio de edad de 23.4 años (DE = 4,53), quienes contestaron a la EP y preguntas demográicas. Los resultados mostraron una escala unifactorial, que presentó iabilidad satisfactoria (α = .85). El estudio 2 reunió 290 estudiantes universitarios con promedio de edad de 23.9 años (DE = 7,60), que respondieron a la EP, Escala de Satisfacción con la Vida, Escala de Vitalidad Subjetiva y preguntas demográicas. Análisis factoriales conirmatorios (ML y ADF) corroboraron la estructura unifactorial (CFI = .90, TLI = .85, RMSEA = .07), presentando consistencia interna aceptable (CC = .65). La validez convergente de la EP fue conirmada por la varianza media extraída (.64) y sus correlaciones con la satisfacción con la vida y vitalidad (p < .001).
En conclusión, esta medida reveló ser psicométricamente adecuada para uso en la realidad brasileña. Palabras clave: asertividad, escalas, medidas, validación de test, precisión de test
1 Support: National Council for Scientiic and Technological Development (CNPq) through master’s degree and productivity grants made available
to the irst (Prtocol No. 132697/2013-0) and last of the authors (Protocol
No. 485548/2012-7), respectively. 2 Correspondence address:
Roosevelt Vilar Lobo de Souza. Universidade Federal da Paraíba, CCHLA, Departamento de Psicologia, Bloco C, 2º Andar, Sala 1,
Laboratório de Psicologia Social Experimental. CEP 58051-900. João Pessoa-PB, Brazil. E-mail: [email protected]
Roosevelt Vilar Lobo de Souza2 Universidade Federal da Paraíba,
João Pessoa-PB, Brazil
Rafaella de Carvalho Rodrigues Araújo Universidade Federal da Paraíba,
João Pessoa-PB, Brazil
Rildésia Silva Veloso Gouveia Centro Universitário João Pessoa,
João Pessoa-PB, Brazil
Gabriel Lins de Holanda Coelho Cardiff University,
Cardiff, Wales
Valdiney Veloso Gouveia Universidade Federal da Paraíba,
what was different and improbable. That is to say, no matter how prevalent positive aspects were, the interest was in what was “abnormal”, deviant, or pathological (Paludo & Koller, 2007; Seligman, 2002).
This tendency could be clearly identiied in the search undertaken in the American Psychological Association
(APA PsycNETTM), on 22nd of December 2013. For
example, a large number of records was observed when descriptors accentuating negative aspects were inserted, such as depression (204,335), anxiety(158,559) and stress (156,093). These were clearly higher than those ascertained for positive descriptors, such as optimism, life satisfaction, and self-esteem – which, together, totaled 60,240 records in this search engine. With the aim of checking the number of publications for these terms in Portuguese, searches were undertaken, in the above-mentioned data, in the Electronic Psychology Journals portal (PePSIC) and in the Scientiic Eletronic Library Online (SciELO) Brazil, inserting the words otimismo (optimism), satisfação com a vida (satisfaction with life), and autoestima (self-esteem). A total of 649 records was observed. Undertaking the same search with the words depressão (depression), ansiedade (anxiety) and estresse (stress), a number nearly 10 times higher (6,187 records) was identiied. Psychology’s emphasis on considering the negative aspects, therefore, is evident; although a science which is more concerned with health promotion has its place, indicating possible directions for research and interventions.
According to Seligman (2002), this tendency for researching the pathologies in order to “repair” people was inluenced by the second world war. Indeed, this event resulted in a considerable amount of harm to people, requiring special attention from Psychology, directed towards cures, which ended up weakening initiatives which proposed to investigate the virtuous aspects of life (Paludo & Koller, 2007). This scenario, however, has changed in recent decades, becoming evident with the inclusion of the term ‘happiness’ in the Psychological Abstracts International, in 1973, and the creation of the periodical ‘Social Indicators Research’ in 1974, allowing greater dissemination of the indings and debates focused on subjective well-being (Diener, 1984).
With this perspective gaining strength over recent years, it was not long before studies which had previously centered on negative aspects began to take positive constructs into account. As a result, instruments centered on constructs which covered the human virtues, such as satisfaction with life (Gouveia, Barbosa, Andrade, & Carneiro, 2005) and subjective vitality (Gouveia et al., 2012) became more present. In this regard, the effects of positive constructs have been demonstrated in various studies, with positive correlations being observed with varying aspects, such as physical health, longevity, recovery from illnesses and coping strategies (Scheier & Carver, 2001). Others, furthermore, have demonstrated that measures of positive aspects act as predictors for depression, positive and negative affects,
and quality of life (Caprara, Steca, Alessandri, Abela, & McWhinnie, 2010).
According to Scorsolini-Comin and Santos (2009), Positive Psychology is an area of psychological knowledge which is concerned with the change in Psychology’s view in relation to psychological phenomena, being a theoretical and methodological approach which makes it possible to evidence positive aspects of life. Seligman and Csikszentmihalyi (2000) present three levels in which its operation is possible: (a) The subjective level – this considers peoples’ subjective experiences, ranging from those experienced to those geared towards the future, such as satisfaction with life (past), happiness (present) and optimism (future); (b) The individual level – closely related to positive personality traits, such as peoples’ disposition to present behaviors of perseverance, forgiveness and spirituality; and (c) The group level – the participation of society to achieve better citizenship, with civility, altruism and tolerance as possible examples.
Many of the recent studies have focused on the identiication of positive aspects which may promote the well-being of the individual (Linley, Maltby, Wood, Osborne, & Hurling, 2009). According to Kozma, Stone and Stones (2000), this general disposition, capable of determining subjective well-being, can be termed ‘positivity’, and this operates as a trait which causes people to generally assess aspects of life as being positive. Furthermore, Caprara et al. (2010) indicate positivity as a latent trait present in self-esteem, and satisfaction with life, and in optimism; constructs which are inluenced by peoples’ feelings, cognitions and actions. This observation has been evidenced in various countries, such as Italy, Germany and Japan (Caprara et al., 2011). Through positivity, moreover, a change occurs in how one sees and deals with various situations, affecting how people evaluate their subjective experiences (Caprara et al., 2010).
Taking positivity into account as a central element in this psychological perspective which is being deined, Caprara et al. (2012) proposed a direct way of measuring it. In this case, they considered the individual tendencies to assess life and peoples’ experiences from a positive outlook, which resulted in their Positivity Scale (PS). This measure was made up of items of satisfaction with life, self-esteem and optimism, which are central elements in studies of Positive Psychology. Due to the importance of this construct, no study in Brazil having been found in which it was considered, the decision was made to adapt the PS to the Brazilian context, bringing together evidence of its psychometric parameters, which could be useful in research contexts and psychological practices. As a result, it is appropriate irstly to describe it in greater detail, as follows.
The Positivity Scale
that the underlying issues shared a common latent factor, which represents how people operate positively in the world. Although there are the instruments which focus on positive aspects of life, this is justiied due to being speciic to positivity, allowing one to assess the extent to which the said construct operates as a dispositional variable of the individual.
In the irst study, Caprara et al. (2012) brought together 36 items derived from correlated measures of positivity (Diener, Emmons, Larsen, & Grifin, 1985). However, 10 items were discarded to avoid ambiguity and redundancy. Later, in checking the inter-item correlation matrix and undertaking the Exploratory Factorial Analysis, a one-factor solution was obtained, made up of eight items with satisfactory saturations. For example, the eigenvalue of this factor was 3.08, explaining 47.6% of the total variance, obtaining saturations between .43 and .68, and presenting internal consistency (Cronbach’s alpha) of .79.
The other studies (2, 3, 4 and 5) were dedicated to corroborating this scale’s internal, convergent and discriminant validities. In addition, its temporal stability (test-retest with the interval of ive weeks between the two applications) and factorial invariance (testing the instrument in four distinct cultures: Spain, the United States of America, Italy and Japan) were checked. All the items were shown to be robust, evidencing the Positivity Scale’s psychometric adequacy (Caprara et al., 2012).
In summary, considering the relevancy of the issue referent to positivity, and the fact that there are no instruments with this speciic characteristic in the Brazilian context, it was decided to undertake the present enterprise. This article, therefore, aimed to adapt the Positivity Scale (PS) to the Brazilian context, bringing together evidence of validity and internal consistency. In this regard, two studies, in which the Positivity Scale was adapted to the Brazilian context, are described below.
Method - Study 1
Factorial Structure of the Positivity Scale
This study covers the irst attempt to adapt the Positivity Scale to the Brazilian context, seeking to bring together evidence of its construct validity (factorial structure and internal consistency).
Participants
A convenience sample was used, composed of people from the State of Paraíba who were invited to collaborate and accepted voluntarily. A total of 200 people participated, who were contacted via the Internet and requested to answer a questionnaire which was only available online. Their ages varied between 16 and 51 years old (M = 23.4; SD = 4.53), the majority being male (53%) and single (91%).
Instruments
The participants answered demographic questions (educational level, marital status, sex and age) and the online version of the Positivity Scale. The studies upon which the construction of this instrument was based had previously been indicated and their psychometric parameters observed. This scale is composed of eight items (e.g., “In general, I am satisied with myself”), which are responded to using a ive-point Likert-type scale, varying from 1 (Totally disagree) to 5 (Totally agree).
Considering the version of the instrument in English, we proceeded to have it translated into Portuguese. In this way, its items, response scale and instructions were translated from English into Portuguese by a bilingual researcher and, following that, another researcher (also bilingual) undertook the back-translation, translating the items back into English. Finally, a third researcher (also bilingual) compared the translations undertaken and was unable to suggest any substantial changes. Once translated, the decision was made to check the understanding of the PS. In this case, its semantic validation was thoroughly checked, considering a group of 20 junior high school students. These were invited to collaborate voluntarily. After the analysis of the instructions, the response scale and the content of the items, it was observed that the version did not require any substantial alterations, coniguring what would later be made available to the reader (http://vvgouveia.net).
Procedure
Data collection. Once the Brazilian version of the Positivity Scale had been elaborated, the authors proceeded to the elaboration of its online version. Speciically, this was undertaken on the Google Docs research platform, the study later being publicized on the social network, Facebook. The link for participating in the research was made available for the period of 30 days, and the researcher responsible was available six hours per day for any clariications which respondents needed. Prior to proceeding, the participants needed to read and agree with the terms of free and informed consent.
Data analysis. The ‘R’ statistical program was used for analyzing the data (R Development Core Team, 2011; Raiche, Walls, Magis, Riopel, & Blais, 2013; van der Ark, 2012). Initially, the item of discrimination was evaluated, Student t tests were calculated, and descriptive analyses were undertaken. Following that, the researchers sought to investigate the adequacy of using exploratory factorial analysis, considering the Kaiser-Meyer-Olkin (KMO) criteria, analyzed in R using the ‘Psych’ statistical package (Revelle, 2014), a minimum value of .60 being required to allow this type of analysis, and the Bartlett sphericity test,
Principal Axis Factoring (PAF) was conducted, consistent with the study of the elaboration of the PS (Caprara et al., 2012), with the objective of investigating this measure’s structure. In this case, the researchers used the Kaiser, Cattell and Horn criteria (parallel analysis), as well as the Optimal Coordinates and Acceleration Factor, in order to corroborate the one-factor solution. These analyses were undertaken with the Psych and nFactors statistical packages (Raiche & Magis, 2014; Revelle, 2014). In order to investigate the internal consistency of the resulting factorial structure, the Cronbach’s alpha was used, using the ltm package (Rizopoulos, 2006).
Finally, as a complementary analysis, it was decided to assess this measure’s unidimensionality in the ambit of IRT (Item Response Theory). In this case, a Mokken Analysis was conducted, a type of nonparametric analysis which aims to assess whether factors exist in a speciied measure (Watson, Deary, & Shipley, 2008), checking the assumptions of monotonic homogeneity and double monotonicity (Mokken & Lewis, 1982). Monotonic homogeneity means that, when the latent trait is increased, all the response curves to the item also increase, while double monotonicity means that the items response curves do not cross (Watson et al., 2008). Thus, through the use of the Mokken statistical package (van der Ark, 2012), it was sought to bring together more robust evidence regarding the factorial structure of the present measure. For the unidimensionality to be identiied, Löevinger’s H coeficient (H for the total scale, and Hs for each item) and the Mokken Rho must be greater than .30 and .80 respectively.
Ethical Considerations
The project was approved by the Committee for Ethics and Research with Human Beings, of the Lauro Wanderley Teaching Hospital, of the Universidade Federal da Paraíba (CAAE: 21760313.3.0000.5188). All the ethical principles were respected, in consonance with the National Health Council Resolution No. 466/12, guaranteeing to the respondents the anonymity of their responses, voluntary participation, and the possibility to decline to ill out data. On average, people took approximately 5 minutes to complete their participation in the study.
Results
Initially, the discrimination of the items in the Positivity Scale was veriied, certifying the items’ capacity to differentiate respondents with close magnitudes in the latent trait. Through internal criteria groups, the respondents were separated into an upper and a lower group, considering the criteria of the empirical median (the 50% of total scores above and below the median, respectively). For each item, the Student t-test was used to compare the means of the people from the two groups. In
summary, all of the eight items discriminated these groups in the direction expected (t > 20, p < .001).
It is relevant to mention that the items did not obtain perfectly normal (Critical ratio = 15.95) distributions (uni-and multivariate). Nevertheless, even not having a distribution as expected in the literature (Hair, Black, Babin, Anderson, & Tatham, 2009), it was decided to proceed with the analyses so as to offer indings to the reader which could be taken into account in future comparisons; alternatively, we also made available results for a nonparametric method of estimation (ADF = Asymptotically Distribution-Free). The complete corresponding table is available on request from the authors of this article.
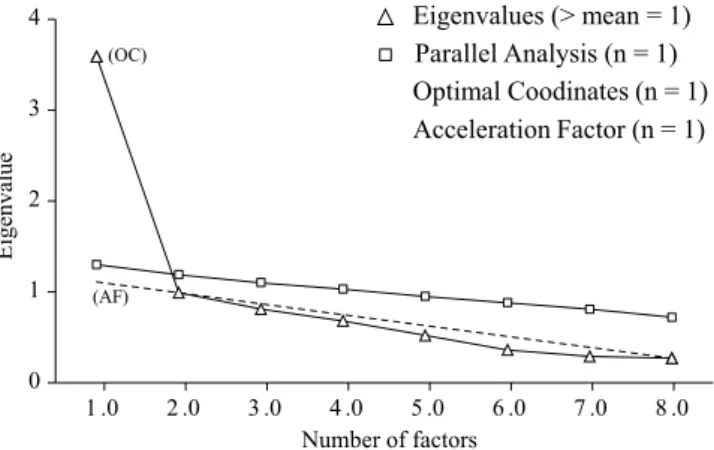
The next step was to investigate the appropriacy of undertaking a factorial analysis, observing results which supported it [KMO= .86 and the Bartlett sphericity test, χ2(28) = 667.17, p < .001]. As a result, with the aim of investigating the number of factors of the Positivity Scale, it was decided to undertake an exploratory factorial analysis (PAF method). This took into account the Kaiser values (eigenvalue equal or superior to 1), Cattell values (graphic distribution) and Horn values (preponderance of the real values observed in relation to the simulated values; parallel analysis), as well as the Optimal Coordinates and Acceleration Factor criteria. These last are non-graphical alternatives which aim to overcome limitations of subjectivity which are inherent to the scree test (Cattell criteria). The Optimal Coordinates seek to ascertain the localization of the factor through simulations, verifying whether the eigenvalues found in the simulations are greater than the actual eigenvalues, deining the number of values to extract. The Acceleration Factor, on the other hand, aims to ascertain the point at which the gradient of the curve has an abrupt and meaningful change, thus identifying the number of factors found prior to the “elbow” (Raiche et al., 2013). The graphic distribution (scree plot) of these values is shown in Figure 1.
As may be observed, the one-factor solution was shown to be clear. A single component was consistently
Figure 1. Graphical distribution of the eigenvalues.
0 1 2 3 4
1 .0 2 .0 3 .0 4 .0 5 .0 6 .0 7 .0 8 .0
Eigenvalue
Number of factors
Eigenvalues (> mean = 1) Parallel Analysis (n = 1) Optimal Coodinates (n = 1) Acceleration Factor (n = 1) (OC)
found through the ive criteria considered. This structure is consistent with the model proposed by the authors of the above-mentioned measure (Caprara et al., 2012), and is summarized in Table 1, below.
According to this table, the items of this one-factor solution presented saturations above |.30|, resulting in an eigenvalue of 4.08, which was responsible for explaining 51% of the total variance. Its coefficient
Table 1
Factorial Structure of the Positivity Scale
Items Description of content Factor h2
5 On the whole, I am satisfied with myself. .82* .67
8 I generally feel confident in myself. .79* .62
7 I feel I have many things to be proud of. .74* .55 4 I look forward to the future with hope and enthusiasm. .70* .49
1 I have great faith in the future. .70* .49
2 I am satisfied with my life. .67* .45
6 At times, the future seems unclear to me. .43* .19 3 Others are generally here for me when I need them. .37* .14
Note. *Factor loading commonly accepted for interpretations of the factor (p < .001).
of internal consistency (Cronbach’s alpha) was .85, a value above that recommended in the literature (Oviedo & Campo Arias, 2005). In addition, the unidimensionality of the measures was also checked, through the IRT perspective. For this, the researchers used the Mokken scale analysis, which presented results which were equally satisfactory [H = .47 and Rho = .85; Hs varying between .28 (Item 3) and .58 (Item 5)], indicating that a unidimensional structure for this measure is indeed plausible.
Method - Study 2
Factorial Structure, Convergent Validity, and Composite Reliability
In Study 1, it was possible to ind preliminary evidence of the one-factor structure of the Positivity Scale. In the present study, evidence was sought of the adequacy of this factorial structure; conirmatory factorial analysis was undertaken, and evidence was checked for its convergent validity – through the average variance extracted (AVE) and its correlation with a similar measure of construct – and composite reliability (CR).
Participants
A total of 290 university students from João Pessoa, in the Brazilian state of Paraíba, participated, with a mean age of 23.9 years old (SD = 7.60), the majority of whom were female (70.7%), single (74.5%), and Roman Catholic (50.3%). The sample was nonprobabilistic.
Instruments
The participants received a printed questionnaire, containing demographic information (marital status, age and
sex), the Positivity Scale, described previously, and the two following measures:
Satisfaction With Life Scale (SWLS). This was originally proposed by Diener et al. (1985), seeking to assess the judgment which people make regarding their satisfaction with life. It covers a set of ive items (e.g., “In most ways my life is close to my ideal”), responded to on a seven-point scale, varying from 1 (Strongly disagree) to 7, (Strongly agree). It is a one-factor measure, adapted to the Brazilian context, with consistency coeficients above .70 (Gouveia et al., 2005).
Subjective Vitality Scale (SVS). This measure was originally proposed by Ryan and Frederick (1997), with a version made up of seven items; later improved by Bostic, Rubio and Hood (2000), who proposed a more parsimonious version of six items. This version was adapted to the Brazilian context by Gouveia et al. (2012), producing a strategy which brought together the six items (e.g., “I feel alive and vital”), answered on a seven-point scale varying from 1 (Not at all true) to 7(Very true). It is a one-factor measure, with a Cronbach’s alpha superior to .70 for its Brazilian adaptation.
Procedure
Data collection. For data collection, the researchers contacted undergraduate courses at public and private universities in João Pessoa, Paraíba. After obtaining authorization from the courses’ professors, the students present were invited, being requested to collaborate through responding to the questionnaires. In this case, participation was effected in the collective environment of the classroom, although the questionnaires were illed out individually.
considered, and the Maximum Likelihood (ML) method of estimation was adopted. With the aim of ascertaining the quality of adjustment of the model tested, multiple indicators of adjustment were taken into account, such as: χ² (Chi-squared), CFI (Comparative Fit Index), TLI (Tucker-Lewis Index), RMSEA (Root-Mean-Square Error of Approximation) and SRMR (Standardized Root Mean Square Residual) (Hair et al., 2009; Tabachnick & Fidell, 2013).
Finally, a speciic calculator was used for investigating evidence of convergent validity through the average variance extracted (AVE) (Gouveia & Gabriel, 2013). AVE values superior to .50 provide evidence of this parameter; in the case of the composite reliability (CR), it is recommended that it should be superior to .70 (Fornell & Larcker, 1981), although it is accepted from .60 onward (Škerlavaj & Dimovski, 2009).
Ethical Considerations
Respecting the ethical aspects of research with human beings, as Resolution 466/12 of the Brazilian National Health Council deines, all the participants signed the terms of free and informed consent, which ensured the anonymous character of participation, and indicated that participation was voluntary, and that the participant could withdraw from the study at any time without being penalized. The information regarding this study’s approval had been presented beforehand. The mean time for concluding participation was 10 minutes.
Results
The results were presented in two sections. Firstly, the conirmatory factorial analysis is presented, after which evidence of convergent validity is checked through the average variance extracted and correlations of its scores with those of instruments which measure similar constructs. In this last part, evidence is also offered for its composite reliability. It is emphasized that this study’s items also do not follow perfectly normal distributions (Critical Ratio = 10.18). However, the researchers proceeded to conirmatory analysis, making the indings for the ML and ADF estimators available.
Conirmatory Factorial Analysis: Unidimensional
Structure
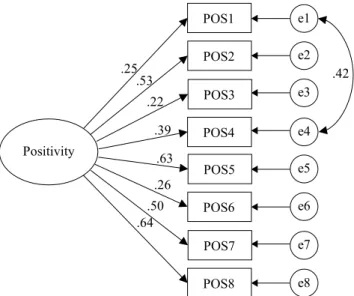
As the authors of the original version of the Positivity Scale suggest, and in accordance with the indings of Study 1, it was sought to check its one-factor structure, determining that all of its eight items saturate in a general dimension. The following adjustment indicators were obtained for the estimator ML: χ2(20) = 97.36, p < .001, χ2/gl = 4.86, CFI = .74, TLI = .64 and RMSEA = .11 (CI 90% = .093-.139), below the expected. However, taking into consideration the Modiication Indices (MI),
the correlation between the pairs of errors referent to the items 1 and 4 (MI = 43.29) was determined, resulting in more promising indicators: χ2(19) = 48.48, p < .001, χ2/gl = 2.55, CFI = .90, TLI = .85, RMSEA = .07 (CI 90% = .048-.099) and SRMR = .05. Proximate results were observed for the ADF estimator: χ2(19) = 39.20, p < .001, χ2/gl = 2.06, RMSEA = .06 (CI 90% = .033-.088) and SRMR = .06, with the exception of the two indicators which may be inluenced by the sample size (CFI = .79 and TLI = .69). All the factorial weights (lambdas) were statistically different from zero (λ≠ 0; z > 1.96, p < .05), varying between .22 (Item 3) and .64 (Item 8), with a mean of .43. The factorial structure resulting from this analysis is summarized in Figure 2.
Figure 2. Factorial structure of the positivity scale.
POS1
POS2
POS3
POS4
POS5
POS6
POS7
POS8 Positivity
.25 .53
.22
.39
.63
.26
.50 .64
e1
e2
e3
e4
e5
e6
e7
e8 .42
Convergent Validity and Composite Reliability
Initially, with the aim of verifying evidence of the PS’ convergent validity, the calculation of average variance extracted was used, corroborating the adequacy of this parameter (.64). However, in order to bring together complementary evidence of convergent validity, its correlations with similar constructs were calculated. In particular, the correlation of positivity with life satisfaction (r = .53, p < .001) and subjective vitality (r = .54, p < .001) was observed. Finally, the Composite Reliability was calculated in order to conirm the parameter of internal consistency, with a coeficient of .65 being observed, which was considered to be adequate.
Discussion
consistency). Although instruments exist in Brazil which measure positive behaviors (Gouveia et al., 2005, 2012), no measure was found which dealt speciically with positivity as a tendency for people to act positively regarding their own lives. As a result, this undertaking is considered relevant, as it offers evidence of a psychometrically-adequate measure for use in research and even in the clinical ambit. The principal results are discussed below.
With the aim of investigating the adequacy of the one-factor solution of this measure, the authors used multiple criteria (e.g., parallel analysis, optimal coordinates, acceleration factor), the results being practically the same. Consistently with the study by Caprara et al. (2012), the exploratory factorial analysis (PAF method) revealed a single factor, retaining the eight items of the original version, with saturations within that considered adequate (Tabachnick & Fidell, 2013).
In order to conirm the one-factor structure in Study 1, a conirmatory factorial analysis was undertaken. This solution was corroborated, above all when the suggestion to correlate the measurement errors of two of the items was taken into account; in this case, adjustment indicators stipulated in the literature were observed (Hair et al., 2009). In relation to the internal consistency of the PS, this was evaluated through two indicators: (a) the Cronbach’s alpha coeficient (α), which presented a value higher than those found by Caprara et al. (2012); and (b) composite reliability, which met the cut-off point commonly accepted by the literature for research purposes (.60) (Škerlavaj & Dimovski, 2009). The need to correlate two errors may indicate a luctuation of the measure, but may also reveal some problem of overlap of content or inadequacy of the response scale for evaluating these items. Indeed, item 1 (as occurred with item 3) was one of those which presented a lower saturation.
Conclusion
In spite of what was commented previously, the studies described here are not free of criticism, it being possible to identify some limitations; for example, the samples considered. These were not probabilistic samples. Most were composed of university students. Although this does not invalidate the indings described, one cannot generalize from them to the entire Brazilian population. For that, further studies will be necessary which have this speciic purpose. However, as the objective centered on ascertaining this measure’s psychometric parameters, the numbers considered (n ≥ 200) seem adequate to this purpose (Hair et al., 2009). One can, therefore, be conident that the general objective was achieved.
Regarding the studies required, it is necessary to think about bringing together evidence of the discriminant validity of the PS, showing, for example, that it has a speciic role among the measures of subjective well-being, as well as not being affected by social desirability response bias. Equally, it will be necessary to check evidence of this measure’s temporal stability. However, it would perhaps be more innovative to think of a measure which takes implicit
associations into account, making a more sensitive indicator for this construct possible. Finally, as a speciic characteristic of the individual, it may be that positivity is related to personality traits [e.g., sociability (+), emotional stability (-)] and human values [e.g., interactive (+), promotion (-)].
References
Bostic, T. J., Rubio, D. M., & Hood, M. (2000). A validation of the subjective vitality scale using structural equation modeling. Social Indicators Research, 52(3), 313-324. doi:10.1023/A:1007136110218
Caprara, G. V., Alessandri, G., Eisenberg, N., Kupfer, A., Steca, P., Caprara, M. G.,. Abela, J. (2012). The positivity scale. Psychological Assessment, 24(3), 701-712. doi:10.1037/a0026681
Caprara, G. V., Alessandri, G., Trommsdorff, G., Heikamp, T., Yamaguchi, S., & Suzuki, F. (2011). Positive orientation across three cultures. Journal of Cross-Cultural Psychology, 43(1), 77-83. doi:10.1177/0022022111422257
Caprara, G. V., Steca, P., Alessandri, G., Abela, J. R., & McWhinnie, C. M. (2010). Positive orientation: Explorations on what is common to life satisfaction, self-esteem, and optimism. Epidemiologia e Psichiatria Sociale, 19(1), 63-71. doi:10.1017/S1121189X00001615 Diener, E. (1984). Subjective well-being. Psychological
Bulletin, 95(3), 542-575. doi:10.1037/0033-2909.95.3.542 Diener, E., Emmons, R. A., Larsen, R. J., & Grifin,
S. (1985). The satisfaction with life scale. Journal of Personality Assessment, 49(1), 71-75. doi:10.1207/s15327752jpa4901_13
Fornell, C., & Larcker, D. F. (1981). Evaluating structural equation models with unobservable variables and measurement error. Journal of Marketing Research, 18(1), 39-50. doi:10.2307/3151312
Gouveia, V. V., Barbosa, G. A., Andrade, E. O., & Carneiro, M. B. (2005). Medindo satisfação com a vida dos médicos no Brasil. Jornal Brasileiro de Psiquiatria, 54(4), 298-305.
Gouveia, V. V., & Gabriel, M. S. (2013). Calculadoras de validade de construto (CVC). João Pessoa, PB: BNCS/ Universidade Federal da Paraíba.
Gouveia, V. V., Milfont, T. L., Gouveia, R. S. V., Medeiros, E. D., Vione, K. C., & Soares, A. K. (2012). Escala de Vitalidade Subjetiva - EVS: Evidências de sua adequação psicométrica. Psicologia: Teoria e Pesquisa, 28(1), 5-13. doi:10.1590/S0102-37722012000100002
Hair, J. R., Jr., Black, W. C., Babin, B. J., Anderson, R. E., & Tatham, R. L. (2009). Análise multivariada de dados (A. S. Sant’Anna, Trans., 6th ed.). São Paulo, SP: Bookman. Kozma, A., Stone, S., & Stones, M. J. (2000). Stability in
Linley, P. A., Maltby, J., Wood, A. M., Osborne, G., & Hurling, R. (2009). Measuring happiness: The higher order factor structure of subjective and psychological well-being measures. Personality and Individual Differences, 47(8), 878-884. doi:10.1016/j.paid.2009.07.010
Mokken, R. J., & Lewis, C. (1982). A nonparametric approach to the analysis of dichotomous item responses. Applied Psychological Measurement, 6(4), 417-430. doi:10.1177/014662168200600404
Oviedo, H. C., & Campo Arias, A. (2005). Aproximación al uso del coeiciente alfa de Cronbach. Revista Colombiana de Psiquiatría, 34(4), 527-580.
Paludo, S. S., & Koller, S. H. (2007). Psicologia positiva: Uma nova abordagem para antigas questões. Paidéia (Ribeirão Preto), 17(36), 9-20. doi:10.1590/S0103-863X2007000100002
Pimentel, C. E., Gunther, H., & Black, P. U. V. (2012). Acessando o medo do crime: Um survey por meio da internet. Psicologia Argumento, 30(69),411-421.
R Development Core Team. (2011). R: A language and environment for statistical computing. Vienna, Austria: R Foundation for Statistical Computing.
Raiche, G., & Magis, D. (2014). Package ‘nFactors’: Parallel analysis and non graphical solutions to the Cattell scree test. Retrieved from http://cran.r-project. org/web/packages/nFactors/nFactors.pdf
Raiche, G., Walls, T. A., Magis, D., Riopel, M., & Blais, J.-G. (2013). Non-graphical solutions for Cattell’s scree test. Methodology: European Journal of Research Methods for the Behavioral and Social Sciences, 9(1), 23-29. Revelle, W. (2014). Psych: Procedures for personality and
psychological research. Retrieved from http://CRAN.R-project.org/package=psych
Rizopoulos, D. (2006). ltm: An R package for latent variable modeling and item response theory analyses. Journal of Statistical Software, 17(5), 1-25.
Ryan, R. M., & Frederick, C. M. (1997). On energy, personality, and health: Subjective vitality as a dynamic relection of well-being. Journal of Personality, 65(3), 529-565. doi:10.1111/j.1467-6494.1997.tb00326.x Schäfer, J., Opgen-Rhein, R., Zuber, V., Ahdesmäki,
M., Silva, A. P. D., & Strimmer, K. (2013). Package
‘corpcor’: Eficient estimation of covariance and
(partial) correlation. Retrieved from http://cran.r-project. org/web/packages/corpcor/corpcor.pdf
Scheier, M. F., & Carver, C. S. (2001). Adapting to cancer: The importance of hope and purpose. In A. Baum & B. L. Andersen (Eds.), Psychosocial interventions for cancer (pp. 15-36). Washington, DC: American Psychological Association.
Scorsolini-Comin, F., & Santos, M. A. (2009). Psicologia Positiva e os instrumentos de avaliação no contexto brasileiro. Psicologia: Relexão e Crítica, 23(3), 440-448. doi:10.1590/S0102-79722010000300004
Seligman, M. E. P. (2002). Positive psychology, positive prevention, and positive therapy. In C. R. Snyder & S. J. Lopez (Eds.), Handbook of positive psychology (pp. 3-9). New York, NY: Oxford University Press.
Seligman, M. E. P., & Csikszentmihalyi, M. (2000). Positive psychology: An introduction. American Psychologist, 55(1), 5-14. doi:10.1037/0003-066X.55.1.5
Škerlavaj, M., & Dimovski, V. (2009). Organizational learning and performance in two national cultures: A multi-group structural equation modeling approach. In W. R. King (Ed.), Knowledge management and organizational learning (Vol. 4, pp. 321-366). New York, NY: Springer.
Tabachnick, B. G., & Fidell, L. S. (2013). Using multivariate statistics (6th ed.). Boston, MA: Allyn & Bacon.
van der Ark, L. A. (2012). New developments in Mokken Scale analysis in R. Journal of Statistical Software, 48(5), 1-27.
Watson, R., Deary, I. J., & Shipley, B. (2008). A hierarchy of distress: Mokken scaling of the GHQ-30. Psychological Medicine, 38(4), 575-579. doi:10.1017/S003329170800281X
Roosevelt Vilar Lobo de Souza is a M.S. candidate of the Graduate Program in Social Psychology at the Universidade Federal da Paraíba.
Rafaella de Carvalho Rodrigues Araújo is a Ph.D. candidate of the Graduate Program in Social Psychology at the Universidade Federal da Paraíba.
Rildésia Silva Veloso Gouveia is a Full Professor of the Cento Universitário João Pessoa.
Gabriel Lins de Holanda Coelho is a Ph.D. candidate in Psychology at Cardiff University.
Valdiney Veloso Gouveia is a Full Professor of the Universidade Federal da Paraíba.
Received: Dec. 31, 2013 1st Revision: June 30, 2014 2nd Revision: Aug. 27, 2014
Approved: Sep. 10, 2014
How to cite this article: