Article
Sternberg’s Triangular Love Scale National Study of Psychometric Attributes
1 Vicente Cassepp-Borges2Universidade Federal da Grande Dourados, Dourados-MS, Brasil
Luiz Pasquali
Universidade de Brasília, Brasília-DF, Brasil
Abstract: Even though Sternberg’s Triangular Love Scale (STLS) has been increasingly used in Brazilian research, all the relevant studies have been conducted at a state level. The objective of this study was to investigate the psychometric attributes of the scale at a national level. The STLS was applied to a sample of 1,549 participants from 13 Brazilian states. The results suggest that STLS is an excellent test, with the three-factor structure predicted by the theory and a high level of reliability
(α = 0.98). The Item Response Theory showed that STLS has highly discriminative items, assessing a large share of the population, although low dificulty was applied. We suggest keeping complex items in the scale in order to maintain a reliable
and valid measure of love.
Keywords: Love, Intimacy, Passion, Factor Analysis, Item Response Theory.
Estudo Nacional dos Atributos Psicométricos da Escala Triangular do
Amor de Sternberg
Resumo: A Escala Triangular do Amor de Sternberg (ETAS) vem sendo cada dia mais utilizada em pesquisas no Brasil. No
entanto, todos seus estudos ocorreram a nível estadual. Este artigo teve como objetivo conhecer os atributos psicométricos da
escala a nível nacional. A ETAS foi aplicada em uma amostra de 1549 participantes de 13 Unidades da Federação brasileiras. Os resultados sugerem que a ETAS é um excelente teste, com a estrutura de três fatores prevista pela teoria e um elevado nível de precisão (α = 0,98). A Teoria de Resposta ao Item mostrou que a ETAS possui itens bastante discriminativos, avaliando uma boa faixa da população, embora com baixa diiculdade. Sugere-se a manutenção dos itens complexos na escala, com a inalidade de ter-se uma medida válida e precisa do amor.
Palavras-chave: Amor, Intimidade, Paixão, Análise Fatorial, Teoria de Resposta ao Item.
Estudio Nacional de los Atributos Psicométricos de la Escala Triangular
del Amor de Sternberg
Resumen: La Escala Triangular del Amor de Sternberg (ETAS) viene siendo a cada día más utilizada en investigaciones en
Brasil. Sin embargo, todos sus estudios fueron a nivel estadual. El objetivo de este estudio fue investigar las propiedades
psicométricas de la escala a nivel nacional. La ETAS fue aplicada a una muestra de 1549 participantes de 13 Unidades de la Federación brasileña. Los resultados sugieren que ETAS es una excelente prueba, con la estructura de tres factores prevista por la teoría y un alto nivel de precisión (α = 0,98). La Teoría de Respuesta al Ítem mostró que la ETAS tiene ítems muy discriminatorios, evaluando un buen nivel de la población, pero con diicultad baja. Sugiere-se el mantenimiento de los ítems complejos de la escala, con el propósito de tener una medida iable y válida de amor.
Palabras clave: Amor, Intimidad, Pasion, Analisis Factorial, Teoria de Respuesta al Item.
1 Paper derived from the PhD thesis of the irst author under the supervision
of the second, defended in the Post-graduate Program in Social Psychology of Work and Organizations, of the Universidade de Brasília. Support: Coordination for the Improvement of Higher Education Personnel (CAPES).
2 Correspondence address:
Vicente Cassepp-Borges. Universidade Federal da Grande Dourados, Unidade II. Faculdade de Ciências Humanas, gabinete 16, Rodovia Dourados. Itahum, Km 12. Caixa Postal, 533. CEP: 79.804-970. Dourados-MS, Brazil. E-mail: [email protected]
Measuring love is something that has been considered impossible. However, even if love is a feeling treated as mysterious, everyone has the realization that sometimes they love more and sometimes less, which shows that the
phenomenon exists in different quantities. Love is something that exists. As it exists, it exists in a certain quantity. To try to discover the amount or intensity of love that exists in each person is to perform measurements. The dificulties inherent in the measurement of love are practically the same dificulties inherent in the measurement of intelligence, personality, depression and other objects traditionally evaluated by Psychometrics.
characterized by feelings of closeness and connection in the relationship. Passion is the component responsible for physical and sexual attraction, for romance and the desire to be together, and for excitement. Finally, Decision/ commitment refers to the certainty of loving and being loved and the desire to maintain the relationship over the long term. The majority of couples have the three dimensions present in their relationships (Sternberg, 1988), however, other types of relationships in which some of the elements are present reveal the relative independence of the three vertices.
Sternberg’s Triangular Love Scale (STLS) has 45 items, of which 15 measure Intimacy, 15 Passion and 15 Decision/commitment. Each of these items is evaluated with a Likert type scale, where one point represents “not at all”, 5 “moderately” and 9 “extremely”. There are no labels for the points in between those indicated. The triangular love scale still has the peculiarity of having a blank space in all 45 statements. This space should be illed with the name of the same loved one for all the items.
The study of the STLS construct validation was conducted in the United States with the participation of 84 heterosexual adults. The participants responded to the irst version of the STLS and Rubin’s scales of liking and loving (1970), used for the external validation of the STLS. Each scale was answered six times, describing the love for the mother, father, for a brother, for a friend of the same sex, for the person who they love and for an ideal lover. The quantiication of the importance of the love was made by another group of participants for the six relationships described above. The results showed that the effect of the ‘gender’ variable was not statistically signiicant. Nevertheless, the women obtained higher indices of the perception of love for the best friend and ideal lover. Considering all the participants, the mean for the person they love and the ideal lover were much higher than for the others, especially in the Passion component (Sternberg, 1997).
The scale obtained excellent indices of internal consistency. All the alpha values were above 0.90 (αintimacy =
0.91; αpassion, = 0.94; αdecision/commitment = 0.94; αtotal = 0.97). The
correlation coeficients between the three subscales ranged from 0.71 to 0.73. These high correlations can be credited to the fact that the scale has been applied with couples, a sample in which it is expected that all the components of the triangle are present in their relationships. This permits a hypothesis of the existence of a general factor (love), beyond the three primary factors (Intimacy, Passion and Decision/ commitment). Not all the items saturated more strongly in the factor for which it was expected that this would occur (Sternberg, 1997).
Other psychometric studies, in various parts of the world, also found the same evidence of validity and reliability highlighted by Sternberg (1997). The original version of the STLS (with the difference that the Likert scale had ive points) had several items saturating in more than one factor,
however, found alphas between 0.93 and 0.96 for the subscales and 0.97 for the total scale (Hendrick & Hendrick, 1989). The STLS presented a high concordance in the reapplication after two weeks, however, the correlation between factors is reported as the weak point of the scale (Chojnacki & Walsh, 1990). A possible solution to the problem of the saturation of items in more than one factor is the reduction in the number of items in the STLS to six in each subscale (Lemieux & Hale, 2000). In this way, the items loaded in the intended factor and the alpha values remain very good (between 0.89 and 0.94), although lower. The results of Lemieux and Hale (2000) were replicated with Dutch adolescents (Overbeek, Ha, Scholte, De Kemp, & Engels, 2007), and the reduced scale proved to be a reliable instrument, with convergent validity (correlation with satisfaction in the relationship) and construct validity, both in the exploratory and the conirmatory factor analysis.
In Brazil, reports have been increasing regarding the Triangular Theory of Love. The majority of the Brazilian studies on the theory have used the STLS. In this sense, the irst study found was that of Hernandez (1999), who investigated the factorial structure of the scale. This study, however, has several limitations, such as a small sample size. The second study which used the STLS was the Master’s thesis of Custódio (2002). This study investigated the levels of love between teachers of Paraná and, with a sample of 114 questionnaires returned out of the 350 delivered, did not discuss the metric properties obtained. This step was taken by Cavalcanti (2007), who presents a discussion of the factor analysis of the scale in a larger sample (610 participants), suggesting a reduced version of the STLS of 15 items. The STLS presented good factorial validity and adequate indices of reliability (Cavalcanti, 2007; Gouveia, Fonseca, Cavalcanti, Diniz & Doria, 2009). In a temporally concomitant study, Cassepp-Borges and Teodoro (2007) used a sample of 362 participants and, although employing a different translation of the instrument (Cassepp-Borges, Balbinotti, & Teodoro, 2010), also found adequate psychometric properties for its application in Brazil.
The main indings in Brazil are that the dimensions of love have a practically null relationship with jealousy and the reactions to scenarios of inidelity (Cavalcanti, 2007). Cassepp-Borges and Teodoro (2009) found that the three dimensions of love relate positively to the satisfaction in the relationships (measured by a direct question with a Likert type scale), although Passion goes in the multiple linear regression model in a negative way, due to a suppression effect. Another important inding of that study is that which suggests that the dimensions of love reach ever higher levels according to the temporal phase of the relationship.
the study of Gouveia et al. (2009), performed in Paraíba, the others present data from populations of the south of Brazil (Rio Grande do Sul and Paraná). All the studies worked with samples of university students. It should be noted that the majority of the studies are recent, which may represent a growth of interest in the Triangular Theory of Love.
It can be seen that several studies in Brazil have used the STLS, however, all the studies presented results in the area in which the scale was applied. In view of this, a study of national proportions of the scale is necessary. Although there are already studies on its properties (Cassepp-Borges & Teodoro, 2007; Gouveia et al., 2009; Hernandez, 1999), the Brazilian version of the STLS has still not been applied nationally. The present study principally aimed to verify the evidence of validity and reliability of the STLS in Brazil, also seeking to discover the parameters of dificulty and discrimination of this scale, according to the Item Response Theory.
Method
Participants
This study had the participation of 1,549 people, the mean age was 25.17 years (SD = 7.74). The participants came from the states of Santa Catarina (n = 65), São Paulo (n =
70), Rio de Janeiro (n = 95), Espírito Santo (n = 19), Sergipe
(n = 54), Rio Grande do Norte (n = 113), Piauí (n = 98),
Maranhão (n = 217), Pará (n = 67), Acre (n = 66), Rondônia
(n = 73), Goiás (n = 29) and Brasilia (n = 583). The total sample included 1,048 (67.7%) women and 500 (32.3%) men. The majority of the participants had incomplete higher education (n = 1299; 84.7%), with 5.6% (n = 86) having
completed a higher education course and 9.7% (n = 149) not
having started university.
The majority of the participants responded to the survey basing themselves in a stable romantic relationship (n =
831; 53.6%), the name given to the grouping of categories boyfriend/girlfriend, iancé, married and living together. Probably because they were young, the majority of the participants in a stable romantic relationship (n = 473, 56.9%)
were dating. Nearly a ifth of the respondents completed the instruments considering a loved object that they did not have (n = 301; 19.4%), being a platonic love (n = 118; 39.2%)
or a former love (n = 183; 60.8%). A considerable number
of participants based themselves in an unstable romantic relationship (“casual”, a relationship without commitment, for example; n = 166; 10.7%), and there were people who
responded based on someone who they were related to (n =
69; 4.5%).
Instruments
A questionnaire was applied with demographic questions, including gender, date of birth, course (if it were a university student) and sexual orientation. In this questionnaire, it was asked that the participants write the name of someone they loved. From there, questions were asked about the type and length of relationship with that person. The Brazilian version of the Sternberg Triangular Love Scale (STLS) was also used (Cassepp-Borges & Teodoro, 2007). This version was adapted from the original in English (Sternberg, 1997) and has 45 items, with 15 for Intimacy, 15 for Passion and 15 for Decision/commitment. All the items have a blank to be illed with the name of a single loved one, and are answered on a Likert type scale of 1 to 9. In a previous study (Cassepp-Borges et al., 2010) the scale was translated into Portuguese by the procedure of double back translation. Subsequently, all the items passed through semantic analysis and analysis by judges.
Procedures
Data Collection
Although there was no control over the exact numbers, the applications of the questionnaires were, in general, collective. In some cases, there were individual applications. One task of the participants was to choose a person that they love and to respond to the survey based on their relationship with that person. They were asked to preferably choose someone with whom they composed a loving couple.
Data Analysis
Component Empirical
eigenvalues eigenvaluesRandom variance% of accumulated%
1 22.58 1.35 50.2 50.2
2 3.14 1.31 7.0 57.2
3 1.82 1.29 4.0 61.2
4 1.22 1.27 2.7 63.9
5 1.04 1.24 2.3 66.2
6 0.98 1.23 2.2 68.4
...
45 0.12 0.70 0.3 100.0
Kaiser-Meyer-Olkin index (KMO) (Kaiser, 1974). Although reported, Bartlett’s test of sphericity (1950) was not taken into account, because it is a very sensitive indicator of the sample size. For these analyzes, the pairwise method was used to deal with missing cases, because it takes advantage of how the subject responded to calculate the correlation matrix. The item with the lowest number of respondents was chosen to determine the sample size in order to perform the parallel analysis.
Subsequently, the Principal Axis Factoring - PAF extraction was performed to determine the factor loadings of the items. The residual unexplained covariance was used in order to review the decision regarding the number of factors. This is an a posteriori criterion, because it is performed after the extraction of the factors with the PAF. It consists of reproducing the correlation matrix from the factorial matrix. The difference between the original correlation matrix and the reproduced matrix is the residual covariance. This analysis seeks a solution with low residual covariance and, at the same time, parsimony (lower number of possible factors) (Pasquali, 2005). The internal consistency was calculated using the Cronbach’s alpha and Guttman’s lambda 2.
The dificulty and the discrimination of the items were analyzed in the light of Item Response Theory (IRT) (Pasquali, 2007), using the PARSCALE 4.1 for Windows® program. This theory has been used in order to determine these two parameters. According to Vendramini and Dias (2005), the items with parameter a (discrimination) lower than 0.30, or with parameter b (dificulty) outside the range in
which it is expected to be located (between -2.95 and + 2.95) would be considered problematic. Baker (2001), however, suggests categories of discrimination, treating discrimination lower than 0.64 as low and up to 1.34 as moderate. The high indices of discrimination would be greater than 1.35. The items should still be distributed in different ranges of dificulty (Pasquali, 2004). It should be noted that, in analyzing instruments with a Likert type scale using the IRT, when an item is classiied as easy or dificult, this is referring to the ease or dificulty that the participants have to agree or disagree with the statements, more speciically to the θ level necessary to agree with the item (Nunes et al., 2008).
Ethical Considerations
This research project was approved by the Research Ethics Committee of the Institute of Humanities of the Universidade de Brasília on October 2, 2009. All the participants were asked to sign Terms of Free Prior Informed Consent in duplicate, with one copy remaining with the participant and the other given to the researcher.
Results
Initially, an analysis of the principal components of the ETAS was performed to determine the number of factors of the instrument. The factorability levels of the matrix were excellent (KMO = 0.980, χ2Bartlett = 54223.748, df = 990, p
< 0.001). From there, the empirical and random eigenvalues and the explained variance for the components of the STLS (Table 1) were taken as the criterion for deciding the number of components. Although reported in a table, the eigenvalues described would be those used for producing the Scree plot graph.
Table 1
Parallel Analysis and Total of the Explained Variance for the Components of the STLS
Table 1 shows that only three factors are suficient to explain a high percentage of the variance of the STLS (61.2%). It is perceived that the third empirical eigenvalue is greater than the third random eigenvalue, however, the fourth empirical eigenvalue is smaller than the fourth random eigenvalue, suggesting three factors from the parallel analysis criteria. Table 2 was constructed based on Table 1, allowing the conclusion that the solution with three factors is most appropriate, as suggested by the Triangular Theory of Love. This decision is supported by the criterion of Harman, however, mainly by the parallel analysis, which is a more precise criterion for deciding the number of factors (Laros, 2005).
Criterion Number of
factors Comments
Kaiser (K-1) At least 5 The fifth and sixth eigenvalues are very close to 1.
Harman 3 The fourth factor explains 2.7% of the variance.
Visual inspection of the Scree plot* 1. 2 or 3 The Scree plot indicates three components. Although the solutions with one or two is also plausible.
Parallel Analysis 3 The three factors are very clear from the parallel analysis.
Theoretical criterion 3 Intimacy. Passion and Decision/commitment.
Intimacy Passion Decision/Commitment* h2 Single factor (Love)
ETAS 34 Intimacy 0.85 0.69 0.75
ETAS 17 Intimacy 0.84 0.59 0.68
ETAS 41 Intimacy 0.78 0.66 0.73
ETAS 14 Intimacy 0.78 0.64 0.73
ETAS 21 Intimacy 0.74 0.65 0.76
ETAS 11 Intimacy 0.72 0.57 0.70
ETAS 39 Intimacy 0.70 0.59 0.73
ETAS 36 Intimacy 0.66 0.54 0.70
ETAS 10 Intimacy 0.65 0.55 0.71
ETAS 35 Decision 0.61 0.55 0.71
ETAS 06 Intimacy 0.60 0.53 0.70
ETAS 03 Intimacy 0.59 0.55 0.67
ETAS 24 Intimacy 0.57 0.38 0.58
ETAS 44 Intimacy 0.56 0.37 0.72 0.82
ETAS 20 Passion 0.45 0.37 0.58 0.72
ETAS 04 Intimacy 0.41 0.38 0.59 0.76
ETAS 37 Decision 0.40 0.37 0.56 0.75
ETAS 09 Passion 0.42 0.64
ETAS 25 Passion 0.74 0.58 0.47
ETAS 27 Passion 0.74 0.58 0.49
ETAS 15 Passion 0.73 0.55 0.45
ETAS 13 Passion 0.66 0.50 0.48
ETAS 30 Passion 0.66 0.62 0.59
ETAS 12 Passion 0.63 0.59 0.62
Table 2
Criteria Considered in the Decision regarding the Number of Factors to Extract from the STLS Based on Table 1
Note. The Scree plot graph is not presented in the article because it can be obtained by means of the eigenvalues presented in Table 1.
The PAF extraction with an oblique rotation (Direct Oblimin) method was used. The fact that there is probably a general factor is highlighted, suggested by the values of the correlations between factors (rIntimacy and Passion = 0.68; p < 0.001; rPassion and Decision/commitment = 0.75; p < 0.001; and rIntimacy and
Decision/commitment = 0.89; p < 0.001). Therefore, Table 3 presents
the factorial loadings in the three extracted factors and in one single general factor. The communalities (h2) indicate
the relationship of the item with the general construct of the scale (love). In order to facilitate the comprehension of Table 3, the items are identiied according to the factor provided for them by Sternberg (1997).
Table 3
Pattern Factor Loadings and Commonalities of the STLS with the Principal Axis Factoring Method and Direct Oblimin Rotation with Kaiser Normalization
Table 3
Continuation
Intimacy Passion Decision/Commitment* h2 Single factor (Love)
ETAS 40 Passion 0.43 0.38 0.38 0.49
ETAS 08 Passion 0.39 0.59 0.74
ETAS 22 Decision 0.83 0.75 0.81
ETAS 45 Decision 0.82 0.77 0.81
ETAS 23 Decision 0.77 0.52 0.65
ETAS 31 Decision 0.76 0.75 0.84
ETAS 16 Passion 0.74 0.57 0.70
ETAS 32 Decision 0.73 0.63 0.76
ETAS 43 Decision 0.73 0.77 0.82
ETAS 26 Decision 0.70 0.68 0.80
ETAS 29 Intimacy 0.64 0.62 0.75
ETAS 02 Decision 0.62 0.57 0.74
ETAS 18 Passion 0.61 0.60 0.74
ETAS 01 Passion 0.60 0.33 0.53
ETAS 42 Decision 0.55 0.54 0.72
ETAS 07 Decision 0.46 0.52 0.72 0.79
ETAS 28 Decision 0.49 0.62 0.79
ETAS 05 Passion 0.33 0.46 0.52 0.68
ETAS 33 Decision 0.34 0.46 0.58 0.76
ETAS 19 Decision 0.46 0.48 0.68
ETAS 38 Passion 0.36 0.38 0.55 0.71
Loading/Commonality mean 0.617 0.548 0.581 0.585 0.694
Eigenvalue (after rotation) 18.84 9.87 19.52 22.6
% of Variance 41.87 21.93 43.38 40.1
α 0.959 0.915 0.966 0.976
Guttman’s Lambda 2 0.961 0.917 0.968 0.978
Items 19 11 23 45
Note. All the loadings of the factor Decision/commitment were multiplied by - 1. so as to facilitate their comprehension. Factor loadings less than 0.30 were omitted. Explained variance: 1 factor = 49.1%; 2 factors = 55.2%; 3 factors = 58.5%. Residual Covariance: 1 factor = 43.0%; 2 factors = 24.0%; 3 factors = 11.0%. Communalities (h2) regarding the model with three factors and estimated before the rotation. The items have the name of the factor provided by
Sternberg.
As can be seen, the three factors found are in fact provided by the Triangular Theory of Love (Sternberg, 1986). The irst factor has the majority of the items of the Intimacy subscale, the second of the Passion subscale and the third the Decision/ commitment subscale. The complex items (loadings greater than 0.32 in more than one factor) were included in all the factors with those that possess a related factor loading. Thus, nine items (04, 05, 07, 20, 33, 37, 38, 40, and 44) belong to two factors at the same time and one item (09) represents no factor (included, however, in the calculations relating to the dimension of love - complete scale). The internal consistency of the Intimacy (α = 0.96; 19 items), Passion (α = 0.92; 11 items) and Decision/commitment (α = 0.97; 23 items) scales is excellent. All the items were considered for calculating the reliability of the STLS, since the lowest commonality
was 0.452 (item 15). Thus, the scale obtained an alpha value equal to 0.98 (45 items), conirming that the STLS is a test with excellent internal consistency.
Item
Love Intimacy Passion Decision/Commitment.
ritem-total rpolyserial
Parameters Parameters Parameters Parameters
a b a b a b a b
1 1.52 0.20 1.78 0.21 0.54 0.58
2 2.03 - 0.58 2.33 - 0.48 0.72 0.79
3 1.55 - 0.62 1.74 - 0.58 0.63 0.69
4 2.36 - 0.79 2.39 - 0.71 2.53 - 0.69 0.74 0.81
5 1.86 - 0.42 1.88 - 0.34 2.02 - 0.33 0.65 0.70
6 1.58 - 0.27 1.76 - 0.20 0.66 0.71
7 1.94 - 0.10 2.06 - 0.10 2.34 - 0.11 0.75 0.81
8 1.99 - 0.34 2.01 - 0.31 0.74 0.80
9 1.81 - 0.88 0.66 0.74
by a single latent variable, not because the response to one item inluenced the response to the other. This second assumption is more dificult to verify empirically (Pasquali, 2007). However, because different studies (Sternberg, 1997; Gouveia et al., 2009) present the scale in different orders to the present study and have found similar psychometric properties, there is some evidence that the order of items is not interfering in the response to them.
For the analyses with the IRT, the scale was evaluated in its entirety and in the dimensions Intimacy, Passion and Decision/commitment. The irst analysis indicated that the correlation matrix was singular, i.e. with determinant equal to zero, preventing further analysis. To resolve this problem, the parameter Scale was ixed at 1.0, eliminating the correction
of the logistic model to the normal model.
Furthermore, this reduced the number of possible alternatives for responding to the items. Probably in order to increase the variability of the responses, Sternberg (1997) chose to use Likert type scales with more alternatives, however, the increase in alternative means there is a greater number of estimations to be made. Often items with three or four response alternatives provide the same information as items with seven or nine (Nunes et al., 2008). For this reason, in order to try to obtain a nonsingular matrix, the grouping of alternatives was performed in order to reduce their number. The transformation was to reduce the Likert type scale that ranges from 1 to 9 into a scale ranging from 1 to 5. Thus, the alternatives were grouped, 1, 2 and 3 (1), 4 and 5 (2), 6 and 7 (3), 8 (4) and 9 (5). Although initially this appears to be an unequal grouping, there is an asymmetric pattern to the data, as alternatives 7, 8 and 9 concentrate 63.6% of the responses. Therefore, more alternatives were grouped at the beginning of the scale. As expected, the loss of information is very small, since the correlation between the original STLS and the transformed STLS is high (r = 0.98; p < 0.001).
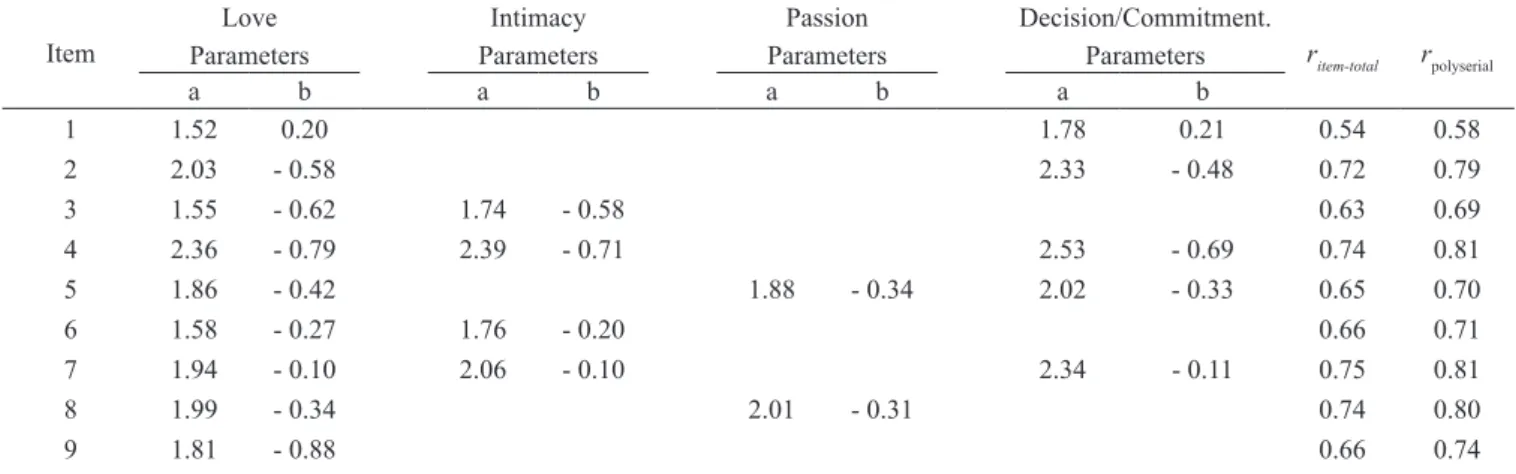
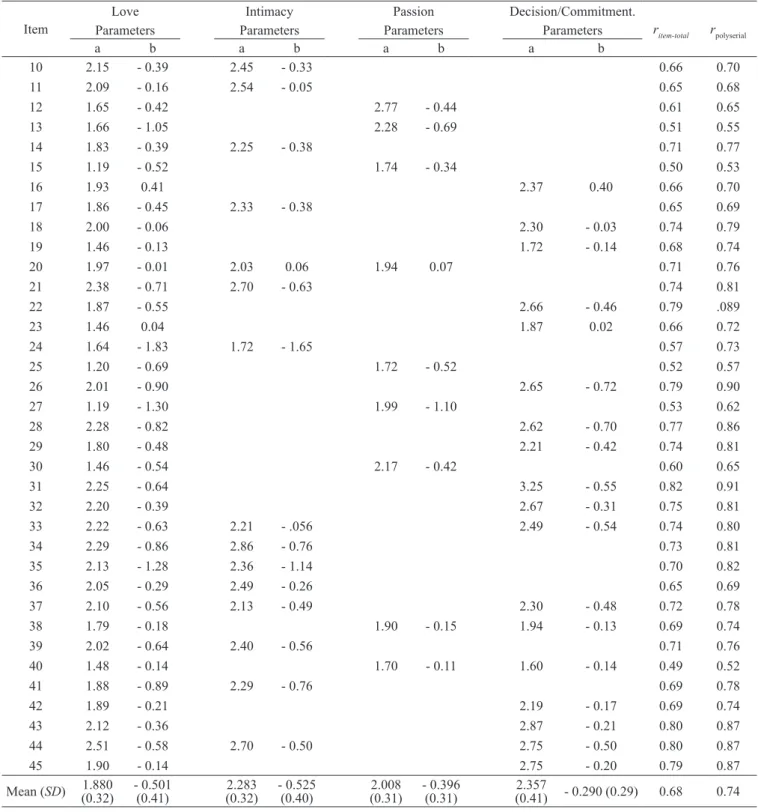
All the items have negative asymmetrical distribution, ranging from - 0.215 (item 16) to -2.974 (item 45), and all
the asymmetry standard errors were 0.63. This occurrence, however, does not translate into a drop in assumption of the IRT (Pasquali, 2007). The scales should merge easy, medium and dificult items (Pasquali, 2004), and an asymmetric distribution may result from the dificulty or ease of the items. Thus, Table 4 presents the analysis of the items of the STLS according to the IRT. The items were very discriminative, with similar values in the general factor and the speciic factors of love. In general, the items are easy, i.e. people tend to agree with them. Only three items (1, 16 and 23) have positive dificulty values, although they are close to zero. The item-total correlations (rit), however, are high, suggesting that all the items are measuring the same construct. There are no “dificult” items in the STLS, which disrupts the distribution by range of dificulty and the information of the scale. This can be partly explained by the phenomenon of social desirability. After the encouragement to choose a person who they love, it is desirable that the people report that they feel love. Some study participants may have had dificulties in afirming that their feeling of love was not so strong.
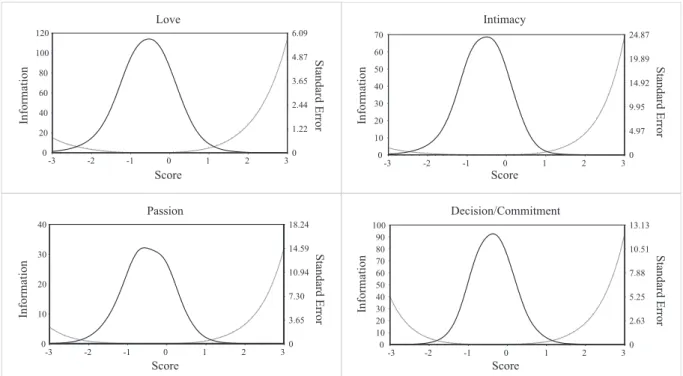
Figure 1 shows the information curves of the STLS total and of the Intimacy, Passion and Decision/commitment subscales. The information ranges from the four scales are very similar. In general, the scales are useful for evaluating subjects whose score θ is less than ± 1.1 standard deviation, i.e. approximately of the 85th percentile. This means that the scale has dificulties to discriminate the group of the 15% with higher levels of love. Despite this limitation, caused mainly by the lack of dificult items in the instrument, the portion of the population that the STLS evaluates is large. Regarding the mean, the STLS and its subscales approached the normal model. Due to the high correlation between the factors and items composing two subscales, the information curves and the distribution of the θ levels around the mean were similar for the STLS and for the factors Intimacy, Passion and Decision/commitment.
Table 4
Table 4
Continuation
Item
Love Intimacy Passion Decision/Commitment.
ritem-total rpolyserial
Parameters Parameters Parameters Parameters
a b a b a b a b
10 2.15 - 0.39 2.45 - 0.33 0.66 0.70
11 2.09 - 0.16 2.54 - 0.05 0.65 0.68
12 1.65 - 0.42 2.77 - 0.44 0.61 0.65
13 1.66 - 1.05 2.28 - 0.69 0.51 0.55
14 1.83 - 0.39 2.25 - 0.38 0.71 0.77
15 1.19 - 0.52 1.74 - 0.34 0.50 0.53
16 1.93 0.41 2.37 0.40 0.66 0.70
17 1.86 - 0.45 2.33 - 0.38 0.65 0.69
18 2.00 - 0.06 2.30 - 0.03 0.74 0.79
19 1.46 - 0.13 1.72 - 0.14 0.68 0.74
20 1.97 - 0.01 2.03 0.06 1.94 0.07 0.71 0.76
21 2.38 - 0.71 2.70 - 0.63 0.74 0.81
22 1.87 - 0.55 2.66 - 0.46 0.79 .089
23 1.46 0.04 1.87 0.02 0.66 0.72
24 1.64 - 1.83 1.72 - 1.65 0.57 0.73
25 1.20 - 0.69 1.72 - 0.52 0.52 0.57
26 2.01 - 0.90 2.65 - 0.72 0.79 0.90
27 1.19 - 1.30 1.99 - 1.10 0.53 0.62
28 2.28 - 0.82 2.62 - 0.70 0.77 0.86
29 1.80 - 0.48 2.21 - 0.42 0.74 0.81
30 1.46 - 0.54 2.17 - 0.42 0.60 0.65
31 2.25 - 0.64 3.25 - 0.55 0.82 0.91
32 2.20 - 0.39 2.67 - 0.31 0.75 0.81
33 2.22 - 0.63 2.21 - .056 2.49 - 0.54 0.74 0.80
34 2.29 - 0.86 2.86 - 0.76 0.73 0.81
35 2.13 - 1.28 2.36 - 1.14 0.70 0.82
36 2.05 - 0.29 2.49 - 0.26 0.65 0.69
37 2.10 - 0.56 2.13 - 0.49 2.30 - 0.48 0.72 0.78
38 1.79 - 0.18 1.90 - 0.15 1.94 - 0.13 0.69 0.74
39 2.02 - 0.64 2.40 - 0.56 0.71 0.76
40 1.48 - 0.14 1.70 - 0.11 1.60 - 0.14 0.49 0.52
41 1.88 - 0.89 2.29 - 0.76 0.69 0.78
42 1.89 - 0.21 2.19 - 0.17 0.69 0.74
43 2.12 - 0.36 2.87 - 0.21 0.80 0.87
44 2.51 - 0.58 2.70 - 0.50 2.75 - 0.50 0.80 0.87
45 1.90 - 0.14 2.75 - 0.20 0.79 0.87
Mean (SD) 1.880 (0.32)
- 0.501
(0.41) (0.32)2.283
- 0.525
(0.40) (0.31)2.008 - 0.396 (0.31) (0.41)2.357 - 0.290 (0.29) 0.68 0.74
-3 -2 -1 0 1 2 3 0 20 40 60 80 100 120 Score In fo rm at io n Love 0 1.22 2.44 3.65 4.87 6.09 S ta n d ar d E rr o r
-3 -2 -1 0 1 2 3
0 10 20 30 40 Score In fo rm at io n Passion 0 3.65 7.30 10.94 14.59 18.24 S ta n d ar d E rr o r
-3 -2 -1 0 1 2 3
0 10 20 30 40 50 60 70 Score In fo rm at io n Intimacy 0 4.97 9.95 14.92 19.89 24.87 S ta n d ar d E rr o r
-3 -2 -1 0 1 2 3
0 10 20 30 40 50 60 70 80 90 100 Score In fo rm at io n Decision/Commitment 0 2.63 5.25 7.88 10.51 13.13 S ta n d ar d E rr o r
Figure 1. Information curves of the STLS and of its Intimacy, Passion and Decision/Commitment subscales.
Discussion
The ETAS is an instrument with very good psychometric properties. It has a very factorable matrix, high loadings, excellent levels of reliability and extremely discriminative items. There is a limitation that the ETAS presents generally easy items, not reliably evaluating the portion of the population with higher levels of love. However, the structure with three factors of the STLS is still an empirical support for the Triangular Theory of Love.
It is suggested that the determined factor for each item in the American version be revised, in accordance with the empirical data encountered. The fact that the items are not directed for the factor expected is recurrent evidence in the Brazilian studies (Cassepp-Borges & Teodoro, 2007; Gouveia et al., 2009; Hernandez, 1999). The fact that we present a study with a relatively large sample and from different parts of Brazil supports the revision of the factor to which each item belongs. Regardless of the arrangement of the items, the reliability maintained the excellent levels found in previous studies (Chojnacki & Walsh, 1990; Hendrick & Hendrick, 1989; Lemieux & Hale 2000; Overbeek et al., 2007; Sternberg, 1997).
The STLS presents some complex items (with loading in more than one factor). Mathematically, this does not represent a problem, however, it hinders the interpretation of the results. The fact that the factors are correlated explains this phenomenon. Commonly, the solution adopted is the exclusion of the complex items. This kind of decision, however, can be questioned. An item with a high loading in
of love, though would not discriminate regarding the kind of love. For this reason, even though many studies (Cassepp-Borges & Teodoro, 2007; Gouveia et al., 2009) have suggested reduced versions of the STLS that are quite useful, it is interesting to maintain a complete version, without the removal of items, in order to retain a more accurate measure of love which is comparable with the original version. The complete STLS has an excellent level of reliability (α = 0.98), which would be reduced with the removal of items. The complete STLS is a more precise measure of love than any reduced version. The more precise measures of Intimacy, Passion and Decision/commitment are also those of the STLS. Because the factors are very interrelated, it is expected that there are items loading in more than one factor. To exclude the complex items would be the same as saying that behavior does not exist that refers to Intimacy and Passion, for example, at the same time. More than that, it would manipulate the property of the correlation between the factors in an artiicial manner.
Conclusions
others. It cannot be forgotten that the STLS is a measure of love based on self-reporting, it is known that this does not always correspond to the real measure of the love of people. Although there is evidence such as convergent validity and predictive criterion validity of the STLS (Cassepp-Borges, 2010), there is no data regarding the test-retest reliability in Brazil, as presented internationally (Chojnacki & Walsh, 1990). However, regarding the technology available to the psychologist to measure love, the STLS constitutes one of the best instruments. Love exists and can be measured. More than this, love can be measured with validity and reliability.
References
Baker, F. B. (2001). The basics of item response theory
(2nd ed.). Washington, DC: ERIC Clearinghouse on Assessment and Evaluation.
Bartlett, M. S. (1950). Tests of signiicance in factor analysis.
British Journal of Statistical Psychology, 3(2), 77-85.
Cassepp-Borges, V. (2010). Amor e construtos relacionados: Evidências de validade de instrumentos de medida no Brasil (Tese de doutorado não publicada). Universidade
de Brasília, Brasília, DF.
Cassepp-Borges, V., Balbinotti, M. A. A., & Teodoro, M. L. M. (2010). Tradução e validação de conteúdo: Uma proposta para a adaptação de instrumentos. In L. Pasquali (Org.), Instrumentação psicológica: Fundamentos e
prática (pp. 506-520). Porto Alegre: Artmed.
Cassepp-Borges, V., & Teodoro, M. L. M. (2007). Propriedades psicométricas da versão brasileira da Escala Triangular do Amor de Sternberg. Psicologia: Relexão & Crítica, 20(3), 513-522.
Cassepp-Borges, V., & Teodoro, M. L. M. (2009). Versión reducida de la Escala Triangular del Amor: Características de sentimiento en Brasil. Revista Interamericana de
Psicología, 43(1), 30-38.
Cattell, R. B. (1966). The scree test for the number of factors.
Multivariate Behavioral Research, 1(2), 245-276.
Cavalcanti, J. P. N. (2007). Reações a cenários de inidelidade conjugal: São o amor e o ciúme explicações? (Dissertação de mestrado não publicada). Universidade Federal da Paraíba, João Pessoa.
Chojnacki, J. T., & Walsh, W. B. (1990). Reliability and concurrent validity of the Sternberg Triangular Love Scale. Psychological Reports, 67(1), 219-224.
Custódio, C. E. G. (2002). Análise da satisfação e equilíbrio amoroso em docentes universitários casados
(Unpublished master´s thesis). Pontifícia Universidade Católica do Rio Grande do Sul, Porto Alegre, RS. De Andrade, A. L., & Garcia, A. (2009). Atitudes e crenças
sobre o amor: Versão brasileira da Escala de Estilos de Amor. Interpersona, 3(1), 89-102.
Enzmann, D. (1997). RanEigen: A program to determine the parallel analysis criterion for the number of principal components. Applied Psychological Measurement, 21(3), 232.
Gouveia, V. V., Fonseca, P. N., Cavalcanti, J. P. N., Diniz, P. K. C., & Dória, L. C. (2009). Versão abreviada da Escala Triangular do Amor: Evidências de validade fatorial e consistência interna. Estudos de Psicologia (Natal), 14(1), 31-39.
Harman, H. H. (1967). Modern factor analysis (2nd ed.). Chicago, IL: The University of Chicago Press.
Hendrick, C., & Hendrick, S. S. (1989). Research on love: Does it measure up? Journal of Personality and Social Psychology, 56(5), 784-794.
Hernandez, J. A. E. (1999). Validação da estrutura da Escala Triangular do Amor: Análise fatorial conirmatória.
Aletheia, (9), 15-25.
Kaiser, H. F. (1974). An index of factorial simplicity.
Psychometrika, 39(1), 31-36.
Laros, J. A. (2005). O uso da análise fatorial: Algumas diretrizes para pesquisadores. In L. Pasquali (Org.),
Análise fatorial para pesquisadores (pp. 163-184).
Brasília, DF: LabPAM.
Lemieux, R., & Hale, J. L. (2000). Intimacy, passion, and commitment among married individuals: Further testing of the Triangular Theory of Love. Psychological Reports, 87(3, Pt 1), 941-948.
Nunes, C. H. S. S., Primi, R., Nunes, M. F. O., Muniz, M., Cunha, T. F., & Couto, G. (2008). Teoria de Resposta ao Item para otimização de escalas tipo likert – um exemplo de aplicação. Revista Iberoamericana de Diagnóstico y Evaluación Psicológica, 25(1), 51-79.
Overbeek, G., Ha, T., Scholte, R., De Kemp, R., & Engels, R. C. M. E. (2007). Brief report: Intimacy, passion, and commitment in romantic relationships – Validation of Triangular Love Scale for adolescents. Journal of Adolescence, 30(3), 523-528.
Pasquali, L. (2004). Psicometria: Teoria dos testes na psicologia e na educação (2a ed.). Petrópolis, RJ:
Vozes.
Pasquali, L. (2005). Análise fatorial para pesquisadores.
Brasília, DF: LabPAM.
Pasquali, L. (2007). Teoria de Resposta ao Item: Teoria, procedimentos e aplicações.Brasília, DF: LabPAM. Rubin, Z. (1970). Measurement of romantic love. Journal of
Personality and Social Psychology, 16(2), 265-273.
Sternberg, R. J. (1986). A triangular theory of love.
Psychological Review, 93(2), 119-135.
Sternberg, R. J. (1988). The triangle of love. New York, NY:
Basic Books.
Vendramini, C. M. M., & Dias, A. S. (2005). Teoria de Resposta ao Item na análise de uma prova de estatística em universitários. Psico-USF, 10(2), 201-210.
Vicente Cassepp-Borges is Adjunct Professor of the Faculty
of Human Sciences
from Universidade Federal da Grande Dourados, Dourados (MS), Brazil.
Luiz Pasquali is Emeritus Professor of the Institute of
Humanities from Universidade de Brasília, Brasília (DF), Brazil.