química
Volume 35, número 4, 2010 Artigo/ArticleArtigo/ArticlePOTENTIOMETRIC AND CONDUCTIMETRIC STUDIES
OF CHEMICAL EQUILIBRIA FOR PYRIDOXINE
HYDROCHLORIDE IN AQUEOUS SOLUTIONS: SIMPLE
EXPERIMENTAL DETERMINATION OF PKA VALUES
AND ANALYTICAL APPLICATIONS TO
PHARMACEUTICAL ANALYSIS
1 1
Thiago de Almeida Drumond dos Santos , Diego Oliveira da Costa ,
2 1*
Samuel Silva da Rocha Pita , Felipe Silva Semaan 1
Departamento de Química Analítica, Instituto de Química da Universidade Federal Fluminense, Outeiro de São João Batista, s/n, 24020-150, Niterói, RJ, Brasil
2
Instituto de Biofísica Carlos Chagas Filho, Universidade Federal do Rio de Janeiro, Avenida Carlos Chagas Filho, s/n, 21941-902, Rio de Janeiro, RJ, Brasil
*
Author to whom correspondence should be addresses (fax: +55 21 2629-2129; e-mail [email protected])
Abstract: The combination of two low-cost classical procedures based on titrimetric techniques is presented for the determination of pyridoxine hydrochloride in pharmaceuticals samples. Initially some experiments were carried out aiming to determine both pKa1 and pKa2 values, being those compared to values of literature and theoretical procedures. Commercial samples containing pyridoxine hydrochloride were electrochemically analysed by exploiting their acid-base and precipitation reactions. Potentiometric titrations accomplished the reaction between the ionizable hydrogens present in pyridoxine hydrochloride, being NaOH used as titrant; while the conductimetric method was based on the chemical precipitation between the chloride of pyridoxine hydrochloride molecule and Ag+ ions from de silver nitrate, changing the conductivity of the solution. Both methods were applied to the same commercial samples leading to concordant results when compared by statistical tests (95 and 98% confidence levels). Recoveries ranging from 99.0 to 108.1% were observed, showing no significant interference on the results.
Keywords: pharmaceuticals; pyridoxine hydrochloride; potentiometric titration; conductimetric titration.
Introduction
th
Since 18 century many concepts on che-mistry had been based on or changed by the applicati-on of classical procedures. These had been applied for both qualitative and quantitative purposes for at least two centuries [1,2] but, although their contribu-tion is simply undeniable, the applicacontribu-tion of classical procedures decreased substantially from their first developments to nowadays.
Among the classical procedures, volumetric titrations are, certainly, the most common and exploi-ted, not only with basic purposes but also on a practical analytical point of view. Regarding to these procedures we can summarize a volumetric titration as a procedure in which accurate aliquots of a well-known solution is added to a system, the reaction is accomplished and the end-point is defined by measuring some reliable property [3,4]. Nowadays these procedures based on fast and stoichiometric reactions among accurate volumes and/or masses of reactants are basically applied to check the concen-tration of solutions prepared with other objectives, being rarely applied to the analysis of real samples.
Few reports showed some interesting applications of volumetric titration on pharmaceuti-cal analysis, being them based on different reactions [5,6] and ways of detection. In this sense a special role is played by spectrophotometric [5,7], potentio-metry [8,9] and conductipotentio-metry [10].
Although some remarks had being described concerning to the determination of pyridoxine by potentiometric titration according to the European Pharmacopoeia 4.0 (2002) [11], this procedure, which consists in titrate the analyte with sodium hydroxide in ethanolic media was carried out by [12], in this case, the impossibility of making corrections due to the presence of alcohol lead to the adaptation of this method to another based on chloride as a base in a mixture of formic acid/acetic anhydride, using as standard perchloric acid.
Aiming to overcome some observed draw-backs of potentiometric titrimetry many different approaches were done, specially intending to speed up the analysis and to improve both selectivity and sensitivity. In this sense, different electrodes and strategies were described.
Plasticized electrodes showed to be the most used with the intention of modification. Using poly(vinyl chloride, PVC) as plasticizer different strategies of modifications were reported; an interesting approach is described by [13]. In this case, sensors were prepared by using the ion-association complexes of the pyridoxine cation with molibdophosphate and tungstophosphate counter anions as ion pairs. Another report, also using PVC as plasticizer, exploited â-cyclo dextrins as ionophores
in a carboxilated support matrix [14].
Changing the plasticizer to di-isooctyl phthalate, [15] proposed a method based on the use of calyx-8-arene as a neutral carrier in presence of phosphotungstic acid as an ion extruder. In all these
cases electrodes reached nernstinian responses and good stability.
Other examples of solid electrodes with these goals are phosphorus-doped and undoped glassy carbon indicator electrodes, applied under control-led-current conditions by [16].
Taking into account the applicability of such concepts in both basic and applied analytical chemistry, the present report intends to show some adaptations of acid-base and argentimetric titrations with potentiometric and conductimetric detections to the study of chemical equilibria and to quantify the analyte in pharmaceutical samples comparing with some theoretical classical calculations.
Experimental details
Reagents and solutions
Standard solutions of NaOH and AgNO with 3
different concentrations were prepared by direct dissolution of respective salts in analytical grade of purity (both from Merck, Germany) in bi-distilled water. The standardization of each was done by using proper primary standards, following previously described procedures [2-4]. Pyridoxine hydrochlori-de was obtained in its pure form (99.8%) from
®
Pharmanostra (Italy), being used as received, without further purification steps. All solutions were prepared just before use.
®
Commercial samples of Dramin B , 6 ®
Nycomed , consisting in tablets (in an average weigh of 0.2086 g each tablet, n = 16 units) containing 10 mg pyridoxine hydrochloride and 50 mg dimenhydrinate, apart the excipients, were pulveri-zed until the obtainment of an homogeneous fine powder; suitable amounts of this powder were taken and prepared, regarding to the average mass of a tablet and the procedure to be carried out.
Apparatus
According to the proposed goals some experiments were done by potentiometric and conductimetric titrimetry using an Analyser 300 M pH-meter equipped with a combined glassy electrode and a Digimed conductivimeter equipped
2
Procedures
All titrations were realized by adding small aliquots (100 – 250 ìL) from suitable standards over
50 mL aliquots of standards/samples under a constant and slight stirring, being the homogenization step interrupted at the moment of detection. Depending on the reaction to be accomplished concentrations of samples and standards were optimized in order to better exploit the analytical signals. Corrections of the analytical signals in order to minimize effects of dilution were done according to [7,10].
Theoretical and experimental determinations of pKa
The ionization constant (K ) is obtained from a
the activity ratio of conjugated base and conjugated acid multiplied with proton activity. The protonation (or deprotonation) in molecules depend significantly on the position disturbed by proton transfer, which modifies the partial charge of the molecule being this change measurable.
By observing pyridoxine structure (Figure 1) it is possible to identify a phenol and a nitrogen group, suggesting possibilities of proton transfer in aqueous media. This way, the first step taken was the comparison between pK values obtained from two a
distinct analyis: theoretical calculations, applying molecular modeling software Marvin [17], and experimental techniques.
Results and discussions
Theoretical and experimental determinations of pKa
Chemical properties of molecules depend largely on their ionized state and most organic molecules (such as pyridoxine) are capable of transferring a proton to aqueous solution. According to Brönsted's rule, acidic character is assigned to any molecule due to its capability of donate a proton when facing a solvent (mainly water). The protonati-on (or deprotprotonati-onatiprotonati-on) in molecules depend
signifi-Figure 1. Ionic equilibria of pyridoxine hydrochloride in aqueous solution. NH+
OH HO
HO
Cl-NH+
OH HO
HO
+ Cl
-NH+
OH HO
HO
N
OH HO
HO
+ H2O + Na+
N
OH HO
HO N
OH HO
-O
+ H2O + Na
K
+ a1
Ka2
+ NaOH
cantly on the position disturbed by proton transfer, which modifies the partial charge of the molecule being this change measurable.
By observing pyridoxine structure it is possible to identify a phenol and a nitrogen group, suggesting possibilities of proton transfer in aqueous media. This way, the first step taken was the compari-son between pK values obtained from two distinct a
analysis: theoretical calculations, applying molecu-lar modeling software Marvin [17], and experimental techniques.
The Marvin software indicated seven possible forms for pyridoxine from 1 to 14 in pH scale; we focused in the first three ones due to their abundance (> 95% species). This fact can be explained by their fast proton exchange when surrounded by water, whereas other species could not be significantly measured in such conditions (Figure 1).
Moreover, by using potentiometric titration, values for acidic dissociations were experimentally defined. At first, aliquots of pyridoxine hydrochloride 10 mM (50 mL) were titrated with standard NaOH 0.2 M (prepared or corrected before use) as presented by
Figure 2. Considering Henderson-Hasselback equation and all events from the starting point to the end (neutralization, buffer formation and hydrolysis) it was possible to calculate values for both involved pK .a
Values obtained from both theoretical and experimental procedures are presented in Table 1, and both are well compared to those expected for phenol group and pyridine ring [18]. Variations in experimental and theoretical values can be attributed to the different points considered in each procedure: in theoretical calculations, no solvent effect is considered, on the other hand, in experimental techniques, both solvent and intramolecular inductive effects take place and lead to more realistic data in such conditions.
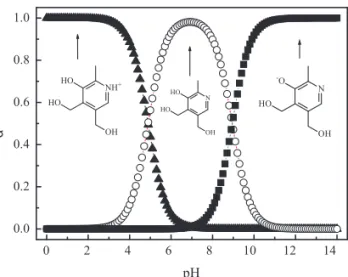
Aiming to better understand the fractional distribution (á) of the analyte in aqueous media in
function of pH, each component was calculated and plotted by using experimentally determined values of pK and pK (Figure 3). a1 a2
Table 1. Expected and determined pKa for pyridoxine in aqueous media.
Marvin software [17] Potentiometric titration* Expected [18]
Nytrogen of pyridine ring 5.6 5.1 ± 0.02 5.2
Phenol group 8.6 9.0 ± 0.03 9.8
* n = 3
Figure 2. Acid-base potentiometric titration curve for 50 mL pyridoxine hydrochloride standard (10 mM) by NaOH 0.2 M and its firt derivative.
0 1 2 3 4 5 6 7
3 4 5 6 7 8 9 10 11
Vol NaOH / mL
pH
0 1 2 3 4 5
dpH/dV
Figure 3. Fractional distribution of pyridoxine hydrochloride in its possible forms according to pH values, according to the experimentally determined K and K values.a1 a2
0 2 4 6 8 10 12 14
0.0 0.2 0.4 0.6 0.8 1.0
N
OH HO
-O
N
OH HO
HO
NH+
OH HO
HO
á
Potentiometric titration of samples
At an analytical point of view, the knowledge of the analyte´s acidic behavior and its distribution allow its determination by a simple potentiometric acid-base titration. In this case, suitable amounts of the previously obtained power were taken and dissolved in water, being this filtered and adjusted in order to reach 1 mM in pyridoxine hydrochloride; some aliquots (50 mL) of the resultant solution were titrated with standard NaOH 0.02 M (also prepared and corrected before use). Although found results are in good agreement to those expected for the commer-cial samples, it is well known that some other substances present in tablets can represent interferen-ces on the final result; this way in the persent work we proposed another procedure, based in the stoichio-metric proportion between chloride ions and pyridoxine in aqueous solutions.
Conductimetric titration of samples
Based on the stoichiometry between chloride ions and pyridoxine in aqueous media, a conductime-tric procedure exploited the precipitation of AgCl by adding aliquots of AgNO 0.015 M on suitable 3
volumes of prepared samples. In this case, masses of powder were solubilized in water and filtered as cited before, being the expected final concentration of
-4
chloride correspondent to 6 x 10 M. changes on conductivity were accomplished and corrected before results analysis. The parallel analysis of the sample by both procedures showed good agreement, demonstrating the applicability of classical reactions on pharmaceutical analysis.
Recovery tests based on both proposed procedures
The assessment of matrix effects on the final results was carried out by some recovery tests. In
both cases (potentiometry and conductimetry) solutions were prepared aiming to reach the same previously cited concentrations of analite but, in this case, two different proportions between real sample and standard pyridoxine hydrochloride (25:75 and 50:50, % m:m) were evaluated. Titrations were
carried out as cited before, showing no significant interference from matrix.
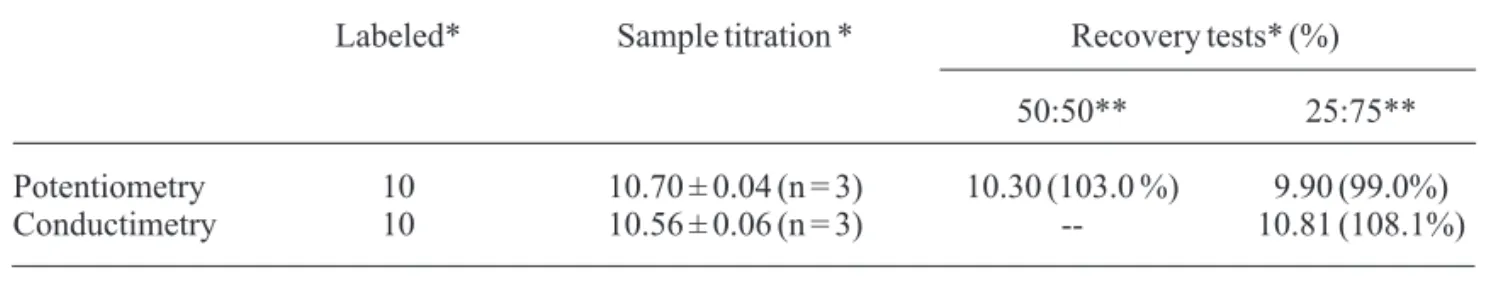
All results found for both procedure and recovery tests, as well as labeled values, are presen-ted in Table 2.
Statistical analysis by tpooled-tests pointed to a
good agreement between the results for both experimental techniques (98% confidence level), as well as the comparison of them to the recovery tests, which confirms their applicability to commercial samples.
Conclusions
In this work experiments were carried out in order to define values for pK (referent to the nitrogen a
and phenol groups) being the results, in this case, compared to those found in a theoretical model and in literature. Concerning to the analytical point of view both proposed procedures, potentiometric and conductimetric titration, had demonstrated reliability, accuracy, precision and cost-effective, specially when combined. Despite the possibilities of interference by other components from the sample, such as dimenhydrinate and excipients, the combination between the applied reactions showed good agreement at 95 and 98% levels of confidence (tpooled-tests),
pointing to their application to some real samples.
Acknowledgements
Diego Oliveira da Costa is grateful to
Table 2. Values found for a commercial sample.
Labeled* Sample titration * Recovery tests* (%)
50:50** 25:75**
Potentiometry 10 10.70 ± 0.04 (n = 3) 10.30 (103.0 %) 9.90 (99.0%) Conductimetry 10 10.56 ± 0.06 (n = 3) -- 10.81 (108.1%)
FAPERJ (E-26/100.401/2010) and Samuel Silva da Rocha Pita to Brazilian Research Council - CNPq (141810/2008-4), for financial support. Sincere acknowledgements are also addressed to GQA-UFF.
References
[1] J. A. Goldman, L. Meites, Analytica Chimica Acta, 30 (1964) 28.
[2] J. Terra, A. V. Rossi, Química Nova, 28 (1)(2005) 166. [3] D. A. Skoog, D. M. West, F. J. Hooler, Fundamentals of Analytical Chemistry, Saunders College Publishing,
th
Philadelphia, 7 edn., 1997, chap. 12 and 13.
[4] G. D. Christian, Analytical Chemistry, Wiley and Sons, th
New York, 5 edn., 1994, chap. 22.
[5] K. Basavaiah, B. S. Somashekar, Eclética Química, 32 (1)(2007) 19.
[6] R. A. Sousa, E. T. G. Cavalheiro, Eclética Química, 34 (3)(2009) 41.
[7] R. A. Sousa, F. S. Semaan, J. A. F. Baio, E. T. G. Cavalheiro, Eclética Química, 30 (3)(2005) 79.
[8] P. R. S. Ribeiro, A. O. Santini, H. R. Pezza, L. Pezza, Eclética Química, 28 (1)(2003) 39.
[9] R. A. Sousa, E. T. G. Cavalheiro, Eclética Química, 34 (2)(2009) 23.
[10] E. R. Sartori, W. T. Soarez, O. Fatibello-Filho, Química Nova, 32 (7)(2009) 1947.
[11] K. Takacs-Novac, G. Volgyi, Analytica Chimica Acta, 507 (2)(2004) 275.
[12] N. Kos, J. P. Surmann, Pharmazie, 61 (5)(2006) 414. [13] G. A. E. Mustafa, Journal of Analytical Chemistry, 58 (11)(2003) 1073.
[14] R. A. Pires, A. N. Araújo, M. C. B. S. M. Montenegro, P. Chocholous, P. Solich, Journal of Pharmaceutical and Biomedical Analysis, 46 (4)(2008) 683.
[15] V. D. Vaze, A. K. Srivastava, Journal of Pharmaceutical and Biomedical Analysis, 47 (1)(2008) 177.
[16] B. F. Abramovic, V. J. Guzsvany, F. F. Gaal, Journal of Pharmaceutical and Biomedical Analysis, 37 (2)(2005) 265. [17] Marvin Sketch version 5.3.1. Copyright 1998-2010 © ChemAxon Ltda. www.chemaxon.com.