química
Volume 35, número 4, 2010 Artigo/ArticleArtigo/ArticleA SIMPLE SPECTROPHOTOMETRIC METHOD FOR
THE DETERMINATION OF TETRACYCLINE AND
DOXYCYCLINE IN PHARMACEUTICAL
FORMULATIONS USING CHLORAMINE-T
José L. Rufino*; Flávio C. B. Fernandes; Mayara S. Ruy; Helena R. Pezza; Leonardo Pezza
São Paulo State University - UNESP, Institute of Chemistry of Araraquara, P.O. Box 355, 14801-970, Araraquara, SP, Brazil
*To whom correspondence should be addressed.
E-mail: [email protected]
Abstract: A simple, rapid, accurate and inexpensive spectrophotometric method for the determination of tetracycline and doxycycline has been developed. The method is based on the reaction between these drugs and chloramine-T in alkaline medium producing red color products with absorbance maximum at the ë = 535 and 525 nm for the tetracycline and doxycycline, respectively. The best conditions for the reactions have been found using
-5 –4 -1 -5
multivariate method. Beer´s law is obeyed in a concentration ranges 1.03 x 10 to 3.61 x 10 mol L and 1.75 x 10
–4 -1 -6
to 3.48 x 10 mol L for the tetracycline and doxycycline, respectively. The quantification limits were 5.63 x 10
-1 -7 -1
mol L and 7.12 x 10 mol L for the tetracycline and doxycycline, respectively. The proposed method was successfully applied to the determination of these drugs in pharmaceutical formulations and the results obtained were in good agreement with those obtained by the comparative method at the 95% confidence level.
Keywords: tetracycline, doxycycline, chloramine-T, spectrophotometric.
Introduction
Tetracycline-series antibiotics occupy a leading place amongst broad-spectrum antibiotics. They suppress the reproduction of positive and Gram-negative microorganisms, acid-resistant bacilli,
Rickettsia and many viruses [1-3]. Owing to such a broad spectrum of action, they are widely used to combat infections and human disease and also for veterinary therapy [4-6]. Several methods have been reported for their determinations, both in pharmaceutical formulati-ons and biological samples (fluids and tissues) including methods such as spectrophotometric [7-10], amperome-tric [11,12], chemiluminescence [13,14], spectrofluori-metric [15,16] and liquid chromatographic [17-23].
The official monographs of the United States Pharmacopoeia [24] describe methods for the determi-nation of tetracycline (TC) and doxycycline (DXC) and
they are based on high-performance liquid chromato-graphy (HPLC), but the conditions to determine each compound are quite different. The biological assay proposed by the British Pharmacopoeia [25] is time-consuming and not suitable for routine analysis.
This paper describes a simple, rapid, sensitive and inexpensive method for the determination of TC and DXC in pharmaceutical formulations based on the spectrophotometric detection of the colored product formed by the reaction between these drugs and chloramine-T (CAT) in alkaline medium.
Experimental
Apparatus
on a Spectrophotometer USB 4000 (Ocean Optics, Dunedin, USA) and cell of path length 10 mm. Sealpette and Eppendorf micropipettes were used to measure the small volumes in the experiments.
A thermostatic bath equipped with a PT-100 temperature sensor having a resolution of 0.1°C and a N322-T digital temperature controller was used for heating.
Reagents and analytical solutions
High purity deionized water (resistivity 18.2 M? cm) obtained by using a Milli-Q Plus system (Millipore Corp., Bedford, MA, USA) was used throughout. All reagents were of analytical grade. The excipients used in the interference study were of
pharmaceutical grade. Stock solution of Na CO (E. 2 3
Merck, Darmstadt, Germany) 1.0% (w/v) was prepared in water and working solutions were prepared by appropriate dilution of the stock solution. Solutions of chloramine-T trihydrate (J.T.Baker, Mexico, purity Active Chlorine 13%) 6.0% (w/v) were prepared in water; the solution was stable for a period of 2 weeks
0
when refrigerated (4 C).
Pharmaceutical grade tetracycline hydrochlo-ride was purchased from Henrifarma (Brazil, purity 99.3%); doxycycline hydrochloride was purchased from Deg (Brazil, purity 99.0%) and standard
-2 -1
solutions were daily prepared as 1.04 x 10 mol L
-3 -1
and 1.75 x 10 mol L of TC and DXC, respectively in
-5
water. Working standard solutions 1.04 x 10 -3.61 x
–4 -1 -5 –4 -1
10 mol L of TC and 1.75 x 10 -3.48 x 10 mol L of DXC were prepared by appropriate dilution of the standard solutions in water.
Optimization of variables
The variables were optimized by fractional factorial planning and response surface methodology
4-1
[26]. A fractional factorial design (2 ) was carried out to distinguish the significant parameters. The result of this design was used to plan a subsequent design having a central composite, which was performed using the same procedure. All statistical calculations were performed using Statistic 6.0 software.
Samples preparation
Two commercial samples of pharmaceutical formulations (capsules) containing 500 mg of tetracycline hydrochloride and three commercial
samples (tablets) containing 100 mg of doxycycline hydrochloride from different batches and different brands were purchased in local drugstores in Araraqua-ra city, (BAraraqua-razil) and analysed by the proposed method.
Ten tablets (or capsules) of each commercial brand pharmaceutical to be studied were weighed exactly; the tablets were grounded to a fine powder and homogenized. A portion of this powder equiva-lent to approximately 50 mg of drug was accurately weighed. The sample was dissolved with 25 mL of water, transferred to a 50 mL volumetric flask and the volume was completed with water. In the sequence, this solution was filtered through Whatman 41 filter-paper.
Tetracycline: An aliquot of 1.0 mL of the
filtrate was transferred to a 10 mL volumetric flask. 0.7
mL of Na CO and 2.5 mL of chloramine-T solutions 2 3
were added and the volume was completed with water. After 15 minutes, the absorbance value was recorded at 535 nm against a blank similarly treated.
Doxycycline: An aliquot of 0.5 mL of the
filtrate was transferred to a 10 mL tube. 0.7 mL of Na2CO3 and 2.5 mL of chloramine-T solutions and 1.3 mL of water were added. The tube was closed and heated in a water-bath at 65±1(ºC) for 5 min. The solution was cooled to room temperature and the absorbance value was recorded at 525 nm against a blank similarly treated.
Results and Discussion
Chloramine-T has been adopted for the determination of many organic compounds [29-32]. Its use depends mainly on its ability to cause oxidation of diverse functional groups. It acts as a selective oxidizing agent in both acid and alkaline medium [33].
Preliminary tests revealed that the reaction of tetracyclines with CAT in an alkaline medium of Na2CO3 forms red color products at room tempera-ture. In the sequence, was studied the stability of the products formed of reaction of the tetracycline and of the doxycycline. The product of the tetracycline reactions showed stability after 12 minutes elapsed and remained stable for at least 40 minutes at room temperature, whereas, the product of reaction with doxycycline not showed stability. However, undertaken testes using heating in bath Maria by 10
0
Table 1. Nominal values: levels (-1) and (+1).
Variable Low level (-1) High level (+1)
Na CO (mL) 2 3 0.5 1.0
Chloramine-T (mL) 2.0 3.0
Temperature (ºC) 60 80
Time (minutes) 5 10
Optimization of variables using multivariate analysis
When more than one variable is potentially important, it is difficult to obtain optimal conditions throughout the commonly used step-by-step optimization procedure. In these cases, multivariate analysis has been extensively applied to determine the best conditions for the analytical methods employed [3,34,35]. The experimental design offers an efficient route to identify the conditions yielding the best results. Many variables can be screened simultaneously to determine which of them has a significant effect. The interactions between variables are obtained and from few experiments the variables can be optimized. Robustness is an important feature of analytical method development, which can also be verified in this way [3,36,37].
For the reaction between tetracycline and CAT in alkaline medium, two variables (CAT and
Na CO volumes) were involved in the experimental 2 3
design. In this case, a central composite design was used for the purpose of this study. For this design, it was necessary to do twelve experiments in which the two variables were studied at five levels including four central points for statistical validity within the range –1.41 to +1.41, which corresponds to the CAT
with a volume range of 1.8 to 3.0 mL and Na CO 2 3
with a volume range of 0.5 to 0.9 mL. The center points are very important because they yield information concerning the repeatability of the design [36]. These ranges were chosen based on preliminary experiments.
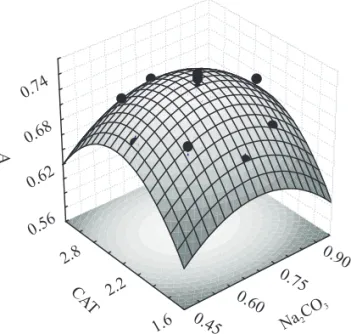
The surface response plots constructed by plotting absorbance as a function of important variables are shown in Figure 1. In this figure, it is possible to identify that the point referring to the best conditions for the maximum response were CAT
volume of 2.5 mL and Na CO volume of 0.7 mL. The 2 3
quadratic regression model is give by:
2
Z = -0.42431 + 1.17201x -0.85773x + 0.61534y
-2
0.12561y + 0.00504xy,
where Z represents the response factor corresponding
to the absorbance value. The factors x and y are the
Na CO and the CAT concentration, respectively. 2 3
The responses of the model, the R values, 2
were greater than 0.94, informing us that the data fitted the model well for the absorbance response.
However, to stabilize the doxycycline reaction, it is necessary to heat for a determined time.
In this case, four variables: temperature, time, and the
volumes of CAT and Na CO . 2 3
4-1
Initially, a 2 fractional factorial design was carried out, which allowed simultaneously studying four factors that could have an important effect on the absorbance signal. In this planning, the variables were studied at two levels: low (-1) and high (+1). For this design, 8 experiments were necessary, which were realized in triplicate and randomized to eliminate any environmental variation. The variables and their levels are summarized in Table 1. The highest and lowest values of each variable were defined based on preliminary experiments. The
2
responses of the model, the R values, were greater than 0.99, implying that the data fitted the model well in regard to the absorbance response.
0.74
0.90 0.75 0.60 0.45
0.68
0.56 2.8
2.2 1.6 0.62
Na2CO 3 CA
T
A
Figure 1. Three-dimensional plot of the optimized
response surface showing the absorbance as a
In figure 2, the Pareto graph shows the effects of each variable corresponding to a 95% confidence-level response. The importance of each variable de-pends on its sign and value. Positive signs indicate that the absorbance signal is increased with an increase of the value of the respective variable within the range studied, while negative signs indicate that the absorbance signal is favored with a decrease of the
variable. If the effect is smaller than 5% (i.e. the
resulting graph does not go over the vertical line), the variation of the response caused by changing the varia-ble is smaller than the experimental error. Therefore, the variable is considered not to be significant [36,37].
Since the temperature and time variables have significant negative effects, the absorbance signal will be favored with a decrease in the value those
variables. CAT and Na CO volumes were not 2 3
considered to be significant and fixed in 2.5 mL of
CAT and 0.7 mL of Na CO . 2 3
Afterwards, the above-mentioned variables (temperature and time) were optimized by the response surface methodology. These variables were studied at five levels, including four central points for statistical validity within the range of –1.41 to +1.41, which corresponds to temperature in the range of 40 to 80 ºC and time in the range of 2 to 10 minutes.
The figure 5 depicts the response surface with contours of constant Z plotted against the time and temperature. It clearly shows that the system
produces a stationary point that has the maximum estimated response. By analyzing the fitted surface, it is possible to identify that the points referring to the best conditions for the maximum response were temperature of 67.5ºC and a time equal to 4.8 minutes. The quadratic regression model is give by:
2
Z = -2.47065 + 0.09096x -0.00058x + 0.20983y
-2
0.00425y -0.00250xy,
where Z represents the response factor corresponding
to the absorbance value. The factors x and y are the
temperature and the time, respectively. The
respon-2
ses of the model, the R values, were greater than 0.91, implying that the data fitted the model well in relation to the absorbance response.
Analytical data
The developed analytical method was validated by evaluating the following parameters: [27,28] linear dynamic range, precision, accurate, ruggedness, limit of detection (LOD) and limit of quantification (LOQ), as well as by applying the standard addition technique.
Under optimized experimental conditions, the analytical curves were constructed and they
Figure 2. Pareto chart for visualizing the effects of
the chemical variables on the absorbance
measure-(4-1)
ments using 2 factorial design for optimization of
doxycycline. Figure 3. Three-dimensional plot of the optimized
showed excellent linearity within the range of concentrations used. The linear data were adjusted by equation A = a + b [C], where, A is the absorbance, a is the intercept, b is the slope and [C] is the drugs
-1
concentration in mol L . The limit of detection (LOD) and limit of quantification (LOQ) were calculated according to Skoog et.al [28], using the
following expressions: LOD = 3ó/b and LOQ =
10ó/b, where ó is the standard deviation of twenty
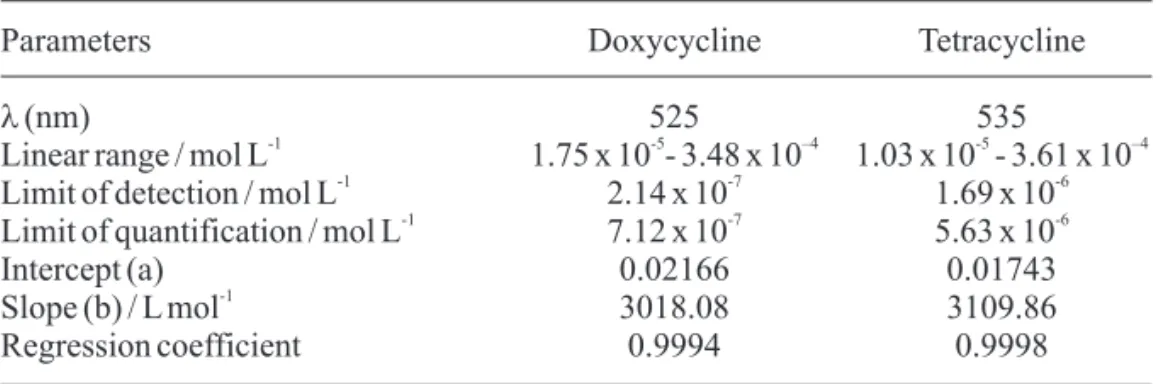
measures of the blank and b is the slope of the analytical curves. Table 2 contains the figures of merit for the proposed method.
The precision and accuracy were evaluated by comparing the results obtained from the analysis of pharmaceutical formulations by the proposed method with those obtained using the official HPLC methods [24]. The results are summarized in the Table 3.
The susceptibility of the developed analytical method to changes was tested to evaluate the
ruggedness of the method. For this purpose, the two experimental designs were employed where the variables were tested.
The matrix interference can introduce systematic errors on the analytical determination. In order to investigate the presence of matrix effects on the proposed method, a recovery study was realized.
-4 -4 -4
-In this study, 1.04x10 , 2.08x10 , 3.15x10 , 4.20x10
4 -1
mol L of tetracycline reference solutions were added separately to each sample of tetracycline, and
-5 -4 -4 -4 -1
8.68x10 , 1.74x10 , 2.61x10 , 3.47x10 mol L of doxycycline reference solutions were added separately to each sample of doxycycline. The recoveries obtained by the standard-addition method ranged from 96.7 to 102.3% indicating the absence of any significant matrix effects on the proposed method.
The effects of the common excipients present in commercial pharmaceutical formulations such as: microcrystalline cellulose,
hydroxypropylmethylcel-Table 2. Results of figures of merit for the proposed method.
Parameters Doxycycline Tetracycline
l (nm) 525 535
-1 -5 –4 -5 –4
Linear range / mol L 1.75 x 10 - 3.48 x 10 1.03 x 10 - 3.61 x 10
-1 -7 -6
Limit of detection / mol L 2.14 x 10 1.69 x 10
-1 -7 -6
Limit of quantification / mol L 7.12 x 10 5.63 x 10
Intercept (a) 0.02166 0.01743
-1
Slope (b) / L mol 3018.08 3109.86
Regression coefficient 0.9994 0.9998
Table 3. Determination of TC and DXC in pharmaceutical formulations.
Sample Label to Proposed Method Official
24
content Methods
b c c b
Found tvalue (2,78) Fvalue (19,00) Found
Tetracycline
A 500 500.4 ± 0.4 1.57 3.06 501.1 ± 0.7
B 500 504.7 ± 0.5 2.16 1.44 505.7 ± 0.6
Doxycycline
A 100 103.3 ± 1.0 1.70 6.25 102.2 ± 0.4
B 100 105.7 ± 0.5 2.47 1.33 104.7 ± 0.5
lulose, lactose, titanium dioxide, starch, talc, sodium lauryl-sulphate, sodic croscarmelose and magnesium stearate were carefully evaluated. It was exhibited that the presence of the above-mentioned excipients up to 1 or 10-times of the weight ratio to tetracycline or doxycycline showed no interference effects for determination of these drugs.
The effects were considered to be interference when the signal showed an error of more than 5% in determination of the drug.
Application
The proposed method was applied to determinations of TC and DXC in pharmaceutical formulations. The results of the comparison with the official methods [24] are shown in Table 3. For all formulations assayed, the results obtained by the official methods and proposed method were
compared by applying the Students t-test and
variance-ratio F-test at the 95% confidence level
[26]. In all cases, the calculated t and F values did not
exceed the theoretical values, indicating that there is no significant difference between our method and the official method regarding accuracy and precision in determining these antibiotics in pharmaceuticals.
Conclusions
Statistical comparison for the results of the proposed method with the USP indicates that there is no significant difference in regard to accuracy and precision. The good features of the proposed method showed that it's an alternative suitable for the routine analysis of tetracycline and doxycycline in pharma-ceutical formulations.
Acknowledgements
The authors would like to thank FAPESP, CNPQ and CAPES Foundations (Brazil) for the financial support.
Resumo: Um método espectrofotométrico simples, rápido, exato e barato foi desenvolvido para a
determinação de tetraciclina e doxiciclina. O método é baseado na reação entre estas drogas e cloramina-T em meio alcalino produzindo produtos de cor vermelha com absorbância máxima em 535 e 525 nm para a tetraciclina e doxiciclina, respectivamente. As melhores condições para as reações foram encontradas
-5
utilizando métodos multivariados. A lei de Beer é obedecida no intervalo de concentração de 1,03 x 10 a 3,61 x
-4 -1 -5 –4 -1
10 mol L e 1,75 x 10 a 3,48 x 10 mol L para a tetraciclina e doxiciclina, respectivamente. Os limites de
-6 -1 -7 -1
quantificação foram 5,63 x 10 mol L e 7,12 x 10 mol L para a tetraciclina e doxiciclina, respectivamente. O método proposto foi aplicado com êxito na determinação destas drogas em formulações farmacêuticas e os resultados obtidos estão de acordo com os obtido pelo método comparativo em 95% de confiança.
Palavras-chave: tetraciclina, doxiciclina, cloramina-T, espectrofotometria.
References
[1] A. Korolkovas, J. H. Burckhalter, Química Farmacêutica, Editora Guanabara Koogan S.A., Rio de
Janeiro, 1ª ed., 1988, 595.
[2] Y. Cai, Y. Cai, Y. Shi, S. M.Y. Lu, J. Chromatogr. A 1118
(2006) 35.
[3] M.C.V. Mamani, J.A. Farfán, F.G.R. Reyes, S. Rath,
Talanta 70 (2006) 236.
[4] U.SAHA, A.K. Sen, T.K. Das, S.K. Bhowal, Talanta
37(12) (1990) 1193.
[5] F.A. Moreno, M.E.D. García, A.S. Medel, Anal. Chim. Acta 281 (1993) 637.
[6] Y.Wen, Y.Wang, Y.Q. Feng, Talanta 70 (2006) 153. [7] K.M. Emara, H.F. Askal, G.A. Saleh, Talanta 38(11) (1991) 1219.
[8] M.M.A. Khalec, M.S. Mahrous, Talanta 30(10) (1983) 792.
[9] S.M. Sultan, Analyst 111 (1986) 97.
[10] M.S Mahrous, M.M.A. Khalec, Talanta 31(4) (1984) 289.
[11] S. Palaharn, T. Charoenraks, N. Wangfuengkanagul, K. Grudpan, O. Chailapakul, Anal. Chim. Acta 499 (2003) 191.
[13] X. Zheng, Y. Mei, Z. Zhang, Anal. Chim. Acta 440
(2001) 143.
[14] A. Townshend, W. Ruengsitagoon, C. Thongpoon, S. Liawruangrath, Anal. Chim. Acta 541 (2005) 105.
[15] F. Salinas, A.M. De La Pena, I.D. Meras, Anal. Lett. 23
(1990) 863.
[16] W.B. Chang, Y.B. Zhao, Y.X. Li, L.Y. Hu, Analyst 117 (1992) 1377.
[17] D. Šatínský, L.M.L. Dos Santos, H. Sklenáøová, P. Solich, M.C.B.S.M. Montenegro, A.N. Araújo, Talanta 68
(2005) 214.
[18] A. Pena, A. Carmona, A. Barbosa, C. Lino, I. Silveira, B. Castillo, J. Pharm. Biomed Anal. 18(4-5) (1998) 839.
[19] K. Iwaki, N. Okumura, M. Yamazaki, J. Chromatogr.
623(1) (1992) 153.
[20] K. Tsuji, J.H. Robertson, J. Pharm. Sci. 65(3) (1976)
400.
[21] R.W. Fedeniuk, S. Ramamurthi, A.R. Mccurdy, J. Chromatogr. B. Biomed. Appl. 677(2) (1996) 291.
[22] T. Hasan, B.S. Cooperman, J. Chromatogr. 321 (1985)
462.
[23] E. Ragazzi, G. Veronese, J. Chromatogr. 134 (1977)
223.
[24] United States Pharmacopeia, 26ª Ed. Rockvillle, 2003.
[25] Britsh Pharmacopoeia, HM Stationery Office, London, 1988.
[26] B.B. Neto, I.S. Scarminio, R.E. Bruns, Como fazer experimentos: pesquisa e desenvolvimento na ciência e na indústria, Editora Unicamp, Campinas, 2nd ed., 2002.
[27] International Conference on Harmonization ICH-Q2A, Guideline for Industry: Text on Validation of Analytical procedures, 1995.
[28] D.A. SKOOG, Princípios de Análise Instrumental,
Editora Bookman, Porto Alegre, 5 ed. 2002, 25.
[29] K.K. Verma, A.K. Gulati, Anal. Chem. 52 (1980)
2336.
[30] F. Lazaro, A. Rios, M.D.L. Castro, M. Valcarcel,
Analysty 111 (1986) 163.
[31] F. Lazaro, A. Rios, M. D. L. Castro, M. Valcarcel,
Analysty 111 (1986) 167.
[32] N.M.M. Gowda, K.S. Rangappa, D.S. Mahadevappa,
Analyst 111 (1986) 1423.
[33] Ramalingaiah, R.V. Jagadeesh, Puttaswamy,
Catalysis A: Chemical, 265 (2006) 70.
[34] M.A. Gotardo, A.C. Gigante, L. Pezza, H.R. Pezza,
Talanta 64 (2004) 361.
[35] A.C. Gigante, M.A. Gotardo, J.O. Tognolli, L. Pezza, H. R. Pezza. Microchem. J. 77 (2004) 47.
[36] E.C. Gil, A. Van Schepdael, E. Roets, J. Hoogmartens,
J. Chromatography A 895 (2000) 43.
[37] R.F.P. Nogueira, M.C. Oliveira, W.C. Paterlini,