Printed in Brazil - ©2006 Sociedade Brasileira de Química 0103 - 5053 $6.00+0.00
A
rti
c
le
*e-mail: [email protected]
Macroscopic Interface Self-Motion of an Oil/Water Liquid Membrane
Jinzhang Gao,* Fuwei Yang, Kanjun Sun, Lei Wang, Wu Yang, Jie Ren and Hongxia Dai
Chemistry and Chemical Engineering College, Northwest Normal University, Lanzhou 730070, P. R. China
Este estudo descreve o movimento oscilatório de uma interface água/óleo em um sistema em que a fase óleo era composta por uma mistura de nitrobenzeno, ácido pícrico e etanol, enquanto a fase aquosa era composta por uma solução de CTAB (brometo de cetiltrimetilamônio). A interface apresentava diferentes tipos de movimentos como aleatório, ondulatório e tipo gangorra, que eram afetados por condições experimentais como a concentração dos reagentes e a geometria do vaso de reação. Um mecanismo é proposto para explicar estes movimentos oscilatórios.
A macroscopic interface self-motion appearing on an oil/water liquid membrane was clearly observed. The oil phase was a mixture solution containing nitrobenzene, picric acid and ethanol, whereas the aqueous phase was a solution of CTAB (cetyltrimethylammonium bromide). The interface displayed different types of motion, such as random, wave-like motion and teeterboard-like motions, which were affected by experimental conditions teeterboard-like concentration of reactants and geometry of the reaction vessel. A possible mechanism to explain these motions was also proposed.
Keywords: self-motion, liquid membrane, interfacial tension, surfactant, oil/water interface
Introduction
The nonlinear behavior of artificial membranes has become a topic of great interest because it displays similarity to properties of the biological membrane oscillations.1 As one of artificial membranes, the liquid membrane was widely studied and even could be used to understand chemical sensors in the future.2-6 In the system of oil/water liquid membrane, the investigations of the relationship between the potential oscillation and
the interfacial tension change is quite important,7-14
because of the new information that it could produce. Unfortunately, relatively few papers are devoted to the
study of mechanism analysis,15-19 although the
self-motion is very common in biological system, for example, heart beat. It is difficult to obtain a long period of self-motion with good reproducibility due to Marangoni effects20 or the non-uniformity of the solute concentration in the oil/water phases, which could cause conversion of energy. In a sense, it is easy to think that the change of interfacial tension may play an important part in explaining the self-motion of liquid membrane.
In the present paper, we report a self-motion investigation on an oil/water system with good reproducibility. Three motion patterns (e.g. random motion, interface wave-like motion and interface teeterboard-like motion) were observed clearly. Some of the effect factors on these systems were discussed in detail and a qualitative mechanism was also given in brief.
Experimental
Reagents and apparatus
All reagents were of analytical grade and used as received. Picric acid was dried under vacuum prior to use. Nitrobenzene was used without further purification. A solution containing 10 mmol L-1 cetyltrimethylammonium bromide (CTAB) was used as aqueous phase. The organic phase consists of nitrobenzene, ethanol and picric acid.
stopwatch was adopted to record the time of self-motion. A Sony DSC-F717 digital camera was employed to obtain pictures of self-motion on the oil/water interface.
Procedure
The experiment was performed in the following sequence: first 5 mL of mixture solution containing nitrobenzene, picric acid and ethanol was added into the bottom of reaction vessel, then 5 mL of CTAB solution was added gently. It was noted that the addition of aqueous solution must be slow and careful, otherwise, no motion phenomenon could be observed.
Results and Discussion
Phenomena
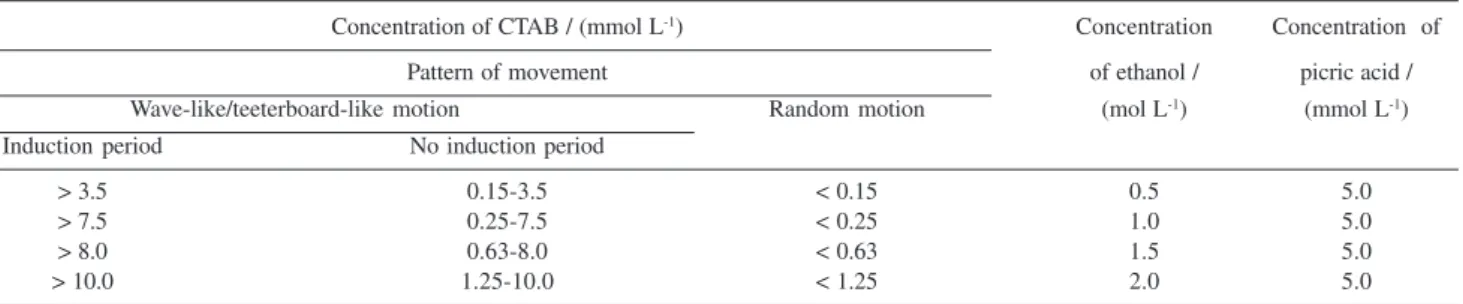
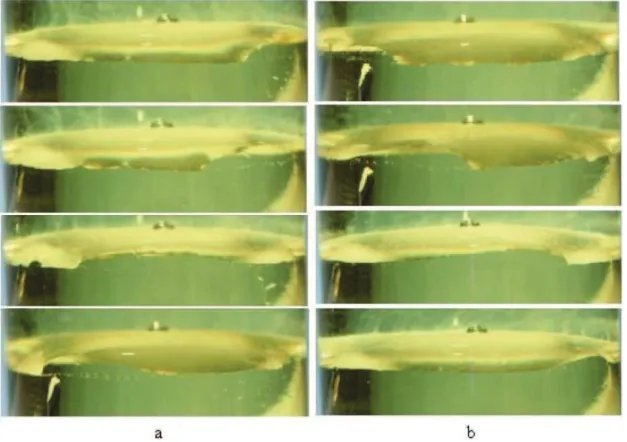
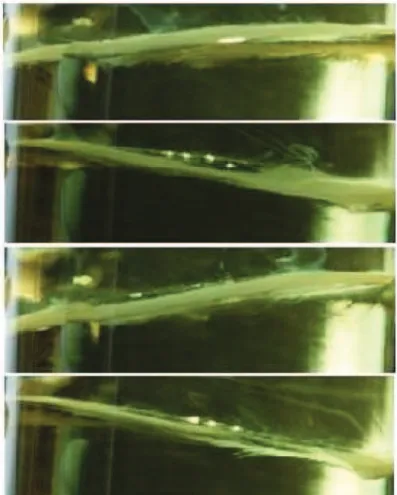
The detailed component ratio is listed in Table 1. With the change of component ratio, three kinds of interface self-motions could be observed, that is, the interface random motion (unfortunately, the change of this pattern was so fast that no picture could be taken), the interface wave-like motion (see Figure 1) and interface teeterboard-like motion (Figure 2).
As shown in Table 1, both wave-like motion and interface teeterboard-like motion could occur only under a special range of CTAB concentration, as the other
components (i.e., ethanol and picric acid) remain
constant. Below or above these critical values the regular motions are destroyed, either appearing as random motion or associated with a very long induction period. At the minimum critical value, a yellow precipitate film formed on the oil/water interface and became thicker and thicker with prolonging reaction until the random motion stopped. At the maximum critical value, if the organic phase was contacted with the aqueous phase, the interface motion would occur immediately. However, the motion seemed to be irregular at the beginning. The wave-like motion formation of interface (see Figure 1) was roughly similar to the one reported by Yamaguchi
et al.,16 that is, a part of interface along the test tube edge heaved toward the aqueous phase and formed a protuberance; the protuberance traveled horizontally along the wall of the test tube and formed a wave. The wave-like motion was running clockwise for a while, and then back to the anticlockwise direction. This rotation continued reversibly for a long time.
Table 1. Relationship between reactant concentration and pattern of self-motion
Concentration of CTAB / (mmol L-1) Concentration Concentration of
Pattern of movement of ethanol / picric acid /
Wave-like/teeterboard-like motion Random motion (mol L-1) (mmol L-1)
Induction period No induction period
> 3.5 0.15-3.5 < 0.15 0.5 5.0
> 7.5 0.25-7.5 < 0.25 1.0 5.0
> 8.0 0.63-8.0 < 0.63 1.5 5.0
> 10.0 1.25-10.0 < 1.25 2.0 5.0
Figure 1. Transmitting process of interface wave: a) clockwise; b) anticlockwise. Conditions: aqueous phase (5 mmol L-1 CTAB); organic phase (5 mmol L-1 picric acid and 1.0 mol L-1 ethanol in nitrobenzene); the interval between flames (1/8 s).
Such a motion was determined firstly by the initial conditions. However, the motion direction did not always interchange, it was sometimes kept only in one way. As time passed, the angular velocity of rotation became slower and slower, and the motion may cease for a while, and then restart again. In general, the longer the duration of self-motion, the longer this stopped time would be. Finally, the motion stopped completely.
The interface teeterboard-like motion (see Figure 2) had a pattern different from the wave-like motion. When the interface teeterboard-like motion occurred, just like the movement of teeterboard, the interface teetered vertically along the wall of the test tube. Such as in the case of the wave-like motion, there was also a stopped time, which occurred at intervals of two motions. For systems where the motion ceased, the addition of CTAB or picric acid could also lead the interface self-motion to restart again. These results indicate that there was an accumulation process for reactants and only when the reactants reached a critical value the interface motion could occur. So it could be thought that the diffusion process of CTAB and picric acid maybe control the reaction at interface. Accom-panying with the interface motion, either wave-like or teeterboard-like motions, there was a precipitation produced at the oil/water interface. An analysis of
precipitated substance proved that it consists of CTA+
and picric acid anion with a little of aqueous solution. At that time, the aqueous solution became gradually clear yellow, suggesting that the picric acid was diffused from organic phase into aqueous solution. In fact, during the self-motion process of oil/water interface both diffusing process and chemical reaction occur at the
same time.21,22 Owing to a thin film precipitated
covering the interface, the interface motion was clearly observed. Generally, if the concentration of CTAB is above the suitable range (see Table 1), there would be no interface motion observed at the beginning. Just after an induction period, the interface wave-like motion or interface teeterboard-like motion can be observed macroscopically. Furthermore, because the interface heaved towards the aqueous phase, an interfacial motion occurred; conversely, if the interface concaved towards the aqueous phase, there was no self-motion at all. After an induction period the motion of the interface heaving towards the aqueous phase would appear again.
The effect of concentration of reactants on interface self-motion was considered and two variables were monitored. One was the angular velocity of regular interface motion; the other was the duration time of continuous regular interface motion. The effect of reactant
concentrations, on both wave-like and teeterboard-like motion, was the same. For this reason, most of the discussion was focused on the wave-like motion.
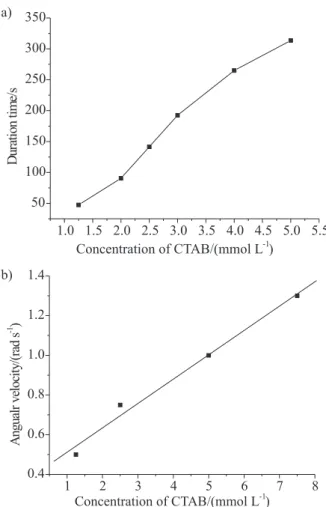
The effect of CTAB
It was noticed that if the concentrations of ethanol and picric acid were kept constant, and the concentration of CTAB was also limited to a specific range, either interface wave-like motion or interface teeterboard-like motion were observed. At a constant concentration of picric acid, the relationship between the concentration of CTAB and the duration time (or persisting time) of interface motion was roughly that, the greater the amount of CTAB, the longer the duration time (see Figure 3a). However, if the concentration of CTAB was not enough, there was a pale yellow precipitated substance produced immediately at the interface and at that time only random interfacial motion was observed. If the concentration was above this value, the interface would heave towards the organic phase and no interface motion can be observed until the interface re-heaves gradually towards the aqueous phase. In this case, a long introduction period was observed. Also, the higher the concentration of CTAB, the longer the induction period. During the induction period, the aqueous phase was clear and colorless, implying that no picric acid entered into the aqueous phase. When CTAB was added into a ceased self-motion system, the motion would be restarted again. Figure 3b indicates that the relationship between the angular velocity of wave-like motion and the concentration of CTAB seems to be a positive response, the greater the amount of CTAB, the faster the angular velocity would be. Nakache et al.15 had also reported a similar relationship between interfacial tension and concentration of surfactant.
The effect of picric acid
In order to obtain a longer duration time as well as a greater angular velocity, the selected amount of picric acid is shown in Figure 4. In Figure 4a, the duration time had a maximal value and it is easily understood that at that certain concentration of CTAB and ethanol, if picric acid is not enough, it would be consumed quickly and make the reaction cease. Otherwise, an excess of picric acid would lead to CTAB to be consumed quickly and to cease the self-motion of interface. Figure 4b shows that at the certain concentration range, the more picric acid, the quicker the rotation frequency.
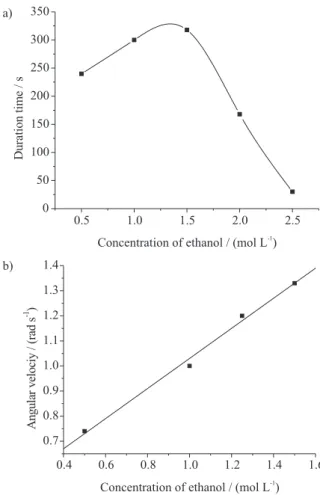
The effect of ethanol
Ethanol is a key component in this system. The macroscopic self-motion of interface was scarcely observed in the absence of ethanol. Generally, if ethanol was absent, the aqueous phase maintained clearly and colorless all the time and no self-motion phenomenon
occurred. However, in the presence of ethanol, the interface self-motion was observed and the aqueous phase quickly became pale yellow. The results indicated that the presence of ethanol accelerated the diffusion of picric acid into the aqueous phase. With the increasing amount of ethanol in the organic phase, the angular velocity of wave-like motion increased (see Figure 5b). However, the duration time of motion prolonged at the beginning and reached a maximum value, then decreased again (see Figure 5a). At low concentration of ethanol, due to the accumulation of precipitated substance on the interface, the self-motion would cease quickly. At high ethanol concentration, however, there was no precipitated substance accumulated on the interface because this substance moved into the aqueous phase quickly. Therefore, it can be considered that ethanol has two functions in this system: one is accelerating the diffusion of picric acid from organic into aqueous solution; the other is to remove the precipitated substance from the interface.
Figure 3. a) Relationship between duration time and concentration of CTAB; b) Relationship between angular velocity and concentration of CTAB. Conditions: aqueous phase (5 mmol L-1 CTAB); the organic phase (1.0 mol L-1 ethanol in nitrobenzene); temperature 18±0.2 oC.
The effect of reaction vessel geometry
The reaction vessel had some effect on the motion pattern of interface. Generally speaking, the reaction vessel used had no obvious effect on random interface motion, but it was able to affect wave-like and interface teeterboard-like-like motion strongly. At the same concentration of reactants, there were several different motion patterns: interface wave-like motion; interface teeterboard-like-like motion or both (see Figure 1 and Figure 2). This may be due to a slight surface difference of reaction vessel walls. The vessel surface area can affect the duration time of interface self-motion. Roughly, the larger the vessel area, the shorter the duration time. In addition, the vessel wall was able to affect the motion pattern, for example, a rough wall can cause an asymmetric interface motion.
Mechanism for self-motion
Studies on several systems exhibiting self-interface motion have been reported15-19concerning an immiscible
oil/water system. Commonly, the aqueous phase was a solution of surfactant and the oil phase contained an organic acid or complex ion. Owing to the change of interface tension there was a self-motion of the oil/water interface. This change of interface tension derived from the coupling of chemical reaction process and diffusion process. Diffusion of reactants was quite important, since it made the reactants move to the interface reaction and the rate of diffusion must be suitable, in other words, the diffusion process of reactants must match well with that of interface reaction. In the previous studies, all the systems exhibiting macroscopic self-motion were limited to a certain reactant
concentration range. For example, Yoshikawa et al.12
reported a membrane system exhibiting a regular potential oscillation, but no self-motion of interface was found. There was only one difference from our experimental setup: one study added ethanol to the
aqueous phase,whereas the other added ethanol to the
organic phase.As pointed previously, ethanol can
accelerate the diffusion of picric acid from oil phase to aqueous phase. If there is no ethanol in the organic phase, the diffusing rate of picric acid is not high enough to match the reaction between the surfactant and picric acid, hence, the change of interface tension is not appropriate to lead to macroscopic self-motion. Since the self-motion of oil/water interface was caused by the change of interfacial tension involving both diffusion and interface chemical reaction processes, it may be suitable to explain the self-motion from the view of diffusion and chemical reaction along with the change of interfacial tension. The relationship between the interfacial tension and surfactant concentration can be described by Szyszkowski equation:23
γ0-γ/γ0=bln(c/a+1) (1)
where, γ and γ0 are the interfacial tension in the presence and absence of surfactant respectively; c is the concentration of surfactant, and a and b are constants related to the surfactant. Then, the relationship between the interfacial tension and the concentration of surfactant can be expressed as below:
γ=γ0-bγ0ln(c/a+1) (2)
Assuming that γsw stands for the interfacial tension between the edge of reaction vessel and aqueous phase, γso is the interfacial tension between the edge of reaction vessel and organic phase, and γow refers to the interfacial tension between organic phase and aqueous phase, the
interfacial tension should conform to equation 3:
γow=γ0-bγ0ln(c/a+1) (3)
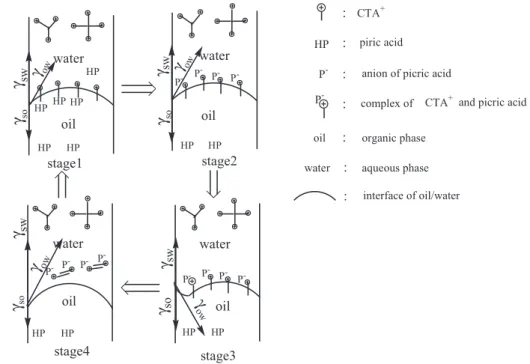
Because γsw and γso can be considered as constants in the relatively short time, this mechanism may be simplified through the change of the interfacial tension (γow) between organic phase and aqueous phase. With the help of the conclusions of previous studies (see references 15-19), the mechanism of the interface motion can be described as below.
Stage 1. The CTA+ ion dissolved in water diffuses at first to the oil-water interface and forms a
monomolecular layer. Because γsw and γso have been
considered as constants in the relatively short time,
according to equation 1, γow decreases gradually with
increasing the amount of surfactant in the oil/water interface. Simultaneously, picric acid dissolved in oil moves to the interface of oil/water with the aid of ethanol.
Stage 2. When picric acid reacts with CTA+ ionin the interface of oil-water, a precipitation occurs,
CAT+
(aq)+HP (aq) = CATP (s) +H +
(aq)
Stage 3. Due to the precipitation of CTAP, the interfacial tension increases greatly. The result is that a part of particles move upward and, the adjacent part of particles are also attracted upward together, then, up and down by
turns, just like ocean waves advancing. Thus a
macroscopic interface self-motion is observedclearly.
Owing to the deformation of the organic phase, because the direction of γow points to organic phase, the particles are restored to their previous site and kept motionless until the next wave occurs.
Stage 4. In the presence of ethanol, the precipitated CATP is removed from the interface and diffuses into the aqueous phase. At this time, the interface could be
renewed. The adsorption of CTA+ takes place again and
the interface tension decreases, thus, the process of stage 1 is restarted.
As described above, as time passes, the concentrations both of CTAB in the aqueous phase and picric acid in the oil phase were decrease, and the self-motion of the interface exhibits gradual decay due to the dissipation of free energy. When the concentrations of CTAB in the aqueous phase and picric acid in the oil phase are below the minimum critical value, the driving force of the interface is enough to produce the self-motion, and the motion completely ceases.
The surfactant adsorption rate can be expressed as follows:
dn/dt=(D/π)1/2ct-1/2(N
0/1000) (4)
Where n is the number of absorbed molecules per square centimeter interface at the time t, D is diffusion coefficient of surfactant in bulk phase, and N0 is Avogadro’s constant.
The integral result of the above equation is:
n=2(D/π)1/2ct1/2(N
0/1000) (5)
where n0 refers to the critical number of absorbed molecule per square centimeter of interface at time t0, then,
n0=2(D/π)1/2ct 0
1/2(N
0/1000) (6)
and
t0=4(D/π/)2c2(N 0/1000)
2/ n 0
2 (7)
This process can also be pictured from a static point of view. As shown in Figure 1, at the beginning, concentrations of both CTAB and picric acid are high enough so that the concentration difference is not important. At that time (t0), surfactant concentration changes little and can be considered as constant. As time passes, CTAB concentration decreases significantly, the diffusion rate of reactants diminishes and the surfactant can not reach the critical concentration (n0) as it did before, as does picric acid, resulting in a halt of the self-motion. With further decrease of concentration of CTAB and picric acid, the interface self-motion would cease at all.
Conclusions
A new self-motion of oil/water interface, in which the oil phase is a mixture containing nitrobenzene, picric acid and ethanol and the aqueous phase is a solution of CTAB, has been described qualitatively. Macroscopic interface self-motion patterns, such as random motion, wave-like motion and teeterboard-like motion, have been clearly observed. A possible reason for this motion is that the CTAB in water phase diffuses at first to the interface of oil-water and forms a monomolecular layer, then, reacting with picric acid to form a precipitate. Therefore, the interfacial tension will change markedly causing the interface self-motion. In fact, during the self-motion process of oil/water interface both a diffusing process and a chemical reaction co-exist.
Acknowledgments
This work was supported in part by the Project of International Cooperation between China and Ukraine (043-05), the National Natural Science Foundation (20475044) and the Invention Project of Science & Technology (KJCXGC-01, NWNU), China.
Supplementary Information
Colored versions of Figures 1 and 2, as well as a short movie showing the interface motions are available at http://jbcs.sbq.org.br free of charge.
References
1. Larter, R.; Chem. Rev.1990, 90, 355.
2. Yoshikawa, K.; Matsubara,Y.; Langmuir 1985, 1, 232. 3. Yoshikawa, K.; Shoji, M.; Nakata, S.; Maeda, S.; Langmuir
1988, 4, 759.
4. Arai, K.; Kudu, F.; Tamaqua, K.; Anal. Chim. Acta1998, 365, 279.
5. Shaw, P.; Coddington, Jan M.; Biophys. Chem. 1995, 55, 209.
6. Wu, K.; Iedema, M. J.; Schenter, G. K.; Cowin, J. P.; J. Phys.
Chem. B, 2001, 105, 2483.
7. Yoshikawa, K.; Makino, M.; Chem. Phys. Lett.1998, 160, 623. 8. Takahashi, T.; Yui, H.; Sawada, T.; J. Phys. Chem. B 2002, 106,
2314.
9. Yoshikawa, K.; Matsubara, Y.; J. Am. Chem. Soc. 1983, 105, 5967.
10. Haidara, H.; Vonna, L.; Schultz, J.; Langmuir 1996, 12, 2478. 11. Li, H. X.; Wang, M. H.; Chem. Phys. Lett. 2000, 330, 503. 12. Yoshikawa, K.; Matsubara, Y.; J. Am. Chem. Soc.1984, 106,
4423.
13. Szpakowska, M.; Czaplicka, I.; Plocharska-Jankowska, E.; Nagy, O.B.; J. Colloid Interface Sci.2003, 261, 451. 14. Maeda, K.; Nagami, S.; Yoshida, Y.; Ohde, H.; Kihara, S.; J.
Electroanal. Chem. 2001, 496, 124.
15. Nakache, E.; Dupeyrat, M.; Vignes-Alder, M.; J. Colloid
Interface Sci.1983, 94, 187.
16. Yamaguchi, T.; Shinbo, T.; Chem. Lett.1989, 935.
17. Yoshikawa, K.; Magome, N.; Bull. Chem. Soc. Jpn.1993, 66, 3352.
18. Nakache, E.; Dupeyrat M.; Faraday Discuss. Chem. Soc.1984,
77, 189.
19. Nobuyuki, M.; Yoshikawa, K.; J. Phys. Chem.1996, 100, 19102. 20. Scriven, L. E.; Sternling, L.; Nature1960, 187, 186. 21. Pimienta, V.; Lavabre, D.; Buhse, T.; Micheau, J. C.; J. Phys.
Chem., B 2004, 108, 7331.
22. Goloub T.; Pugh, R. J.; J. Colloid Interface Sci.2003, 257, 337.
23. Gu, T. R.; Zhu, B. Y.; Surfactants (in Chinese), Science Press: Beijing, 2001, p.50.
Printed in Brazil - ©2006 Sociedade Brasileira de Química 0103 - 5053 $6.00+0.00
S
u
p
p
le
m
e
nta
ry
Inf
o
rm
a
ti
o
n
*e-mail: [email protected]
Macroscopic Interface Self-Motion of an Oil/Water Liquid Membrane
Jinzhang Gao,* Fuwei Yang, Kanjun Sun, Lei Wang, Wu Yang, Jie Ren and Hongxia Dai
Chemistry and Chemical Engineering College, Northwest Normal University, Lanzhou 730070, P. R. China
Gaoet al. J. Braz. Chem. Soc.