Article
Printed in Brazil - ©2014 Sociedade Brasileira de Química0103 - 5053 $6.00+0.00
A
*e-mail: [email protected]
Analysis of Carotenoids,
α
-Tocopherol, Sterols and Phenolic Compounds
from White Bread Enriched with Chia (
Salvia hispanica L.
) Seeds and Carrot
(
Daucus carota L.
) Leaves
Swami A. Maruyama,a Thiago Claus,a Lucas U. R. Chiavelli,a Janksyn Bertozzi,a Eduardo J. Pilau,a Nilson E. de Souza,b Jesuí V. Visentainer,a Sandra T. M. Gomesa and
Makoto Matsushita*,a
aDepartment of Chemistry, State University of Maringa, Av. Colombo, 5790, 87020-900 Maringá-PR, Brazil
bFood Technology Department, Federal University of Technology - Parana State, Dos Pioneiros Street, 3131, 86036-370 Londrina-PR, Brazil
Cada matriz alimentar é única. Os antioxidantes endógenos de um produto de panificação não estudados podem mostrar diferentes respostas para atividade antioxidante total (TAA)/resistência a oxidação forçada (ROF) do que é esperado para outros alimentos reportados na literatura. Neste contexto, um design Box-Behnken e estudos de correlação foram aplicados para obter mais informações sobre como compostos antioxidantes específicos afetam o TAA/ROF em pães com sementes de chia e folhas de cenoura. Hipóteses de sinergismo/antagonismo entre os compostos estudados foram elucidadas para tentar justificar os resultados obtidos. Neste tipo específico de amostra, carotenóides e colesterol tiveram as maiores relações com resultados de ensaios de TAA, bem como com pontos de indução provenientes do equipamento Oxitest®, enquanto que
α-tocoferol e fitosteróis mostraram correlações negativas. Compostos fenólicos não tiveram nenhuma influência no sistema porque o cozimento em alta temperatura das amostras destruiu grande parte desses analitos.
Each food matrix is unique. Thus, the endogenous antioxidants of an underexplored bakery product might show different responses regarding free radical scavenging/resistance to forced oxidation than what is expected for other foods previously reported in the literature. In this context, a Box-Behnken design and correlation studies were applied in order to obtain more information about how specific antioxidants affect the total antioxidant activity (TAC) and the degree of forced oxidation in white breads with chia seeds and carrot leaves. Hypotheses of synergism/antagonism between the studied compounds were also elucidated in order to justify the obtained results. In this specific sample type, carotenoids and cholesterol showed the greatest relationships with results from TAC assays, as well with induction points using Oxitest® equipment, while α-tocopherol
and phytosterols showed negative correlations. Phenolic compounds did not have any influence on the system because the baking procedure at high temperature had severe impacts on them.
Keywords: bread, Box-Behnken design, carotenoids, sterols, polyphenols, tocopherols
Introduction
In our previous article,1 we described the importance
of bread as an ideal matrix to add chemical compounds to prevent nutrition-related diseases, as it is a food of good acceptance, and we explored the use of an alternative experimental design (Box-Behnken design-BBD) to
investigate how much the baking time and addition of chia seeds and carrot leaves changed the fatty acid content and total antioxidant capacity of bread, while doing a smaller number of experiments than what would be required to apply a central composite or three-level full factorial design with the same number of variables.
occur simultaneously during bread baking. This problem demanded deeper study regarding what types of antioxidant compounds exist in this particular food matrix and how much their amounts change during bread baking.
It is widely known from many research areas that phenolic compounds, carotenoids and tocopherols are the main contributors to the antioxidant potentials that are observed in many food samples.2,3 To a lesser degree, sterols have also
been reported as compounds with antioxidant activity.4 It is
also relevant to remind that chemical reactions which occur between atmospheric oxygen and all these substances (along with other compounds from bread) are relevant causes of degradation/off-flavor generation in bakery products, and it is unclear whether the addition of antioxidants from chia seeds (Salvia hispanica L.) and carrot leaves (Daucus carota L.) will delay or catalyze such reactions.
Thus, carotenoids, tocopherols, sterols and phenolic compounds were chosen for analysis in this work. Tests with an Oxitest® apparatus were also executed in order to
evaluate the actual efficiency of the chia seeds and carrot leaves in bread against forced sample oxidation. It is also important to mention that these experiments were not applied all at the same time in many studies about bread and antioxidant compounds from different sources, such as turmeric powder, green tea and blackcurrant.5-7
Experimental
Bread production
The same breads that were produced by baking at 180 °C in our previous article1 were used once again in
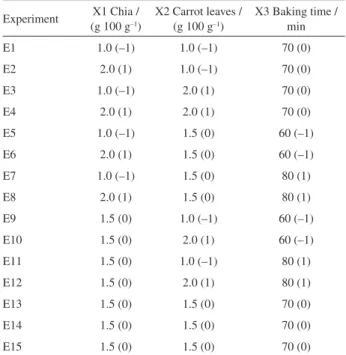
this work. The same BBD, generated by Design-Expert 7.1 software (Stat-Ease Inc., USA) and composed of fifteen experiments from our previous article, was once again employed to evaluate the real influence of carotenoids, tocopherols, sterols and phenolic compounds on the total antioxidant activity/forced oxidation resistance of bread enriched with chia seeds and carrot leaves. The parameters of the experiments can be observed in Table 1.
Carotenoids
The extraction and chromatographic analysis of carotenoids were executed according to procedures proposed and validated by Irakli et al..8
For extraction, approximately 0.1 g of lyophilized milled bread was placed in a 15 mL screw-capped test tube with 2 mL of absolute ethanol and 0.1 g of ascorbic acid as antioxidant. After vortex mixing for 1 min, the test tube was placed in an 80 °C water bath for 5 min. After removal
from the water bath, 100 µL of potassium hydroxide solution (80% w v–1, in water) was added. The sample was vortexed
for 20 s, then returned to the water bath for 15 min and mixed every 5 min during saponification. The test tube was allowed to cool at ambient temperature and centrifuged at 3000 rpm for 5 min. The supernatant was removed to a fresh test-tube and the residue was re-extracted with 2 mL of ethanol by sonication for 1 min. The test tube was centrifuged and the supernatant was combined with the above extract. This procedure was repeated one more time using 1 mL ethanol.
The combined extracts were applied to solid phase extraction (SPE) cartridges (Chromabond C18, 200 mg sorbent amount and 3 mL volume, from Macherey-Nagel) previously conditioned with 3 mL of methanol and 3 mL of water. Subsequently, the above extracts were applied after addition of 2 mL of water to decrease the percentage content of ethanol in the supernatants and allowed to pass through the bed without suction. After washing with 2 mL of water, the retained constituents were eluted with 2 mL of dichloromethane, followed by evaporation to dryness under a gentle flow of nitrogen at 30 °C. The residue was reconstituted with 200 mL of a methanolic solution of
α-tocopherol acetate [internal standard (IS), 50 mg mL–1]
and aliquots of 20 mL were injected into a high performance liquid chromatography (HPLC) column.
HPLC analyses were performed using a Thermo Finnigan Surveyor HPLC pump coupled with an absorbance detector at 405 nm. The chromatographic separation of the examined analytes was achieved by using
Table 1. Box-Behnken design layout with coded levels and actual values of variables
Experiment (g 100 gX1 Chia / –1)
X2 Carrot leaves / (g 100 g–1)
X3 Baking time / min
E1 1.0 (–1) 1.0 (–1) 70 (0)
E2 2.0 (1) 1.0 (–1) 70 (0)
E3 1.0 (–1) 2.0 (1) 70 (0)
E4 2.0 (1) 2.0 (1) 70 (0)
E5 1.0 (–1) 1.5 (0) 60 (–1)
E6 2.0 (1) 1.5 (0) 60 (–1)
E7 1.0 (–1) 1.5 (0) 80 (1)
E8 2.0 (1) 1.5 (0) 80 (1)
E9 1.5 (0) 1.0 (–1) 60 (–1)
E10 1.5 (0) 2.0 (1) 60 (–1)
E11 1.5 (0) 1.0 (–1) 80 (1)
E12 1.5 (0) 2.0 (1) 80 (1)
E13 1.5 (0) 1.5 (0) 70 (0)
E14 1.5 (0) 1.5 (0) 70 (0)
a 250 mm × 4.6 mm, 5 µm particle size, Nucleosil 100 C18 column (Macherey-Nagel, Duren, Germany) thermostated at 25 °C. The mobile phase of the HPLC system consisted of methanol, isopropanol and acetonitrile. A linear gradient was applied starting with 100% methanol, changing to 100% 40:50:10 methanol-isopropanol-acetonitrile, and the flow rate was increased from 1 to 1.2 mL min–1 for
the first 10 min and then to 100% 25:65:10 methanol-isopropanol-acetonitrile for 5 min with a constant flow rate of 1.2 mL min–1, which was kept isocratic for a further 1 min
before returning to initial conditions . The final run time was 16 min. The HPLC column was allowed to reequilibrate for another 10 min prior to the next injection. Quantification was done using α-tocopherol acetate as internal standard. Due to limited commercial availability, only β-carotene and zeaxanthin were quantified. The procedures for calculating carotenoids contents were taken from Irakli et al..8
Sterols
The simultaneous determination of tocopherols and sterols was done through gas chromatography with mass spectrometry (GC-MS).9 For this step, total lipids
from each bread were derivatized in accordance with Beveridge et al.,10 using (trimethylsilyl)trifluoroacetamide
(BSTFA) as the derivatizing agent. Two microliters from each sample were injected and separated in a GC-MS from Thermo brand, model Focus DSQ II, equipped with an automatic injector and a DB-5 capillary column (5% phenyl and 95% methylpolisiloxane, 30 m length, 0.25 mm internal diameter and 0.25 µm of stationary phase). Initially, the column temperature was maintained at 200 °C for 8 min. It was then raised to 235 °C at a rate of 3 °C min–1. Soon
after, it was raised for the final time to 280 °C at a rate of 15 °C min–1 and maintained for 15 min. The flow rate for the
carrier gas (He) was 1.0 mL min–1. The injector temperature
was 280 °C. The sample split ratio was 1 per 10. Data acquisition was done through Xcalibur software, which includes a database from spectra library NIST MS search version 2.0. Quantification of compounds was done in relation to 5α-cholestane as internal standard. The equation used for calculating the amounts of tocopherols and sterols was taken from Li et al..11 It is important to mention that
total lipids were used in this step instead of a milled bread sample because lipid fractions of pseudocereals such as chia contain significant amounts of sterols.12
Phenolic compounds
Extraction of phenolic compounds was executed in accordance with the procedure proposed and validated by
Irakli et al..13 Approximately 0.1 g of lyophilized milled
bread was mixed with 5 mL of acetonitrile and 1 mL of HCl (0.1 mol L–1), then submitted to sonication in an ultrasound
vat for 30 min. Following centrifugation at 4000 rpm for 10 min, the supernatant was removed and the extraction was repeated once again with 2.5 mL of acetonitrile and 0.5 mL of HCl (0.1 mol L–1). The combined extracts were evaporated to
less than 1 mL under vacuum at 40 °C through use of a rotary evaporator. Then, 2 mL of HCl (0.05 mol L–1) were added for
the subsequent purification step with SPE cartridges, namely Discovery-CN (500 mg sorbent amount and 6 mL volume) from Supelco and Chromabond C18 (200 mg sorbent amount and 3 mL volume) from Macherey-Nagel. Both types of cartridge were preconditioned with 3 mL of methanol and equilibrated with 3 mL of deionized water acidified with HCl to pH 2.0. Then approximately 3 mL of sample extract was poured into the Chromabond C18 cartridge and the retained analytes were eluted with 2 mL of MeOH-1% acetic acid in water (70:30, v v–1). The effluent that was not retained
by the C18 cartridge was passed through the Discovery-CN cartridge in order to retain the more polar compounds, which were then eluted with 2 mL of MeOH-1% acetic acid in water (90:10, v v–1). The final fractions were collected, evaporated
to dryness under a gentle flow of nitrogen at 30 °C and the residues were dissolved in 400 µL of the initial mobile phase (which is described below).
HPLC analyses were performed using a Thermo Finnigan Surveyor HPLC pump coupled with an absorbance detector at 280 and 254 nm. Separation was performed with a Symmetry C18 (5 µm particle size, 3.9 mm × 150 mm) column (Waters, Milford, MA) at room temperature. Elution was carried out using a gradient procedure with a mobile phase containing solvent A (0.1% acetic acid in water) and solvent B (0.1% acetic acid in methanol) as follows: 0 min, 5% B; 15 min, 20% B; 35 min, 40% B; 42 min, 65% B; 50 min, 80% B; 52 min, 5% B; 60 min, 5% B. The runtime was 60 min, the solvent flow rate was 0.8 mL min–1, and the injection volume was 10 µL.14
Mass spectrometry (MS) analysis of a phenolic extract of the bread which possessed that highest amounts of chia seeds and carrot leaves (E4) was performed using a MICROMASS® Quattro MicroTM API. Electrospray
ionization (ESI) was chosen as the ionization method. The mass spectrum was recorded with ESI in the negative mode. The parameters were as follows: capillary voltage: 2.50 kV; cone voltage: 40 V; desolvation gas (N2) temperature:
200 °C; desolvation gas flow rate: 350 L h−1; cone gas flow
rate: 50 L h−1; scanning range: from 150 to 340 amu. These
Tests of oxidation
The bread oxidation tests followed the method proposed by Verardo et al..16 A reactor called “Oxitest®”
(Velp Scientifica, Usmate, Milan, Italy) equipped with two separated oxidation chambers was employed. Then the sample of interest is added inside the chamber. The system is sealed, heated to a certain temperature and a predetermined pressure of oxygen is injected inside the chamber. Once this addition is complete, the entire chamber is manually locked and the analysis begins. Over the course of time, any oxidizable compound reacts with the oxygen in the chamber; thus, the gas pressure inside the chamber will decline until all the substrate reacts with the oxygen. This decrease in pressure is monitored throughout the entire experiment, and the induction point (IP) of the sample is obtained using the method of two tangents. If a compound that can delay sample oxidation is added to the system, then more time will be needed for the oxygen pressure to start to decrease. Thus, the Oxitest® method is efficient
at confirming the delaying/inhibitory ability of a certain compound against oxidation of a determined substrate. Each test in this work was performed at a temperature of 90 °C and with an oxygen pressure of 6 bar, 99.9999% purity. Approximately 18 g of lyophilized milled bread was used in each test.
Considerations about presentation of results
All analyses were done in triplicate, and the means of the results are presented in tables. Standard deviations or the use of different letters to indicate significant differences between values were not included because it is unnecessary to include such parameters in results from factorial designs.17 All results were submitted to analysis of variance
(ANOVA) and response surface methodology. However, the obtained coefficients of variation and determination through ANOVA were unsatisfactory, regardless of model type. Thus, such results were not included in this work. Instead, the correlation values which were further presented in this work come from the line graphs which are produced by plotting one set of data with another.
Results and Discussion
Carotenoids, tocopherols, sterols, phenolic compounds and induction points
From now on, discussions regarding the analyzed compounds will be explored from thermal and oxidative degradation points of view. During breadmaking, the
oxidation of compounds is mostly limited to the kneading step, where water and oxygen levels in the dough facilitate the lipoxygenase catalyzed oxidation, accelerating the rate of their decomposition.18 During the bread leavening
phase, no further decrease in the amounts of this type of compound are observed, because during this step no further oxygen is incorporated in the dough and the yeast consume the available oxygen, thus stopping enzyme-mediated oxidation processes.19 These facts would lead one
to conclude that degradation of antioxidants during baking only occurs through the action of heat. However, during the baking process, Mailard reaction products (MRPs) with pro-oxidant activity are formed in the early stages of the Maillard reaction prior to the Amadori rearrangement.1
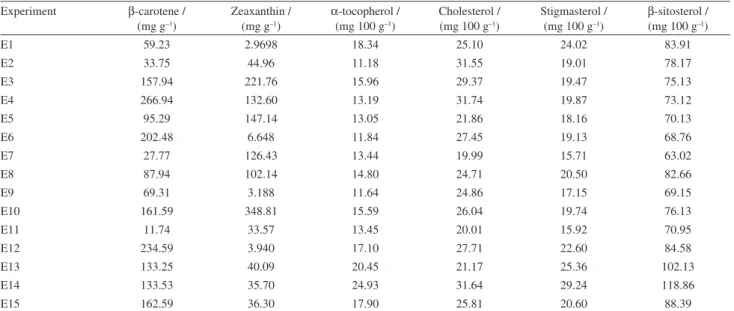
Carotenoids, tocopherols, sterols and polyphenols may react with such products; thus, the possibility of antioxidant losses through oxidation by MRPs should not be ignored. The results of the carotenoid, sterols and α-tocopherol quantification for each experiment are shown in Table 2. Regarding β-carotene content, the E4 and E12 runs produced the greatest concentrations, whilst E1 gave the lowest. In relation to zeaxanthin content, breads E4 and E10 showed the highest values, while E1 showed the lowest. It was observed that, in most cases, carrot leaves were the main contributors to the carotenoid contents of the breads. Although chia seeds also possess some carotenoids, their amounts are very small.20 As can be observed, it was
difficult to establish a pattern with simultaneous variation in the X1, X2 and X3 factors for all compounds.
Taking only thermal stability into account, carotenoids are very heat stable even after prolonged heat treatments.21
However, during baking, carotenoid losses of 21 and 47% for bread crumb and crust, respectively, have been reported,22 with significant reductions in lutein ranging from
28 to 62% (subject to baking conditions and ingredients).22
This happens because cooking does not have the same effects on the whole bread mass; the crust’s temperature is almost equal to that in the oven, while in the core the temperature is lower.23 Cases where the amounts of
zeaxanthin are greater than β-carotene can be justified by the following fact: the quenching of carotenoid activity by pro-oxidant MRPs is dependent on their number of double bonds, and β-carotene possesses a greater number of double bonds in its structure than zeaxanthin. This means that β-carotene might have reacted more with pro-oxidant MRPs, resulting in higher degradation.24 However, this
theory has not been confirmed in many breads. The reason why such confirmation was not found is described in the paragraph regarding interaction among antioxidants.
This fact can be justified because the free radical scavenging activity of tocopherols is the highest in δ-tocopherol followed by γ-, β-, and α-tocopherol.25 Moreover, taking
only their oxidative stability into account, tocopherols react in greater amounts than carotenoids.24 Approximately 30%
of tocopherols are destroyed during the baking of bread.26
Regarding sterols, cholesterol (from the milk used during bread making), stigmasterol and β-sitosterol were detected and quantified. The experiments showed that the largest amounts of α-tocopherol, stigmasterol and β-sitosterol came from breads E13 and E14, whilst the lowest amounts of each compound came from breads E2, E7 and E11, respectively. The highest and lowest contents of cholesterol were observed in breads E14 and E7, respectively.
Interaction among antioxidants can explain why is so hard to predict how the fatty acid composition of breads might change with simultaneous changes in the X1, X2
and X3 factors. While other authors27 have stated that
carotenoids are regenerated by tocopherols and tocopherols are regenerated by carotenoids, Romero et al.28 reports
that such a protective effect was not observed by them. This regenerative effect may be the reason why there are breads in which the amount of β-carotene exceeds that of zeaxanthin. In addition to this uncertainty about the simultaneous actions of carotenoids and tocopherols, there are the additional effects of sterols on the entire system.
Sterols are sensitive to the effects of temperature, light, metal ions, pigments and enzymes.29 Thermal degradation
of sterols occurs at temperatures higher than 140 °C.30
Even so, some controversial data about them can be noted. Barriuso et al.31 stated that sterol susceptibility to
degradation follows, in decreasing order: campesterol >
β-sitosterol > stigmasterol > cholesterol, while Xu et al.32
reported no differences in degradation rates among sterols. Adding the uncertainty about sterols’ order of stability to the fact that tocopherols protect sterols from oxidative degradation29 to all of the discussion above only
corroborates why a definitive trend regarding simultaneous modification of factors X1, X2 and X3 was not achieved.
Although polyphenols are more stable to oxidative degradation than carotenoids, tocopherols and sterols,24
they are the most unstable under application of high temperatures,33 such as occurs during baking. Carrot leaves
do not have a remarkable amount of phenolic compounds34
and a maximum of 2% carrot leaves was applied in the bread, reducing their potential contribution even more. Chia seeds possess a good amount of phenolic compounds, although this quantity is small regarding total bread mass because only 1-2% seeds were used in the recipes. Finally, the high temperature of the baking machine together with long baking times led to the destruction of polyphenols to such an extent that they did not appear in the HPLC experiments, invalidating their quantification. However, some polyphenols were still left intact, as can be seen from the MS spectrum of E4 bread sample (Figure 1).
By comparing the observed data with monoisotopic masses in the negative mode of several polyphenols (such masses are described inside parenthesis just below), there is a probability that the following compounds exist in the bread extract: caffeic acid (179.04), the major phenolic component of chia seeds,35p-coumaric acid (163.04),
syringic acid (197.04), and ferulic acid (193.05). The detailed phenolic composition of carrot leaves is still unknown, so it is assumed that the remaining polyphenols
Table 2. Carotenoid quantification (mg g–1 of sample, dry matter basis) and amounts of sterols and α-tocopherol (mg 100 g–1 of lipid)
Experiment β-carotene / (mg g–1)
Zeaxanthin / (mg g–1)
α-tocopherol / (mg 100 g–1)
Cholesterol / (mg 100 g–1)
Stigmasterol / (mg 100 g–1)
β-sitosterol / (mg 100 g–1)
E1 59.23 2.9698 18.34 25.10 24.02 83.91
E2 33.75 44.96 11.18 31.55 19.01 78.17
E3 157.94 221.76 15.96 29.37 19.47 75.13
E4 266.94 132.60 13.19 31.74 19.87 73.12
E5 95.29 147.14 13.05 21.86 18.16 70.13
E6 202.48 6.648 11.84 27.45 19.13 68.76
E7 27.77 126.43 13.44 19.99 15.71 63.02
E8 87.94 102.14 14.80 24.71 20.50 82.66
E9 69.31 3.188 11.64 24.86 17.15 69.15
E10 161.59 348.81 15.59 26.04 19.74 76.13
E11 11.74 33.57 13.45 20.01 15.92 70.95
E12 234.59 3.940 17.10 27.71 22.60 84.58
E13 133.25 40.09 20.45 21.17 25.36 102.13
E14 133.53 35.70 24.93 31.64 29.24 118.86
from the bread sample came from carrot leaves. Thus, it is probable that a small percentage of the four phenolic acids cited above remained intact. However, all flavonoids were destroyed beyond recognition in the MS experiment.
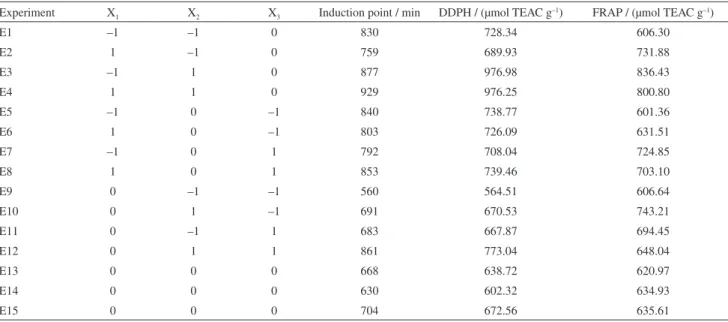
Table 3 shows the results of the induced oxidation test from each experiment. The highest and lowest induction points were observed in breads E4 and E9, respectively. In this part of the study, only the oxidative stability of each sample was taken into account. In this context, some authors3 have stated that β-carotene has no antioxidant
effect at concentrations below 500 ppm because it did
not alter the induction time. However, at concentrations greater than 500 ppm, β-carotene act as a prooxidant, significantly decreasing the induction period. Tocopherols are very efficient in delaying induction times, although there is no cooperative interaction between α-tocopherol and β-carotene in delaying the onset of oxidation.3,28
Antagonism has been observed between α-tocopherol and rosmarinic acid or caffeic acid, while quercetin and
α-tocopherol show synergism in decreasing the oxidation of lard.27 However, since each food matrix is unique, which
might lead to different modes of action of their endogenous
Figure 1. Typical MS spectrum of white bread enriched with chia seeds and carrot leaves (E4). Each peak is listed with its respective m/z ratios and intensities.
Table 3. Induction points in bread oxidation experiments and results of antioxidant capacity by DPPH and FRAP assaysa
Experiment X1 X2 X3 Induction point / min DDPH / (µmol TEAC g–1) FRAP / (µmol TEAC g–1)
E1 –1 –1 0 830 728.34 606.30
E2 1 –1 0 759 689.93 731.88
E3 –1 1 0 877 976.98 836.43
E4 1 1 0 929 976.25 800.80
E5 –1 0 –1 840 738.77 601.36
E6 1 0 –1 803 726.09 631.51
E7 –1 0 1 792 708.04 724.85
E8 1 0 1 853 739.46 703.10
E9 0 –1 –1 560 564.51 606.64
E10 0 1 –1 691 670.53 743.21
E11 0 –1 1 683 667.87 694.45
E12 0 1 1 861 773.04 648.04
E13 0 0 0 668 638.72 620.97
E14 0 0 0 630 602.32 634.93
E15 0 0 0 704 672.56 635.61
antioxidants,36 another method is needed to determine the
real contributors to the observed induction points for each bread.
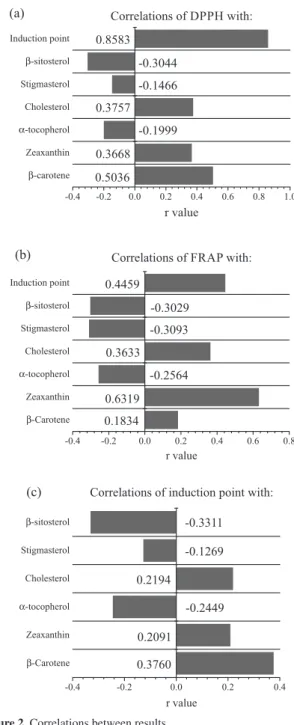
Correlation studies
Correlation values between carotenoids, tocopherols, sterols, IP and the results for total antioxidant activity (TAC) were determined in order to evaluate the empirical relationships among these variables. The correlation results are shown in Figures 2a, 2b and 2c. The TAC data that was used to calculate coefficients of correlation was extracted from our previous article.1
From Figure 2a it can be observed that the best correlation was observed between the results from 2,2-diphenyl-1-picrylhydrazyl (DPPH) TAC assay and IPs from the Oxitest®. This trend was expected, since both
methods were applied directly to the samples, increasing the number of molecules with antioxidant capacity available to react in the specific medium of analysis. However, this same trend was not observed between the results from ferric reducing antioxidant power (FRAP) TAC assay and IPs, despite FRAP assays also being applied directly to the samples. The reason why such a low correlation value was obtained is probably the same reason why the DPPH and FRAP assays showed a relatively low correlation (r = 0.504) in our previous article: these methods monitor the same reaction mechanism (electron transfer); however, they are influenced by the pH and solvent used in the reaction medium.37 Even with TAC assays being performed
without extraction steps, there is still solvent in the reaction medium, required for solubilization of the radicals used in every assay. In the DPPH method, a 50:50 (v v–1)
mixture of ethanol and water is responsible for radical solubilization, whilst in the FRAP procedure the radicals are solubilized in water. Furthermore, in the FRAP assay, the pH is maintained at 3.6, unlike in the DPPH assay. Thus, some or all of these factors may have been responsible for the differences between the DPPH and FRAP values, which also led to discrepancies between the DDPH/IP and FRAP/IP correlation numbers.
It is important to observe that most of the r values in Figures 2a, 2b and 2c are not very high. Also, in every case,
α-tocopherol and phytosterols were negatively correlated with DDPH/FRAP/IPs. These trends are in accordance with Yang et al.,38 who determined and correlated the contents
of minor components and IP in cold-pressed oils from 203 rapeseed varieties from the Yangtze River Valley in China. They obtained low positive correlations between the IP and lutein or total tocopherols (for lutein, r = 0.250; for total tocopherols, r = 0.225) and inverse correlations between the
IP and phytosterols (r = –0.259). Grau et al.36 found a highly
significant negative correlation between oxidative parameters and the α-tocopherol content of black chicken meat.
Based on all the figures, it can be suggested that carotenoids and cholesterol may be the most important contributors to the TAC and IPs results, while β-carotene is most relevant for DPPH/IPs and zeaxanthin for FRAP/IP. This suggests that β-carotene reacts in an easier manner with the DPPH radical while zeaxanthin is more prone to react first in the FRAP assay. It is likely the same factors may be responsible for the differences between the DPPH and FRAP values, also justifying the different reaction priorities of carotenoids in the DPPH/FRAP assays.
Conclusions
The BBD, allied with the correlation studies, allowed us to determine that the total antioxidant capacity and the results after forced oxidation of a bread system supplemented with chia seeds and carrot leaves can be explained primarily by the carotenoid and cholesterol content, while α-tocopherol and phytosterols have negative relationships with TAC. The extent of each correlation depends on the assay in question. The baking procedure had a severe impact on the phenolic compounds in the bread, because they were not detected during HPLC analyses.
Acknowledgments
The authors would like to thank CAPES for financial support.
References
1. Maruyama, S. A.; Palombini, S. V.; Claus, T.; Carbonera, F.; Montanher, P. F.; de Souza, N. E.; Visentainer, J. V.; Gomes, S. T. M.; Matsushita, M.; J. Braz. Chem. Soc. 2013, 24, 1520. 2. Rosales-Soto, M. U.; Powers, J. R.; Alldredge, J. R.; J. Sci.
Food Agric. 2011, 92, 1511.
3. Henry, L. K.; Catignani, G. L.; Schwartz, S. J.; J. Am. Oil Chem. Soc. 1998, 75, 1399.
4. Wang, T.; Hicks, K. B.; Moreau, R.; J. Am. Oil Chem. Soc.
2002, 79, 1201.
5. Lim, H. S.; Park, S. H.; Ghafoor, K.; Hwang, S. Y.; Park, J.;
Food Chem.2011, 124, 1577.
6. Lu, T.-M.; Lee, C.-C.; Mau, J.-L.; Lin, S.-D.; Food Chem. 2010,
119, 1090.
7. Sun-Waterhouse, D.; Sivam, A. S.; Cooney, J.; Zhou, J.; Perera, C. O.; Waterhouse, G. I. N.; Food Res. Int. 2011, 44, 3047. 8. Irakli, M. N.; Samanidou, V. F.; Papadoyannis, I. N.; J. Sep.
Sci.2011, 34, 1375.
9. Du, M.; Ahn, D. U.; J. Food Sci.2002, 67, 1696.
10. Beveridge, T. H. J.; Li, T. S. C.; Drover, J. C. G.; J. Agric. Food
Chem.2002, 50, 744.
11. Li, T. S. C.; Beveridge, T. H. J.; Drover, J. C. G.; Food Chem.
2007, 101, 1633.
12. Ciftci, O. N.; Przybylski, R.; Rudzinska, M.; Eur. J. Lipid Sci.
Technol.2012, 114, 794.
13. Irakli, M. N.; Samanidou, V. F.; Biliaderis, C. G.; Papadoyannis, I. N.; J. Sep. Sci.2012, 35, 1603.
14. Zhao, H.; Chen, W.; Lu, J.; Zhao, M.; Food Chem.2010, 119, 1150.
15. Zhao, Z.; Dong, L.; Lin, F.; Wu, Y.; Arabian J. Chem.2013, 6, 205.
16. Verardo, V.; Riciputi, Y.; Sorrenti, G.; Ornaghi, P.; Marangoni, B.; Cabon, M. F.; LWT--Food Sci. Technol.2013, 50, 732. 17. Trovó, A. G.; Gomes-Junior, O.; Machado, A. E. H.;
Borges-Neto, W.; Silva, J. O.; J. Braz. Chem. Soc.2013, 24, 76. 18. Fratianni, A.; Criscio, T. D.; Mignogna, R.; Panfilli, G.; Food
Chem.2012, 131, 590.
19. Hidalgo, A.; Brandolini, A.; J. Cereal Sci.2010, 52, 254. 20. Ixtaina, V. Y.; Martínez, M. L.; Spotorno, V.; Mateo, C. M.;
Maestri, D. M.; Diehl, B. W. K.; Nolasco, S. M.; Tomás, M. C.;
J. Food Compos. Anal.2011, 24, 166.
21. Nicoli, M. C.; Anese, M.; Parpinel, M.; Trends Food Sci.
Technol.1999, 10, 94.
22. Adbel-Aal, E. M.; Rabalski, I.; J. Cereal Sci.2013, 57, 312. 23. Muntean, E.; Muntean, N.; Lazar, V.; Modoran, C.;
J. Agroaliment. Processes Technol.2006, 1, 89. 24. Kim, N.; Choe, E.; Food Sci. Biotechnol.2013, 22, 315. 25. Choe, E.; Min, D. B.; Compr. Rev. Food Sci. Food Saf.2006, 5,
169.
26. Tiwari, U.; Cummins, E.; Trends Food Sci. Technol.2009, 20, 511.
27. Choe, E.; Min, D. B.; Compr. Rev. Food Sci. Food Saf.2009, 8, 345.
28. Romero, N.; Robert, P.; Masson, L.; Ortiz, J.; González, K.; Tapia, K.; Dobaganes, C.; Food Chem.2007, 104, 383. 29. Kmiecik, D.; Korczak, J.; Rudzínska, M.; Kobus-Cisowska, J.;
Gramza-Michałowska, A.; Hes, M.; Food Chem.2011, 128, 937. 30. Kaloustian, J.; Alhanout, K.; Amiot-Carlin, M.-J.; Lairon, D.;
Portugal, H.; Nicolay, A.; Food Chem.2008, 107, 1379. 31. Barriuso, B.; Otaegui-Arrazola, A.; Menéndez-Carreño, M.;
Astiasarán, I.; Food Chem.2012, 135, 706.
32. Xu, G.; Guan, L.; Sun, J.; Chen, Z.; J. Agric. Food Chem.2009,
57, 9284.
33. Santos, N. A.; Cordeiro, A. M. T. M.; Damasceno, S. S.; Aguiar, R. T.; Rosenhaim, R.; Carvalho-Filho, J. R.; Santos, I. M. G.; Maia, A. S.; Souza, A. G.; Fuel2012, 97, 638.
34. Kahkonen, M. P.; Hopia, A. I.; Vuorela, H. J.; Rauha, J.-P.; Pihlaja, K.; Kujala, T. S.; Heinonem, M.; J. Agric. Food Chem.
1999, 47, 3954.
35. Reyes-Caudillo, E.; Tecante, A.; Valdivia-López, M. A.; Food
Chem.2008, 107, 656.
36. Grau, A.; Guardiola, F.; Grimpa, S.; Barroeta, A. C.; Codony, R.;
Poultry Sci.2001, 80, 1630.
37. Apak, R.; Güçlü, K.; Demirata, B.; Özyürek, M.; Çelik, S. E.; Bektasoglu, B.; Berker, K. I.; Özyurt, D.; Molecules2007, 12, 1496.
38. Yang, M.; Zheng, C.; Zhou, Q.; Huang, F.; Liu, C.; Wang, H.;
J. Food Compos. Anal.2013, 29, 1.
Submitted on: December 17, 2013