OSD
8, 1233–1259, 2011N/P ratio of nutrient uptake in the Baltic
Sea
Z. Wan et al.
Title Page
Abstract Introduction
Conclusions References
Tables Figures
◭ ◮
◭ ◮
Back Close
Full Screen / Esc
Printer-friendly Version Interactive Discussion
Discussion
P
a
per
|
Dis
cussion
P
a
per
|
Discussion
P
a
per
|
Discussio
n
P
a
per
|
Ocean Sci. Discuss., 8, 1233–1259, 2011 www.ocean-sci-discuss.net/8/1233/2011/ doi:10.5194/osd-8-1233-2011
© Author(s) 2011. CC Attribution 3.0 License.
Ocean Science Discussions
This discussion paper is/has been under review for the journal Ocean Science (OS). Please refer to the corresponding final paper in OS if available.
N/P ratio of nutrient uptake in the
Baltic Sea
Z. Wan1, L. Jonasson1, and H. Bi2
1
Centre for Ocean and Ice, Danish Meteorological Institute, Lyngbyvey 100, 2100 Copenhagen, Denmark
2
Chesapeake Biological Laboratory, P.O. Box 38, Solomons, MD 20688, USA
Received: 5 March 2011 – Accepted: 23 May 2011 – Published: 10 June 2011
Correspondence to: Z. Wan (zw@dmi.dk)
OSD
8, 1233–1259, 2011N/P ratio of nutrient uptake in the Baltic
Sea
Z. Wan et al.
Title Page
Abstract Introduction
Conclusions References
Tables Figures
◭ ◮
◭ ◮
Back Close
Full Screen / Esc
Printer-friendly Version Interactive Discussion
Discussion
P
a
per
|
Dis
cussion
P
a
per
|
Discussion
P
a
per
|
Discussio
n
P
a
per
|
Abstract
The N/P ratio of nutrient uptake, i.e., the ratio of dissolved inorganic nitrogen (DIN) to dissolved inorganic phosphorus (DIP) taken by primary producers, varies in different basins and in different seasons in the Baltic Sea. The N/P ratio of nutrient alteration fore and after spring blooms is not same as the N/P ratio of nutrient uptake, but the 5
former can be regarded as an indicator for the later in the Baltic Sea. Based on the observed N/P ratio of nutrient alteration, we hypothesize a non-Redfield N/P ratio of nutrient uptake. The 3D-ecosystem model ERGOM coupled with the circulation model DMI-BSHcmod was used to test the hypothesis. When the Redfield ratio was used in the model, the DIP surplus after spring blooms was too high and resulted in the overly 10
growth of cyanobacteria and too much nitrogen fixation. When the non-Redfield ratio was used in the model, the corresponding problem tended to disappear. In summary, we show that: (1) the Redfield N/P ratio of nutrient uptake in the Baltic Sea tends to be too high; (2) a lower N/P ratio 10:1 appears to work better than the Redfield value; and (3) the N/P ratio of nutrient uptake in the Baltic Proper during spring blooms is around 15
6:1.
1 Introduction
The N/P ratio of nutrient uptake is often referred as the ratio of dissolved inorganic nitrogen (DIN) to dissolved inorganic phosphorus (DIP) taken by primary producers through photosynthesis. The N/P ratio of nutrient uptake can differ among species and 20
life stages, which affects the biogeochemistry in many marine ecosystems (Minster and Boulahdid, 1987; Arrigo et al., 1999; Kress and Herut, 2001; Wong, et al., 2002; Anderson and Pondaven, 2003). Redfield (1934) analyzed the elemental ratios of phy-toplankton for the world’s oceans and proposed the famous Redfield Ratios. There-after, the Redfield ratios were widely used in ecosystem models. However, a fixed N/P 25
OSD
8, 1233–1259, 2011N/P ratio of nutrient uptake in the Baltic
Sea
Z. Wan et al.
Title Page
Abstract Introduction
Conclusions References
Tables Figures
◭ ◮
◭ ◮
Back Close
Full Screen / Esc
Printer-friendly Version Interactive Discussion
Discussion
P
a
per
|
Dis
cussion
P
a
per
|
Discussion
P
a
per
|
Discussio
n
P
a
per
|
to real ecosystems. In fact, variable N/P ratios were used in a few studies (Touratier et al., 2001; Moore et al., 2002; Kuznetsov, 2008). The Baltic Sea is characterized with strong nitrogen fixation of cynanobacteria and abundant denitrification in anoxic bottom water (Shaffer and Rønner, 1984) and various nutrient conditions in different basins. Therefore, it remains a challenge to estimate a suitable N/P ratio of nutrient 5
uptake in the Baltic Sea.
The N/P ratio of nutrient uptake in the Baltic Sea is generally considered to be con-sistent with the Redfield Ratios in both modeling studies (Neumann 2000; Edelvang et al., 2005; Savchuk et al., 2008; Eilola et al., 2009) and observation based studies (Osterroht and Thomas, 2000; Savchuk, 2005). In many cases, but not always, Red-10
field ratios are feasible in interpreting the spatial and temporal dynamics in nutrient concentration. For example, Osterroht and Thomas (2000) noticed that the N/P ratio of nutrient alteration fore and after the growing season was much different from Red-field ratios, they explained that the elemental ratios of nutrient uptake were consistent with Redfield ratios, but the nutrient mineralized from freshly produced organic material 15
had non-Redfield ratios. It could also be alternatively explained that the elemental ra-tios of nutrient uptake were inconsistent with Redfield rara-tios. Other investigations have suggested that the elemental ratios of biology in the Baltic Sea could differ from the Redfield Ratios (Shaffer, 1987; Larsson et al., 2001). Larsson et al. (2001) reported that the N/P ratio of nutrient uptake during cyanobacterial blooms in the Baltic Sea 20
might be several times larger than Redfield Ratio. Kuznetsov et al. (2008) modeled the ecological effect of a variable C:N:P ratio for cyanobacteria, based on Larsson et al.’s findings.
The objective of this paper was to identify a suitable N/P ratio of nutrient uptake for the Baltic Sea and to investigate the effects of non-Redfield Ratios on the Baltic ecosys-25
OSD
8, 1233–1259, 2011N/P ratio of nutrient uptake in the Baltic
Sea
Z. Wan et al.
Title Page
Abstract Introduction
Conclusions References
Tables Figures
◭ ◮
◭ ◮
Back Close
Full Screen / Esc
Printer-friendly Version Interactive Discussion
Discussion
P
a
per
|
Dis
cussion
P
a
per
|
Discussion
P
a
per
|
Discussio
n
P
a
per
|
is needed to calibrate the ecological model as well. The ecosystem model, ERGOM developed by Neumann (2000) was integrated with the existing circulation model, DMI-BSHcmod to provide the pre-operational service at ecosystem level for the Baltic Sea. ERGOM assumed that the elemental composition of biology was consistent with the Redfield Ratios. Previous modeling results showed large surplus of DIP after the ex-5
haustion of DIN during spring blooms, and the excessive DIP thus led to the overly growth of cyanobacteria. These model biases motivate us to examine the observed DIN and DIP and to check for the ratio of DIN alteration to DIP alteration fore and after spring blooms (referred to the N/P ratio of nutrient alteration hereafter). The N/P ratio of nutrient alteration is found inconsistent with the Redfield value (Table 2). Nevertheless 10
the N/P ratio of nutrient alteration is not identical to the N/P ratio of nutrient uptake, we used the former as an indicator for the later, because the Baltic Sea is relatively closed and the imported nutrients are less than the nutrient uptake. Therefore, we run the ecosystem model with Redfield Ratios and non-Redfield ratios and compare the model results with the observed data to examine the potential implications.
15
2 Methods
2.1 Physical model
The physical model in this study is the Danish Meteorological Institute (DMI) opera-tional model DMI-BSHcmod, which was originally developed by German Bundesamt fuer Seeschifffahrt und Hydrographie (BSH) (Dick et al., 2001). The core of the phys-20
ical model, a circulation model, is based on the primitive geophysical fluid dynamics equations for the conservations of volume, momentum, salinity and heat. The thermo-dynamic model component could resolve the ice thermo-dynamics, as well as the reflection and absorption of shortwave radiation by the seabed in shallow zones. The impact from wind, atmospheric pressure, air temperature, humidity, evaporation-precipitation 25
OSD
8, 1233–1259, 2011N/P ratio of nutrient uptake in the Baltic
Sea
Z. Wan et al.
Title Page
Abstract Introduction
Conclusions References
Tables Figures
◭ ◮
◭ ◮
Back Close
Full Screen / Esc
Printer-friendly Version Interactive Discussion
Discussion
P
a
per
|
Dis
cussion
P
a
per
|
Discussion
P
a
per
|
Discussio
n
P
a
per
|
tidal water level and the monthly climatologies of temperature and salinity are imposed as the outer lateral conditions, and the river runoffs as the inner lateral condition. The operational implementation of the circulation model started at BSH since mid-90s and was further developed at DMI since 2001.
The model grids cover from 48◦33′N to 65◦51′N and from 4◦05′W to 30◦15′E with
5
a horizontal resolution of 6’ along latitude and 10’ along longitude, while a nested fine grid with one sixth of the coarse resolution covers the Danish Strait, in order to resolve the water exchange through the narrow sills between the North Sea and the Baltic Sea. The coarse grid has 50 vertical layers, with thicknesses of 8 m (surface layer, to avoid drying at low tides), 2 m (36 subsurface layers) and 4 m (1), 8 m (2), 25 m (2) and 50 m 10
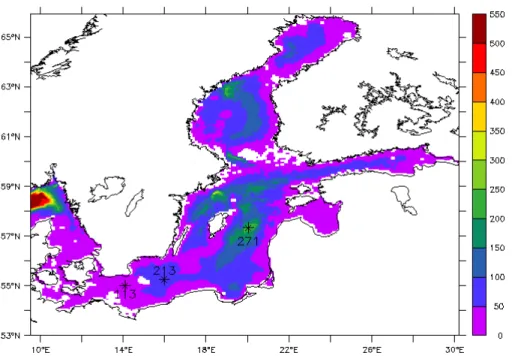
(8) increased gradually. The fine grid has 52 vertical layers, with thicknesses of 2 m (surface), 1 m (29) and 2 m (all rest). The model domain includes both the Baltic Sea and the North Sea (Fig. 1), in order to supply a sufficient transition to counteract the effects from open boundaries.
The model is driven by hourly meteorological forcing (10 m winds, 2 m air tempera-15
ture, mean sea level pressure, surface humidity and cloud cover) based on DMI’s ver-sion of the operational weather model HIRLAM (High Resolution Limited Area Model). The weather model has a horizontal resolution of about 15 km. River runoffis set with the daily averaged data derived from river measurements for 5 German rivers, oper-ational outputs for 43 Baltic catchments by a hydrological model HBV run in Swedish 20
Meteorological Hydrological Institute (SMHI) (Bergstr ¨om, 1976 and 1992) and clima-tology for the remaining rivers. The configuration and performance of DMI-BSHcmod were detailed in the previous investigations (She et al., 2007a, b; Larsen et al., 2007; Liu et al., 2009).
2.2 Ecosystem model
25
OSD
8, 1233–1259, 2011N/P ratio of nutrient uptake in the Baltic
Sea
Z. Wan et al.
Title Page
Abstract Introduction
Conclusions References
Tables Figures
◭ ◮
◭ ◮
Back Close
Full Screen / Esc
Printer-friendly Version Interactive Discussion
Discussion
P
a
per
|
Dis
cussion
P
a
per
|
Discussion
P
a
per
|
Discussio
n
P
a
per
|
zooplankton community; a detritus pool; and the dissolved oxygen (DO). The model mathematically describes the related biogeochemical processes: photosynthesis, nu-trient uptake, growth, grazing, digestion, respiration, excretion, mortality, mineraliza-tion, nitrogen fixamineraliza-tion, nitrificamineraliza-tion, denitrification. This model is nitrogen-based, and phosphorus is coupled to nitrogen via the Redfield ratio. Hydrogen sulfate is included 5
in the model as negative oxygen concentration. A detailed model description and a list of biogeochemical parameterization coefficients can be found in Neumann (2000) and Neumann et al. (2002). We have one simplification to ERGOM by ignoring the re-suspension of sedimental detritus. The parameters used here but different from Neumann et al. (2002) are listed in Table 1.
10
The initial fields for ammonia, nitrate, phosphate and dissolved oxygen are extrapo-lated from the winter means of data (2001∼2009) at 16 off-shore long term monitoring stations from the International Council for the Exploration of the Sea (ICES) website (http://www.ices.dk/indexfla.asp). The initial fields for biological state variables are ma-nipulated through repetitive runs. The open boundary conditions are configured with 15
the data from World Ocean Atlas 2001 (WOA01, Conkright et al., 2002) for ammonia, nitrate, phosphate and DO, and the rest state variables are set with zero. River load-ings are derived from outputs of the operational hydrological model same as for runoffs. The atmospheric nutrient deposition are set based on Langner et al. (2009) and Eilola et al. (2009).
20
2.3 Model runs
We made several model runs with different N/P ratios to find the most suitable one. Three of them will be presented in detail. Case NP16 is defined as the reference model run with N/P ratio 16:1 for discussing the effect of non-Redfield ratio. Case NP10 is defined as the model run with N/P ratio 10:1 and Case NP6 is defined as the 25
OSD
8, 1233–1259, 2011N/P ratio of nutrient uptake in the Baltic
Sea
Z. Wan et al.
Title Page
Abstract Introduction
Conclusions References
Tables Figures
◭ ◮
◭ ◮
Back Close
Full Screen / Esc
Printer-friendly Version Interactive Discussion
Discussion
P
a
per
|
Dis
cussion
P
a
per
|
Discussion
P
a
per
|
Discussio
n
P
a
per
|
2.4 Data
The data used to validate model and to analyze the N/P ratio are all downloaded from the ICES website. ICES is a free-accessory database. ICES data come from different sources, including those of in-situ measurements by automatic monitoring instruments and those of water samplers either from cruises or from fixed stations.
5
The data used to analyze the N/P ratio are from eight fixed stations with monthly based time series of observations (Table 2). We interpolate the monthly time series of observations onto the preset dates to analyze the N/P ratio of nutrient alteration. As different dates varying within one month, the resulted N/P ratio of nutrient alteration does not differ much. Thus, we set 1 February as the date representing the average 10
winter state before spring blooms and 1 June for afterwards summer state. Table 2 lists the mean values in years 2001∼2007 for DIN, DIP fore and after spring blooms and the N/P ratio of nutrient alteration in surface layer at eight fixed stations.
The data used to show seasonal variability so as to compare with seasonal patterns of model results are from three fixed stations in the Baltic Proper: Stat. 113 in Arkona 15
Basin, Stat. 213 in Bornholm Basin and Stat. 271 Gotland Deep (Fig. 1). The surface values of Chl-a, DIN and DIP are used in 2005 to 2007.
The data used to assess the overall model skill include all data records of ICES from 10◦
∼20◦E, 53◦∼66◦N in 2005 to 2007 for Chl-a, DIN and DIP. They are processed in the following scheme of comprehensive validation. The total record numbers are 4868, 20
13689 and 14537 for Chl-a, DIN, and DIP, respectively.
2.5 A comprehensive model validation scheme
Model validation is usually implemented through comparing model results with ob-served data at selected stations or sub-domains. Besides the usual model validation, we use a comprehensive model validation scheme to show model performance overall. 25
OSD
8, 1233–1259, 2011N/P ratio of nutrient uptake in the Baltic
Sea
Z. Wan et al.
Title Page
Abstract Introduction
Conclusions References
Tables Figures
◭ ◮
◭ ◮
Back Close
Full Screen / Esc
Printer-friendly Version Interactive Discussion
Discussion
P
a
per
|
Dis
cussion
P
a
per
|
Discussion
P
a
per
|
Discussio
n
P
a
per
|
The preparation of model-observation pairs follows the following procedures. First, the model outputs are interpolated to match each observed datum, i.e. to form the preliminary model-observation pairs. Second, a 4-dimensional spatiotemporal grid is defined to limit the data representation properly. The mean value of preliminary observation pairs (if more than one) in each grid is used as the secondary model-5
observation pairs. Third, those secondary model-observation pairs with the same specified dimension(s) are further averaged to form the final model-observation pairs. The model skill along the specified dimension(s) are presented through comparing the final model-observation pairs. Say (model,observ.)i ,j,k,l for all the secondary model-observation pairs, the model skill along the dimension k is presented by comparing 10
the mean values of (model,observ.)i ,j,k,l averaged over i, j, l. In this study, the 4-dimensional spatiotemporal grid has a horizontal resolution of 0.5◦
×0.5◦, a vertical resolution of 4 m and a temporal resolution of 15 days for the area from 10◦N
∼30◦E, 53◦N
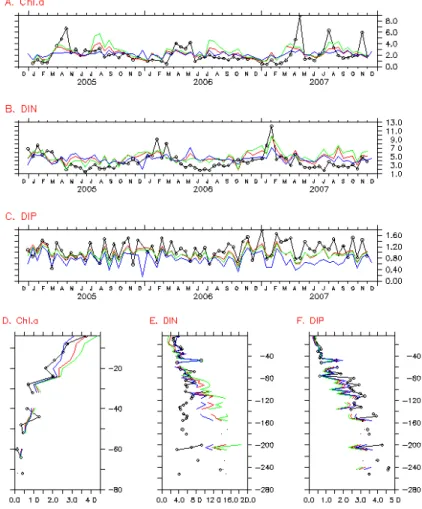
∼66◦N in 2005 to 2007. For example, the overall fitness between model and ob-servations for temporal evolution for Chl-a is reflected by using this scheme (Fig. 3a). 15
Each value in Fig. 3a stands for the “mean” of Chl-a in the whole Baltic Sea at one certain moment. However, the “mean” is not a simple average over all observation records at that moment, but an average over the defined grids where has at least one observation record instead. Again, each value in Fig. 3d stands for the “mean” of Chl-a averaged over all observed grids at one certain depth.
20
3 Result
Although the model domain covers both the Baltic Sea and the North Sea, the model results are only presented in the Baltic Sea as our targeted area in 10◦N
∼30◦E, 53◦N
∼66◦N (Fig. 1). All cases run from 2001 to 2007, but the results of first four years are cut to exclude the impact of initial fields, only the results of last three years 25
OSD
8, 1233–1259, 2011N/P ratio of nutrient uptake in the Baltic
Sea
Z. Wan et al.
Title Page
Abstract Introduction
Conclusions References
Tables Figures
◭ ◮
◭ ◮
Back Close
Full Screen / Esc
Printer-friendly Version Interactive Discussion
Discussion
P
a
per
|
Dis
cussion
P
a
per
|
Discussion
P
a
per
|
Discussio
n
P
a
per
|
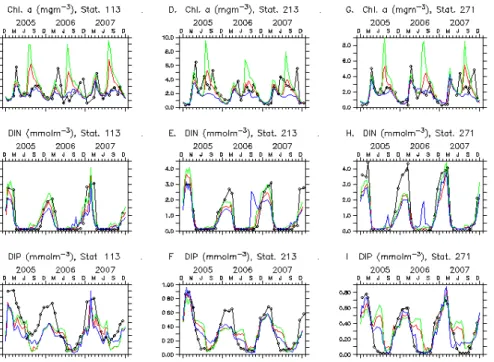
shown in Fig. 2. The model results of Chl-a, DIN and DIP are compared with all avail-able observations in the whole Baltic Sea for examining the overall temporal evolution and vertical profile, shown in Fig. 3. As Chl-a appears only in upper 80 m, the profile of Chl-a is not shown for all depth (Fig. 3d). The model results of Case NP10 are the best approaching to observations in all tested cases. The results of Case NP10 are 5
first presented as a model validation with the calibrated parameters (Table 1). Then the comparison of model results of three are presented to reflect the effect of N/P ratio value on algae blooms and nutrients dynamics.
3.1 Model validation Case NP10
The model results are compared with observations in surface layer at three offshore 10
stations (Fig. 2). The following observed features are reproduced by the model. First, the evolution of growth and recession seasons of phytoplankton is resolved nicely. The growth season of phytoplankton is April to October when Chl-aconcentration is mostly larger than 2 mgm−3 and the recession season is December to February when
Chl-a concentration is mostly less than 1 mgm−3. Another observed feature for Chl-a is
15
the timing of spring bloom, which is also resolved by the model. The main difference between modeled Chl-a and the observed data are the magnitude and the timing of summer-fall peaks. Second, the model results for DIN capture the observed temporal changes including the declination from high winter level, the duration of depletion and the recovery to high level. The difference between the model results and the observed 20
data for DIN is that the winter concentration estimated from the model is lower than observations. Third, the model results for DIP are consistent with observations in the timing of the spring reduction and the fall recovery. The difference between the model results and the observed data includes the underestimation of winter concentration and the insufficient reduction during spring blooms.
25
OSD
8, 1233–1259, 2011N/P ratio of nutrient uptake in the Baltic
Sea
Z. Wan et al.
Title Page
Abstract Introduction
Conclusions References
Tables Figures
◭ ◮
◭ ◮
Back Close
Full Screen / Esc
Printer-friendly Version Interactive Discussion
Discussion
P
a
per
|
Dis
cussion
P
a
per
|
Discussion
P
a
per
|
Discussio
n
P
a
per
|
the model values are similar to the observed data. However, the model underesti-mates the magnitude of spring blooms. The model describes well the vertical profile of observed Chl-a. Second, the model DIN shows the seasonal pattern similar to ob-servations: high value in winter and low value in summer, and seasonal variations of model DIN is smaller than that of observations. The modeled DIN is higher than the 5
observed DIN on average. DIN below euphotic layers is generally overestimated by model. In fact, the vertical profile of model DIN in euphotic layers is consistent with observations. Third, the model DIP is surprisingly consistent with the observed data in both seasonal pattern and vertical distribution, except a slight underestimation.
3.2 Changes of model results from N/P ratio 16:1 to 6:1
10
We made more case runs than the three ones to be presented in detail. When the N/P ratio is lowered down from Case NP16 to Case NP10 and further down to Case NP6, model results change continuously (Figs. 2 and 3). The change is first summarized for the surface values at three fixed stations. The most obvious change for Chl-ais the dis-appearance of overshooting peak of cyanobacteria bloom. In Case NP10, Chl-apeaks 15
in summer-fall are still mostly higher than those in spring, which is inconsistent with the observed Chl-a. When the N/P ratio is further lowered down, the peak in summer-fall is closer to the observed Chl-a. Another change of Chl-a is the decrease of peak height of spring bloom. The change for DIN is the decrease of concentration level in winter. In Case NP6, mineralized DIN in summer can be occasionally surplus, e.g. the 20
shooting up of DIN curve in September 2006 at Stat. 213 (Fig. 2e) and August 2006 at Stat. 271 (Fig. 2h). The most obvious change for DIP is the increase of consumption during spring bloom. In Case NP16, minority of DIP is consumed in spring bloom and the left majority is consumed in summer-fall. In Case NP6, majority of DIP is consumed in spring bloom so that the curve of model DIP is closer the one of observations. 25
OSD
8, 1233–1259, 2011N/P ratio of nutrient uptake in the Baltic
Sea
Z. Wan et al.
Title Page
Abstract Introduction
Conclusions References
Tables Figures
◭ ◮
◭ ◮
Back Close
Full Screen / Esc
Printer-friendly Version Interactive Discussion
Discussion
P
a
per
|
Dis
cussion
P
a
per
|
Discussion
P
a
per
|
Discussio
n
P
a
per
|
effect on DIN is a decrease of magnitude of seasonal variation. The global effect on DIN by changing N/P from 16:1 from 10:1 is not so big as that changing N/P from 10:1 from 6:1. The N/P change from 16:1 to 10:1 does not cause obvious effect on the global temporal pattern of DIP. The N/P change from 10:1 to 6:1 stimulates DIP consumption by phytoplankton so that the global mean DIP decreases. The N/P change from 16:1 5
to 10:1 and then further to 6:1 causes the vertical profiles of model results more and more close to those of observations for all Chl-a, DIN and DIP.
The effects of changing N/P ratio from 16:1 to 6:1 on the total stocks of DIN and DIP and their major process rates are shown in Fig. 4. The effect on DIN is the decrease of total DIN stock and the corresponding decreases in the benthic mineralization. The net 10
benthic mineralization of DIP is increased as the N/P ratio change from Case NP16 to Case NP6. The N/P ratio change from 16:1 to 6:1 switches the increase tendency of DIN stock to a decrease tendency. Meanwhile, the process rates of DIN gets smaller in Case NP6 than in Case NP16. The effect on DIP is more visible than on DIN. Total DIP stock has a decrease tendency in Case NP16, and the decrease tendency 15
is intensified in Case NP6. The seasonal variations of DIP stock and of process rates are all larger in Case NP16 than in Case NP6. The net DIP consumption by pelagic biological community during spring blooms is larger in Case NP6 than in Case NP16, but the consumption in fall is reversely smaller.
4 Discussion
20
4.1 Evidence from the observed data
The observed “N/P ratio of nutrient alteration” (defined in Sect. 1) for surface water decreases from Skagerrak to Gotland (Table 2). The N/P ratio of nutrient alteration decreases from 13.7:1 in Skagerrak to 8.3:1 in Arkona, and persists below 8.0:1 in the Baltic Proper, but jumps to 21.7:1 in Gulf of Bothnia. We also estimated the N/P ratio of 25
OSD
8, 1233–1259, 2011N/P ratio of nutrient uptake in the Baltic
Sea
Z. Wan et al.
Title Page
Abstract Introduction
Conclusions References
Tables Figures
◭ ◮
◭ ◮
Back Close
Full Screen / Esc
Printer-friendly Version Interactive Discussion
Discussion
P
a
per
|
Dis
cussion
P
a
per
|
Discussion
P
a
per
|
Discussio
n
P
a
per
|
of nutrient alteration does not vary much from surface to depth 20 m and then slightly turns smaller downward until the bottom of euphotic layer. Below euphotic layer, the N/P ratio of nutrient alteration is complicated, as it may not be dominated by the N/P ratio of nutrient uptake, unlike in euphotic layers. What does the observed N/P ratio of nutrient alteration mean to the N/P ratio of nutrient uptake? Based on its definition, 5
the N/P ratio of nutrient alterations is determined by the biological nutrient uptake and the nutrients supplied by hydrodynamics. The observed N/P ratio of nutrient alteration means a good estimate to the N/P ratio of nutrient uptake for the surface water in the Baltic Proper. And it further means that the N/P ratio of nutrient uptake there should be much smaller than the Redfield ratio (16:1). Why?
10
Based on its definition, the N/P ratio of nutrient alteration compares the nutrients fore and after spring bloom (calculation scheme in Sect. 2.4). Due to the relatively closed nature of the Baltic Proper, the nutrient alteration is mainly related to four processes: atmospheric nutrient deposition, river nutrient loadings, upwelled nutrient, and nutrient uptake. Comparing the vertical profiles of observations for DIN and DIP (Fig. 3e and 15
f), we can see that the DIN/DIP ratio generally decreases downwards. It means more upwelling contribution during spring bloom means less N/P ratio of nutrient uptake, keeping other nutrient supplies unchanged. Thus the upwelling contribution is not taken into account in the following estimation in order to document the N/P ratio of nutrient uptake is much less than the Redfield Ratio (16:1).
20
First, he mean nutrient concentrations are 3.28 mmol m−3, 0.62 mmol m−3,
0.19 mmol m−3and 0.17 mmol m−3for DIN and DIP fore and after spring blooms in the
Baltic Proper. The means are generated by averaging the values at three stations in the Baltic Proper (Table 2). We use 0.124 mmol m−3D−1for the atmospheric deposition of
DIN, according to Wulffet al. (2001) and Savchuk (2005). The atmospheric deposition 25
of DIN can only raise the DIN concentration 0.75 mmol m−3for the upper 20 m layer in
OSD
8, 1233–1259, 2011N/P ratio of nutrient uptake in the Baltic
Sea
Z. Wan et al.
Title Page
Abstract Introduction
Conclusions References
Tables Figures
◭ ◮
◭ ◮
Back Close
Full Screen / Esc
Printer-friendly Version Interactive Discussion
Discussion
P
a
per
|
Dis
cussion
P
a
per
|
Discussion
P
a
per
|
Discussio
n
P
a
per
|
(0.62−0.17) is around 10:1. If we consider the atmospheric deposition of DIN and river loadings should be evenly distributed in whole mixing layer (say 40 m), the estimate will be smaller than 10:1 definitely. This estimate does nor take account for the small con-tribution of DIP concon-tributions from atmospheric deposition and river loadings. It means a comprehensive estimate will result in a N/P ratio of nutrient uptake smaller than 10:1. 5
A more accurate estimate can be referred to the modeling experiments.
The fact that the N/P ratio of nutrient alteration in the Baltic Sea is largely inconsistent with the Redfield ratio was also noticed by Osterroht and Thomas (2000). They esti-mated the alterations of dissolved inorganic carbon (DIC), nitrate and phosphate due to new production based on the data of two cruises in the winter of 1994 and the summer 10
of 1995. They found that the produced DIC, the DIN uptake and the DIP uptake were inconsistent with Redfield ratios. Nevertheless, they presumed the N/P ratio of nutrient uptake was consistent with the Redfield ratio, and attributed the non-Redfield N/P ratio of nutrient alteration to a non-Redfield N/P mineralization of organic material. In other words, they believed that phytoplankton always takes up every 16 nitrogen elements 15
along with one phosphorus element, but some of 16 nitrogen elements can get quickly recycled, not all 16 nitrogen elements along with one phosphorus can be mineralized at same time. No matter the local N/P ratios of nutrient uptake and mineralization are consistent or not, the overall N/P ratio of nutrient altered by local biological and bio-chemical processes will not change. In this paper, we use the phrase “the N/P ratios of 20
nutrient uptake” by assuming that the local N/P ratios of nutrient uptake and mineral-ization are consistent, which refers precisely to the overall N/P ratio of nutrient altered by local biological and biochemical processes during spring bloom. Thus their obser-vations (Osterroht and Thomas, 2000) can be regarded as another evidence showing that the N/P ratio of nutrient uptake is inconsistent with the Redfield Ratio.
25
OSD
8, 1233–1259, 2011N/P ratio of nutrient uptake in the Baltic
Sea
Z. Wan et al.
Title Page
Abstract Introduction
Conclusions References
Tables Figures
◭ ◮
◭ ◮
Back Close
Full Screen / Esc
Printer-friendly Version Interactive Discussion
Discussion
P
a
per
|
Dis
cussion
P
a
per
|
Discussion
P
a
per
|
Discussio
n
P
a
per
|
calculated ratio of DO production to DIP consumption. The early approach inevitably simplified the effect from physical processes due to the limited computational power, thus the accuracy of the elemental ratios is worth being further verified. Larsson et al. (2001) analyzed the elemental composition of filamentous cyanobacteria with sam-ples at BY31 (Gotland Sea) in 1994. They found that the C:N and C:P ratios were 5
smaller than Redfield values in spring and started to rise in early June and reached 5.6 (N:C) and 420 (C:P) when the biomass reached the peak in August and early Septem-ber.
Although these studies suggested non-Redfield ratios of nutrient uptake for the spe-cific species in the spespe-cific areas, no study has been focused on selecting a suitable 10
N/P ratio for the entire Baltic Sea in all seasons. This is probably why the Redfield ratios were predominant for the biogeochemical models in the Baltic Sea (Neumann, 2000; Edelvang et al., 2005; Savchuk et al., 2008; Eilola et al., 2009).
4.2 Support from the modeling experiments
It is better to discuss the model validity before we discuss the model results. The physi-15
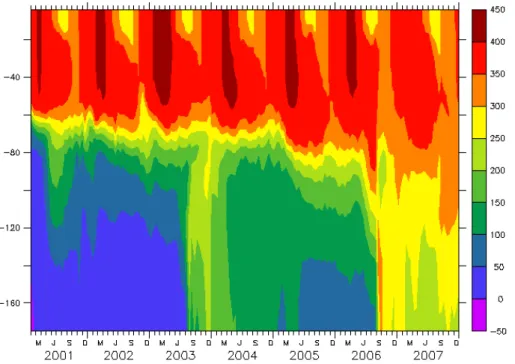
cal model is the core of the operational service system in DMI. Even the model domain covers both the Baltic Sea and the North Sea, the targeted area is the Danish Waters. Although it was satisfactorily validated with the observed data in their focused areas (She et al., 2007a, b; Larsen et al., 2007; Liu et al., 2009), the physical model has not been extensively validated outside of the Danish Waters. In this study, it is found as the 20
circulation model seems to generate unrealistic ventilations to the relatively isolated deep water occasionally. The profile of DO at Station 213 shows that the DO concen-tration has sudden increments below 100 m in August 2003 and August 2006, whereas no obvious exceptions in euphotic layers (Fig. 5). This problem causes the model DO and DIN are higher than observations in deep water. This model problem along with 25
OSD
8, 1233–1259, 2011N/P ratio of nutrient uptake in the Baltic
Sea
Z. Wan et al.
Title Page
Abstract Introduction
Conclusions References
Tables Figures
◭ ◮
◭ ◮
Back Close
Full Screen / Esc
Printer-friendly Version Interactive Discussion
Discussion
P
a
per
|
Dis
cussion
P
a
per
|
Discussion
P
a
per
|
Discussio
n
P
a
per
|
Comparing Case NP16 and Case NP10 shows that the later model results are ob-viously improved for the surface Chl-a and DIN in the Baltic Proper and for overall seasonal pattern of Chl-a and for overall vertical profiles of Chl-a and DIN. The most obvious improvement for Chl-a is the disappearance of overly shooting summer-fall peak. The most obvious improvement for DIP is the disappearance of large DIP sur-5
plus after spring bloom. The improvement for DIN is the large bias in deep layers getting smaller. These improvements can be explained in the causal chain: (1) the un-fit Redfield N/P ratio of nutrient uptake caused the surplus of DIP after spring blooms; (2) the excessive DIP stimulated the overly growth of cyanobacteria which can fix atmo-spheric nitrogen; (3) the overly fixed nitrogen resulted in too much detritus exportation 10
to deep layer.
The similar problem with Redfield ratio existed also in the previous model results with ERGOM (Neumann et al., 2002; Kuznetsov et al., 2008). In Neumann’s paper, the seasonal deviation of DIN fit well the observed data (Fig. 10 in Neumann et al., 2002), but the seasonal deviation of DIP was much smaller than the observed data 15
(Fig. 12 in Neumann et al., 2002). It means that the modeled N/P ratio of nutrient alteration was smaller than that of the observed data. The DIP surplus after spring blooms was masked by the model drawback that the modeled DIP was smaller than the observed data. In Kuznetsov’s paper (Fig. 5b and d of Kuznetsov et al., 2008), both the overshooting fall peak of Chl-aand the DIP surplus were quite similar to our model 20
results (see Fig. 4a, e, i for Chl-aand Fig. 5c, g, k for DIP.
4.3 N/P ratio of nutrient uptake in the Baltic Sea
As stated above, the N/P ratio of nutrient uptake may vary in different basins and sea-sons. Although the N/P ratio of nutrient alteration fore and after spring blooms is not identical to the N/P ratio of nutrient uptake, we may use the former as an indicator of the 25
OSD
8, 1233–1259, 2011N/P ratio of nutrient uptake in the Baltic
Sea
Z. Wan et al.
Title Page
Abstract Introduction
Conclusions References
Tables Figures
◭ ◮
◭ ◮
Back Close
Full Screen / Esc
Printer-friendly Version Interactive Discussion
Discussion
P
a
per
|
Dis
cussion
P
a
per
|
Discussion
P
a
per
|
Discussio
n
P
a
per
|
to the Redfield value in the transitional area between the Baltic Sea and the North Sea. In fall when cyanobacteria is blooming, the N/P ratio of nutrient uptake may increase up to 4 times of Redfield value (Larsson et al., 2001). The nitrogen fixation and the abundant denitrification in anoxic conditions (Shaffer and Rønner, 1984) makes it ex-tremely difficult to estimate a fixed N/P ratio of nutrient uptake suitable for the entire 5
Baltic Sea in base of observed data. The modeling experiment should be considered as a useful way for this estimate, even if the model can not be valid in resolving all observed features.
The modeling experiments show that the N/P ratio of Redfield value is improper and the problems of Redfield value can be removed through decreasing N/P ratio. 10
We think that the N/P ratio 10:1 is best suitable for the whole Baltic Sea, as more experiments than three ones presented in detail are tested. As the Baltic Proper is concerned, the suitable N/P ratio could be smaller. The phytoplankton peaks of model in summer-fall are still mostly higher than those peaks in spring in Case NP10 and the DIP surplus after spring bloom can be further removed. However, the overall DIN 15
seasonal variations are too less than observations in Case NP6 and the overall DIP tends to decrease. Thus, the most suitable N/P ratio in the Baltic Proper is regarded much smaller than 10:1 and close to 6:1. This is also based on the observed N/P ratio of nutrient alteration (Table 2).
Even if a N/P ratio of nutrient uptake universal in different basins and seasons does 20
not actually exist, a fixed value to simplify a real system helps to understand the bio-geochemical cycling and balance. In fact, many investigations are based on a fixed N/P ratio for the entire Baltic Sea. For example, Neumann et al. (2002 and 2008) simulated the response of the Baltic ecosystem to a 50 % reduction of riverine nutrient loads and the shift of nitrogen fixation on base of Redfield ratio. Eilola et al. (2009) introduced 25
OSD
8, 1233–1259, 2011N/P ratio of nutrient uptake in the Baltic
Sea
Z. Wan et al.
Title Page
Abstract Introduction
Conclusions References
Tables Figures
◭ ◮
◭ ◮
Back Close
Full Screen / Esc
Printer-friendly Version Interactive Discussion
Discussion
P
a
per
|
Dis
cussion
P
a
per
|
Discussion
P
a
per
|
Discussio
n
P
a
per
|
results of Case 3. Even those qualitative conclusions based on the Redfield ratio could be right, this study suggests their quantitative conclusions need be reexamined.
5 Summary
According to the observed N/P ratio of nutrient alteration fore and after spring blooms, a non-Redfield N/P ratio of nutrient uptake in the Baltic Sea is hypothesized. The 5
N/P ratio of nutrient uptake is estimated by using the observed nutrient alteration in combination with other literature estimates on atmospheric deposition and river load-ings. This estimate shows that the N/P ratio of nutrient uptake in the Baltic Sea is smaller than Redfield value. The modeling experiments are implemented to verify the hypothesis and to seek for a suitable N/P ratio, by using an ecosystem model ERGOM 10
coupled with the circulation model DMI-BSHcmod. The model results show that the Redfield value caused too much DIP surplus after spring blooms and the leftover DIP stimulated the overly growth of Chl-ain summer-fall and resulted in too much nitrogen fixation. These problems can be removed by decreasing the N/P ratio. The similar problems can be found in other model results using Redfield ratio in the Baltic Sea. 15
In summary, this study shows that: (1) the Redfield N/P ratio of nutrient uptake in the Baltic Sea tends to be too high; (2) a lower N/P ratio 10:1 appears to work better than the Redfield value; and (3) the N/P ratio of nutrient uptake in the Baltic Proper during spring blooms is around 6:1.
Acknowledgements. This work was supported by European Commission FP6 projects ECOOP
20
OSD
8, 1233–1259, 2011N/P ratio of nutrient uptake in the Baltic
Sea
Z. Wan et al.
Title Page
Abstract Introduction
Conclusions References
Tables Figures
◭ ◮
◭ ◮
Back Close
Full Screen / Esc
Printer-friendly Version Interactive Discussion
Discussion
P
a
per
|
Dis
cussion
P
a
per
|
Discussion
P
a
per
|
Discussio
n
P
a
per
|
References
Anderson, T. R. and Pondaven, P.: Non-redfield carbon and nitrogen cycling in the Sargasso Sea: pelagic imbalances and export flux, Deep-Sea Res. Pt. I, 50(5), 573–591, 2003. Arrigo, K. R., Robinson, D. H., Worthen, D. L., Dunbar, R. B., DiTullio, G. R., VanWoertand, M.,
and Lizotte, M. P.: Phytoplankton community structure and the drawdown of nutrients and 5
CO2in the Southern Ocean, Science, 283, 365–367, 1999.
Bergstr ¨om, S.: Development and application of a conceptual runoffmodel for Scandinavian catchments. Ph.D. Thesis., SMHI Reports RHO, No. 7, Norrk ¨oping, 1976.
Bergstr ¨om, S.: The HBV model - its structure and applications. SMHI Reports RH, No. 4, Norrk ¨oping, 1992.
10
Conkright, M. E., Locarnini, R., Garcia, H., O’Brien, T., Boyer, T. P., Stephens, C., and Antonov, J.: World ocean atlas 2001, objective analyses, data statistics and figures, CD-ROM docu-mentation, National Oceanographic Data Center, Silver Spring, MD, 2002.
Dick, S., Kleine, E., Mueller-Navarra, S., Kleine, H., and Komo, H.: The operational circulation model of BSH (BSHcmod) – model description and validation, Berichte des BSH 29/2001, 15
Bundesamt f ¨ur Seeschifffart und Hydrographie, 1–48, 2001.
Edelvang, K., Kaas, H., Erichsen, A. C., Alvarez-Berastegui1, D., Bundgaard, K., and Jørgensen, P. V.: Numerical modelling of phytoplankton biomass in coastal waters, J. Mar. Syst. 57, 13–29, 2005.
Eilola, K., Meier, H. E. M., and Almroth, E.: On the dynamics of oxygen, phosphorus and 20
cyanobacteria in the Baltic Sea: A model study, J. Mar. Syst. 75, 163–184, 2009.
Kress, N. and Herut, B.: Spatial and seasonal evolution of dissolved oxygen and nutrients in the Southern Levantine Basin (Eastern Mediterranean Sea): chemical characterization of the water masses and inferences on the N:P ratios, Deep-Sea Res. Pt. I, 48(11), 2347–2372, 2001.
25
Kuznetsov, I., Neumann, T., and Burchard, H.: Model study on the ecosystem effect of a vari-able C:N:P ratio for cyanobacteria in the Baltic Proper, Ecol. Model. 219, 107–114, 2008. Langner, J., Andersson, C., and Engardt, M.: Atmospheric input of nitrogen to the Baltic Sea
basin: present situation, variability due to meteorology and effect of climate change, Boreal Environ. Res., 14, 226–237, 2009.
30
OSD
8, 1233–1259, 2011N/P ratio of nutrient uptake in the Baltic
Sea
Z. Wan et al.
Title Page
Abstract Introduction
Conclusions References
Tables Figures
◭ ◮
◭ ◮
Back Close
Full Screen / Esc
Printer-friendly Version Interactive Discussion
Discussion
P
a
per
|
Dis
cussion
P
a
per
|
Discussion
P
a
per
|
Discussio
n
P
a
per
|
Larsson, U., Hajdu, S., Walve, J., and Elgren, R.: Baltic Sea nitrogen fixation estimated from the summer increase in upper mixed layer total nitrogen, Limnol. Oceanogr., 46(4), 811–820, 2001.
Liu, Y., Zhu, J., She, J., Zhuang, S., Fu, W., and Gao, J.: Assimilating temperature and salinity profile observations using an anisotropic recursive filter in a coastal ocean model, Ocean 5
Model. 30, 75–87, 2009.
Minster, J.-F. and Boulahdid, M.: Redfield ratios along isopycnal surfaces – a complementary study, Deep Sea Res. Pt. I, 34(12), 1981–2003, 1987.
Moore, J. K., Doney, S. C., Kleypas, J. A., Glover, D. M., and Fung, I. Y.: An intermediate complexity marine ecosystem model for the global domain, Deep-Sea Res. Pt. II, 49, 403– 10
462, 2002.
Neumann, T.: Towards a 3d-ecosystem model of the Baltic Sea, J. Mar. Syst., 25, 405–419, 2000.
Neumann, T., Fennel, W., and Kremp, C.: Experimental simulations with an ecosystem model of the Baltic Sea: a nutrient load reduction experiment, Glob. Biogeochem. Cycles 16, 7(1)– 15
7(19), 2002.
Neumann, T., Schernewski, G.: Eutrophication in the Baltic Sea and shifts in nitrogen fixation analyzed with a 3D ecosystem model, J. Mar. Syst., 74, 592–602, 2008.
Osterroht, C. and Thomas, H.: New production enhanced by nutrient supply from non-Redfield mineralisation of freshly produced organic material, J. Mar. Syst. 25, 33–46, 2000.
20
Redfield, A. C.: On the proportions of organic derivations in sea water and their relation to the composition of plankton, in: James Johnson Memorial Volume, University Press of Liverpool, edited by: Daniel, R. J., 177–192, 1934.
Savchuk, O. P.: Resolving the Baltic Sea into seven subbasins: N and P budgets for 1991– 1999. J. Mar. Syst. 56, 1–15, 2005.
25
Savchuk, O. P., Wulff, F., Hille, S., Humborg, C., and Pollehne, F.: The Baltic Sea a century ago – a reconstruction from model simulations, verified by observations, J. Mar. Syst., 74, 485–494, 2008.
Shaffer, G.: Redfield ratios, primary production, and organic carbon burial in the Baltic Sea, Deep-Sea Res., 34(5–6), 769–784, 1987.
30
Shaffer, G. and Rønner, U.: Denitrification in the Baltic proper deep water, Deep-Sea Res., 31, 197–220, 1984.
OSD
8, 1233–1259, 2011N/P ratio of nutrient uptake in the Baltic
Sea
Z. Wan et al.
Title Page
Abstract Introduction
Conclusions References
Tables Figures
◭ ◮
◭ ◮
Back Close
Full Screen / Esc
Printer-friendly Version Interactive Discussion
Discussion
P
a
per
|
Dis
cussion
P
a
per
|
Discussion
P
a
per
|
Discussio
n
P
a
per
|
Danish Straits, J. Mar. Syst. 65, 450–459, 2007a.
She, J., Høyer, J., and Larsen, J.: Assessment of sea surface temperature observational net-works in the Baltic Sea and North Sea, J. Mar. Syst. 65, 314–335, 2007b.
Stigebrandt, A. and Wulff, F.: A model for the dynamics of nutrients and oxygen in the Baltic proper, J. Mar. Res. 45, 729–759, 1987.
5
Touratier, F., Field, J. G., and Moloney, C. L.: A stoichiometric model relating growth substrate quality (C:N:P ratios) to N:P ratios in the products of heterotrophic release and excretion, Ecol. Model. 139, 265–291, 2001.
Wong, C. S., Waser, N. A. D., Nojiri, Y., Whitney, F. A., Page, J. S., and Zeng, J.: Seasonal cycles of nutrients and dissolved inorganic carbon at high and mid latitudes in the North 10
Pacific Ocean during the Skaugran cruises: determination of new production and nutrient uptake ratios, Deep-Sea Res. Pt. II, 49(24–25), 5317–5338, 2002.
Wulff, F., Rahm, L., Hallin, A.-K., Sandberg, J.: A nutrient budget model of the Baltic Sea, in: A System Analysis of the Baltic Sea, edited by: Wulff, F., Rahm, L., Arsson, P., Springer-Verlag, Berlin, 353–372, 2001.
OSD
8, 1233–1259, 2011N/P ratio of nutrient uptake in the Baltic
Sea
Z. Wan et al.
Title Page
Abstract Introduction
Conclusions References
Tables Figures
◭ ◮
◭ ◮
Back Close
Full Screen / Esc
Printer-friendly Version Interactive Discussion
Discussion
P
a
per
|
Dis
cussion
P
a
per
|
Discussion
P
a
per
|
Discussio
n
P
a
per
|
Table 1.Parameter values used but different from Neumann et al. (2002).
Parameter Value Value
This manuscript Nuemann et al. (2002)
Minimum irradiance 50 Wm−2 25 Wm−2
Ivlev constant of zooplankton 0.8 1.2
Temperature control of cyanobacteria 14◦C 16◦C
Redfield ratio (N/P) 10 16
OSD
8, 1233–1259, 2011N/P ratio of nutrient uptake in the Baltic
Sea
Z. Wan et al.
Title Page
Abstract Introduction
Conclusions References
Tables Figures
◭ ◮
◭ ◮
Back Close
Full Screen / Esc
Printer-friendly Version Interactive Discussion
Discussion
P
a
per
|
Dis
cussion
P
a
per
|
Discussion
P
a
per
|
Discussio
n
P
a
per
|
Table 2.N/P ratio of nutrient alteration fore and after Spring blooms in surface.
Latitude Longitude Fore.1DIN Fore.DIP After.1DIN After.DIP N/P ratio (◦N) (◦E) (mmol m−3) (mmol m−3) (mmol m−3) (mmol m−3)
58.28 10.51 6.76 0.51 0.32 0.04 13.7:1
56.67 12.12 6.23 0.56 0.24 0.06 12.0:1
55.88 12.75 4.83 0.56 0.24 0.16 11.6:1
55.00 14.08 3.15 0.56 0.21 0.20 8.3:1
55.25 15.98 2.95 0.65 0.23 0.26 7.0:1
57.33 20.05 3.23 0.62 0.24 0.11 6.0:1
58.88 20.32 3.73 0.65 0.09 0.09 6.5:1
63.50 19.82 6.50 0.25 0.40 0.03 21.7:1
Note 1: Fore. (After.) stands for the mean value on 1 February (1 June) in 2001∼2007.