EUROPEAN ORGANIZATION FOR NUCLEAR RESEARCH (CERN)
CERN-PH-EP/2012-316 2013/04/05
CMS-SUS-11-028
Search for supersymmetry in final states with a single
lepton, b-quark jets, and missing transverse energy in
proton-proton collisions at
√
s
=
7 TeV
The CMS Collaboration
∗Abstract
A search motivated by supersymmetric models with light top squarks is presented using proton-proton collision data recorded with the CMS detector at a center-of-mass energy of √s = 7 TeV during 2011, corresponding to an integrated luminosity of 4.98 fb−1. The analysis is based on final states with a single lepton, b-quark jets, and missing transverse energy. Standard model yields are predicted from data using two different approaches. The observed event numbers are found to be compatible with these predictions. Results are interpreted in the context of the constrained minimal supersymmetric standard model and of a simplified model with four top quarks in the final state.
Submitted to Physical Review D
c
2013 CERN for the benefit of the CMS Collaboration. CC-BY-3.0 license
∗See Appendix A for the list of collaboration members
1
1
Introduction
In this paper we describe a search for supersymmetry (SUSY) in final states with a single elec-tron or muon, multiple jets, including some identified as originating from b quarks (b jets), and missing transverse energy. The search is based on the full set of data recorded with the Com-pact Muon Solenoid (CMS) experiment in proton-proton collisions at a center-of-mass energy of√s =7 TeV during 2011, which corresponds to an integrated luminosity of 4.98±0.11 fb−1. The search for new physics phenomena in events with third-generation quarks at the Large Hadron Collider (LHC) is motivated by various extensions [1–5] of the standard model (SM). Among these, supersymmetric models are regarded as attractive, because they can resolve the hierarchy problem and may permit the unification of the electroweak and strong interactions [6–10].
Supersymmetry predicts that for each particle in the SM there exists a partner particle, often referred to as a sparticle, with identical gauge quantum numbers but with a spin that differs by 1/2. Assuming R parity conservation [11], sparticles are produced in pairs, and their decay chains terminate with the lightest supersymmetric particle (LSP). In some scenarios the LSP is the lightest neutralino (χe
0
1), a heavy, electrically neutral, weakly interacting particle, which is
a viable dark-matter candidate. In these scenarios, SUSY events are characterized by missing transverse energy in the final state.
In several SUSY scenarios, particularly motivated by naturalness of the spectrum [12, 13], top (et) or bottom (eb) squarks may be copiously produced at the LHC. This may happen by direct squark production, e.g., pp →etet
∗ → t t
e
χ01χe
0
1. If the mass of the gluino (eg) is larger than the masses of the third-generation squarks, but lighter than the squarks of the first two generations, the gluino may dominantly decay into the third-generation squarks, e.g.,eg → tet
∗ → t t
e
χ01.
Hence gluino pair production can lead to events containing four third-generation quarks, re-sulting in an excess of events with large b-jet multiplicities, which is exploited by dedicated analyses [14–20].
The decay chains of the strongly interacting particles predicted by these models result in a high level of hadronic activity, characterized by a large number of high-energy jets. In addition, isolated leptons may originate from leptonically decaying top quarks and two- or three-body decays of neutralinos and charginos.
The search is performed in signal regions defined using the scalar sum of the jet transverse momenta HT, the missing transverse energy E/ , and the b-jet multiplicity. The dominant SMT
background processes contributing to the search topology are top-quark pair (tt) production and inclusive W-boson production in association with energetic jets (W+jets). Smaller con-tributions are due to single-top production, QCD multijet events (QCD), and Drell-Yan (DY) production and decay to lepton pairs in which one lepton goes undetected. While simulation provides a good description of these contributions, more reliable estimates of the backgrounds can be obtained from data.
To evaluate the SM background, two complementary data-based approaches are used. In the first approach, templates for the E/ spectra in WT −+jets, W++jets, and tt production are
ex-tracted from the inclusive single-lepton sample by a simultaneous fit to the 0, 1, and≥2 b-jet subsamples. This fit involves the convolution of a model for the true E/ distribution with detec-T
tor effects determined using data in control regions at low HT. Predictions in several signal
re-gions defined by different selections on HT, E/ , and for 0, 1, andT ≥2 identified b jets are obtained
by applying the templates at high values of HT after normalization in background-dominated
2 3 Event Samples
of background events in a subsample with high HT and YMET, where YMET = E/ /T
√
HT is an
approximate measure of the E/ significance. Since HT Tand YMETare only weakly correlated, the
estimate can be obtained using a factorization approach based on three background-dominated control regions and can be calculated independently for different b-jet multiplicities. There-fore, it naturally provides an estimate for a selection with≥3 identified b-jets, yielding a better signal-to-noise ratio for SUSY models with many (at least 3) b jets. The use of a background estimation technique based on data reduces the uncertainty on the prediction by more than a factor of two. While both methods use the HTand E/ variables, they have only a small overlapT
in their control and signal regions, both in the SM and in the signal scenarios, and are therefore complementary.
The analyses presented here are not limited to a particular theory. However, the constrained minimal supersymmetric extension of the standard model (CMSSM) [21, 22] is chosen as a benchmark to illustrate the sensitivity of this search for new-physics processes. The template method in the 0, 1, and≥2 b-jet subsamples shows the best sensitivity in the parameter plane of this model. A scenario involving four top quarks in the final state is used as the second bench-mark. It is implemented as a scenario in the context of simplified model spectra (SMS) [23–25]. The factorization method with the≥3 b-jet subsample is best suited for this topology.
A brief description of the CMS detector is given in Section 2. The datasets and simulated event samples used in this search are discussed in Section 3. In Section 4 the preselection of physics objects and events is outlined. The E/ template and factorization methods are described inT
Sections 5 and 6, respectively. Results are presented in Section 7 and interpreted in Section 8. Finally a summary is given in Section 9.
2
The CMS Detector
The CMS detector is a multipurpose apparatus designed to allow the study of high transverse momentum (pT) processes in proton-proton collisions, as well as a broad range of phenomena
in heavy-ion collisions. The CMS coordinate system is defined with the origin at the center of the detector and the z axis along the counterclockwise beam direction, with φ the azimuthal angle (measured in radians), θ the polar angle, and η= −ln[tan(θ/2)]the pseudorapidity.
The central feature of the detector is a superconducting solenoid, 13 m in length and 6 m in diameter, which provides an axial magnetic field of 3.8 T. Within the magnet are the silicon pixel and strip detectors for charged-particle tracking, a lead-tungstate crystal electromagnetic calorimeter for measurements of photons, electrons, and the electromagnetic component of jets, and a hadron calorimeter, constructed from scintillating tiles and brass absorbers, for jet energy measurements. The tracker covers the region|η| <2.5 and the calorimeters|η| <3.0. A
quartz-steel forward calorimeter using Cherenkov radiation extends the coverage to |η| ≤ 5. The
detector is nearly hermetic, allowing for energy-balance measurements in the plane transverse to the beam direction. Outside the magnet is the muon system, comprising drift-tube, cathode-strip, and resistive-plate detectors, all interleaved with steel absorbers acting as a magnetic flux return. A detailed description of the CMS detector can be found elsewhere [26].
3
Event Samples
The events are selected with triggers requiring the presence of a muon or electron with large transverse momentum pTin association with significant hadronic activity, quantified by HTtrigger,
3
/
HTtrigger, the magnitude of the vectorial sum of the transverse momenta of jets, was added. In order not to exceed the maximum possible rate of data acquisition and processing, trigger thresholds were raised with increasing LHC luminosity, resulting in a threshold for the muon transverse momentum pT from 8 GeV to 15 GeV, and for electrons from 10 GeV to 15 GeV. The
requirement on the hadronic activity was raised from HTtrigger >200 GeV to HTtrigger >300 GeV in the muon and to HTtrigger >250 GeV in the electron channel. The requirement on /HTtriggerwas introduced with a threshold of 20 GeV that was later raised to 40 GeV.
Simulated event samples are produced using different event generators and the GEANT4 pack-age [27] for detector simulation, except for the scans of CMSSM and SMS parameter space discussed below. The production and decay of tt pairs or vector bosons in association with energetic jets are generated using the MADGRAPH5.1.1 [28] generator. The produced parton events are then passed to thePYTHIA6.4.24 [29] program with tune Z2 [30] for simulating par-ton showers, multiple interactions, and fragmentation processes. The decay of τ leppar-tons is simulated using the TAUOLA27.121.5 [31] program. The production and decay of single top quarks and antiquarks are simulated with the POWHEG 301 [32, 33] and TAUOLA generators interfaced toPYTHIA. Multijet QCD production is simulated withPYTHIA.
Mass spectra and branching fractions of SUSY particles are calculated at the electroweak scale using the renormalization equations implemented in the SOFTSUSY package [34], interfaced to PYTHIA. Two low-mass scenarios [35] are used as CMSSM benchmark points to illustrate possible yields: the first one is referred to as LM6 (m0 = 85 GeV, m1/2 = 400 GeV, A0 =0 GeV,
tan β = 10, µ > 0), and the second one as LM8 (m0 = 500 GeV, m1/2 = 300 GeV, A0 =
−300 GeV, tan β=10, µ>0). In other event topologies these points have been experimentally excluded [14, 15, 36].
A scan in the CMSSM parameter space is performed for a fixed set of parameters: A0, tan β,
and sign µ, where a grid in the m0- m1/2 plane is defined by variation of m0and m1/2in steps
of 20 GeV. For each point, 10 000 pp events are generated.
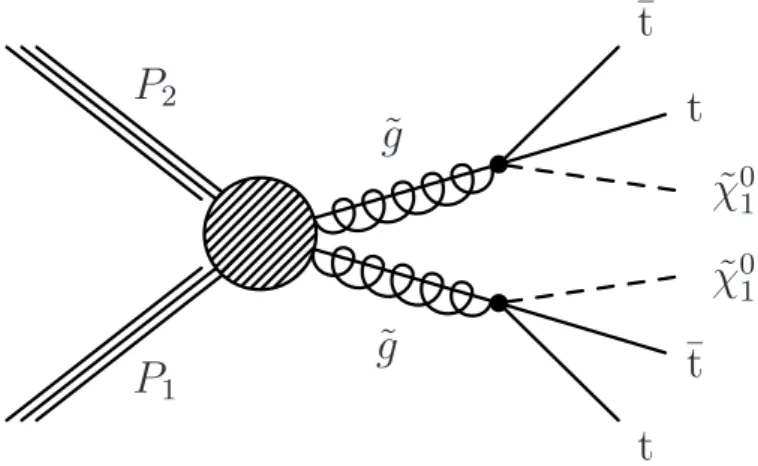
In addition, the results are interpreted in the context of the simplified model shown in Fig. 1. It contains the pair production of gluinos, which subsequently decay with branching fraction B(eg → tt+χe01) = 1. For each point on a 25 GeV×25 GeV grid in the parameter plane of the
gluino andχe
0
1 masses, 50 000 events are simulated. The events in the CMSSM and SMS scans
are generated using a fast detector simulation [37] rather than the GEANT4 package.
P
1P
2˜
g
˜
g
t
¯t
˜
χ
01˜
χ
0 1t
¯t
4 4 Event Selection
4
Event Selection
The primary vertex must satisfy a set of quality requirements, including the restriction that the longitudinal and transverse distances of the primary vertex from the nominal interaction point be less than 24 cm and 2 cm, respectively.
Muon candidates [38] are required to have pT(µ) > 20 GeV and|η| < 2.1. The reconstructed
track of a muon candidate must have an impact parameter less than 0.02 cm in the trans-verse plane and less than 1.0 cm along the beam axis, where the impact parameter is the distance of the track trajectory to the primary vertex at the point of closest approach in the transverse plane. To suppress background contributions from muons originating from heavy-flavor quark decays, the muon is required to be isolated within a cone of size∆R = 0.3, with ∆R = p(∆η)2+ (∆φ)2. The relative combined isolation of the muon is defined as Icomb
rel =
∑∆R<0.3(ET+ pT)/pT(µ), where the sum is over the transverse energy ET (as measured in
the electromagnetic and hadron calorimeters) and the transverse momentum pT(as measured
in the silicon tracker) of all reconstructed objects within this cone, excluding the track itself. Muons are required to satisfy Icomb
rel <0.1.
Electron candidates [39] are restricted to pT > 20 GeV and |η| < 2.4, excluding the
barrel-endcap transition region (1.44 < |η| <1.57). The reconstructed track of an electron candidate
must fulfill the same impact parameter requirements as the muon tracks described above, as well as a set of quality and photon-conversion rejection criteria. The relative combined isolation variable, similar to that defined in the muon case, must satisfy Irelcomb<0.07 in the barrel region and Irelcomb <0.06 in the endcaps.
Exactly one selected muon or electron is required to be present in the event. Events with a second lepton passing looser selection criteria are rejected.
The reconstruction of jets is based on the CMS particle-flow algorithm [40], which identifies and reconstructs charged hadrons, electrons, muons, photons, and neutral hadrons. Extra energy clustered into jets due to additional, simultaneous pp collisions (“pileup”) is taken into account with an event-by-event correction to the jet four-vectors [41]. Therefore, the pileup does not have a strong influence on this analysis. Jets are reconstructed from particle-flow candidates using the anti-kTclustering algorithm [42] with distance parameter 0.5. Corrections are applied
on the raw jet energy to obtain a uniform response across the detector in η and an absolute calibrated response in pT [43]. Each event is required to contain at least three jets with pT >
40 GeV and|η| <2.4 that are spatially separated from a selected muon or electron by∆R>0.3
and that satisfy quality criteria in order to suppress noise and spurious calorimeter energy deposits.
The identification of b jets (“b-tagging”) [44] is performed with two complementary approaches. In the first approach, the distance between a reconstructed secondary vertex with two or more associated tracks and the primary interaction point, normalized to its uncertainty, is used (sim-ple secondary-vertex algorithm). This algorithm has been shown to be particularly robust against variation in the running conditions and is used for the template method. In the sec-ond approach, jets are tagged as b jets if they have at least two tracks with an impact parameter divided by its uncertainty that is greater than 3.3 (track counting algorithm). This algorithm is highly efficient at high jet pTand is used for the factorization method. At the chosen operating
points, the efficiency to tag b jets is approximately 60 to 70%, with a misidentification rate for light-quark- or gluon-initiated jets of a few percent. The b-tagging efficiencies and mistagging rates (the efficiency of tagging a c-quark jet, light-quark jet, or gluon jet as b jet) have been measured up to jet pTof 670 GeV for both methods.
5
The missing transverse energy E/ is reconstructed as the magnitude of the sum of the transverseT
momentum vectors of all particle-flow objects with|η| <4.7. The quantity HT, a measure of the
total hadronic activity, is calculated as the sum of the transverse momenta of all jets passing the selection. Since SUSY models predict events with large hadronic activity and large amounts of missing energy, the final search regions for the two methods are defined by stringent selections on HTand E/ and by the number of identified b jets, as described in the following two sections.T
These selection steps define a sample that matches the trigger requirements and the expected characteristics of signal events, while retaining a sufficient number of events to allow evalua-tion of the background.
The trigger and lepton-reconstruction efficiencies are measured from data. The determination of the trigger efficiency is performed separately for each component of the trigger: the leptonic, the HTtrigger, and the /HTtrigger selection. The leptonic trigger selection is found to be 97–98% efficient after the offline requirements, for all running periods. The HtriggerT requirement, and the /HtriggerT >20 GeV trigger requirement used for the first part of the running period, are both more than 99% efficient. The /HTtrigger >40 GeV requirement used for latter part of the running period is around 80% efficient for E/ values of 60 GeV, becoming fully efficient for ET /T>80 GeV.
The offline lepton reconstruction, identification, and isolation efficiencies are measured with a ”tag-and-probe” method [45], using dileptons with invariant mass close to the Z peak. The measured efficiencies have been compared to simulation as a function of pT, η, and the number
of reconstructed primary vertices and jets in the event. The total lepton efficiency in data is described by simulation to a relative accuracy within 3%.
5
The
E
/
TTemplate Method
For the E/ template method, we consider overlapping signal regions with lower boundaries inT
HT at 750 GeV or 1000 GeV, and with lower boundaries in E/ at 250 GeV, 350 GeV, and 450 GeVT
as shown in Fig. 2. All signal regions are restricted to HT < 2.5 TeV and E/T < 2 TeV since
the uncertainties for the prediction increase for very high values of these variables while the additional signal yield is small. In the E/ template approach, parameters of a model for the trueT
E/ spectrum are obtained from a fit to a control region in data defined by 350T < HT <700 GeV
and 100< E/T<400 GeV. Separate E/ models are used for the dominant background processes:T
W−+jets, W++jets, and tt production. The absolute scale for the prediction is obtained from a normalization region defined by 750 < HT < 2500 GeV and 100 < E/T < 250 GeV. Figure 3
shows the difference in the E/ distributions of the simulated background and the two referenceT
SUSY signals LM6 and LM8 in the muon channel at low and high HT. The E/ shape used for theT
predictions in the signal regions is obtained from data and does not depend on the simulated distribution. Control and normalization regions have been chosen to provide a sufficiently large range in E/ for the fit and to limit signal contamination. The method provides backgroundT
estimates for events with 0, 1, and≥2 identified b jets in a natural way.
5.1 Discrimination of W from tt using b-jet identification
In order to gain sensitivity to the differences between the E/ shapes in W+jets and tt events, weT
divide the preselected sample into three bins of b-jet multiplicity, corresponding to different relative proportions of tt and W+jets events. Simulation predicts the 0 b-tag bin to contain 76% W+jets and 19% tt events, while the≥2 b-tag bin is dominated by tt events (3% W+jets versus 90% tt events). The 1 b-tag bin shows intermediate values (20% W+jets versus 72% tt events).
6 5 TheE/TTemplate Method E [GeV] H [ GeV ] T 100 350 700 750 250 normalization region 350 450 1000 T control region signal regions
Figure 2: Graphical representation of the different regions in HT vs. E/ space used in theT
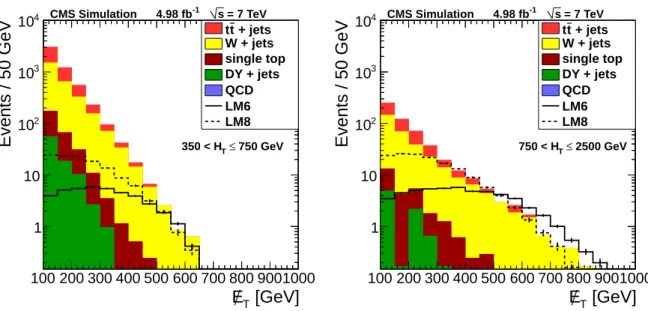
E/ method.T [GeV] T E 100 200 300 400 500 600 700 800 9001000 Events / 50 GeV 1 10 2 10 3 10 4 10 + jets t t W + jets single top DY + jets QCD LM6 LM8 750 GeV ≤ T 350 < H CMS Simulation 4.98 fb-1 s = 7 TeV [GeV] T E 100 200 300 400 500 600 700 800 9001000 Events / 50 GeV 1 10 2 10 3 10 4 10 + jets t t W + jets single top DY + jets QCD LM6 LM8 2500 GeV ≤ T 750 < H CMS Simulation 4.98 fb-1 s = 7 TeV
Figure 3: Distribution of E/ in the muon channel: simulation of backgrounds and two referenceT
SUSY signals (LM6 and LM8) for (left) 350< HT <750 GeV and (right) 750< HT <2500 GeV.
5.2 TheE/T model 7
The ratio of W++jets to W−+jets in the sample is predicted to be approximately 3.
The relative fraction of W+jets and tt events is estimated from data using a template fit for the event fractions in the three b-jet multiplicity bins. The templates are extracted from simulation and corrected for the measured differences in b-quark and light-flavor tagging probabilities between data and simulation.
The evolution of the ratios in the 0 b-tag and 1 b-tag bins as a function of HTis obtained by
di-viding the HTdistributions of W+jets and tt events, weighted according to the global
W+jets-to-tt ratio in these bins obtained as described above. The HTdistribution for tt events is extracted
from the≥2 b-tag bin. The corresponding shape for W+jets events is obtained by subtracting the tt contribution from the 0 b-tag bin according to the measured tt fraction in this bin. The ratios measured in the data exhibit no significant trend with HT.
5.2 TheE/T model
In the region well above the W mass, namely E/T > 100 GeV, the true E/ spectra of the leadingT
backgrounds are characterized by nearly exponential falling shapes. Small differences can be observed as functions of the production process, W polarization, and rapidity distributions. The functional form x exp(−αxβ) with β = 0.5 provides a satisfactory parametrization of
the inclusive distributions within each category (tt, W++jets, and W−+jets). The shapes for W++jets and W−+jets are distinguished from each other using the lepton charge, and sepa-rate models are used for the two lepton flavors in order to take into account differences in the acceptance.
The selection in HT leads to a clear bias in the E/ distribution due to the correlation betweenT
the transverse momentum of the W boson and the hadronic activity balancing this momentum. The shape of the ratio of the E/ spectrum after a selection in HT Tto the inclusive spectrum can
be well described by error functions, erf(x; b, c), with two free parameters: the E/ value whereT
the ratio reaches 50%, denoted b, and the width, denoted c. The evolution of the parameters b and c can be approximated well by linear functions of HT: b(HT) = b0+b1HT and c(HT) =
c0+c1HT. The values for b0, b1, c0, and c1 are obtained from simulation and verified with
data. A second-order polynomial is used as an alternative parametrization in order to assign a systematic uncertainty to the residual non-linearity.
The full E/ model for a final-state category (WT ++jets, W−+jets, or tt) in a single HT bin i with
lower and upper limits HT,iand HT,i+1has the form
Mi(x) ∼x exp(−αx0.5)×
(1+erf(x ; b0+b1HT,i, c0+c1HT,i))×
(1−erf(x ; b0+b1HT,i+1, c0+c1HT,i+1)).
(1)
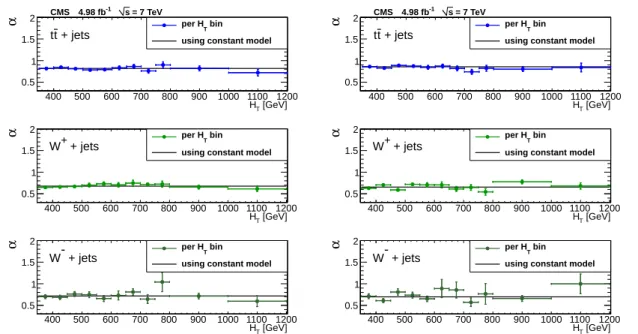
The categories are combined with the weights described above. The results of fits to the pa-rameter α in bins of HT after constraining the parameters b and c to linear functions are shown
in Fig. 4. They show no significant trend, and a single value is used for each category in the final estimate.
As the model for the true E/ spectrum is empirical, systematic uncertainties due to the choiceT
of the model have been evaluated by varying the parameter β in the exponential form; the parameters b and c of the error function; and the evolution of α, b, and c with HT. Details are
given in Section 5.5.
8 5 TheE/TTemplate Method [GeV] T H 400 500 600 700 800 900 1000 1100 1200 α 0.5 1 1.5 2 + jets t t bin T per H
using constant model CMS 4.98 fb-1 s = 7 TeV [GeV] T H 400 500 600 700 800 900 1000 1100 1200 α 0.5 1 1.5 2 + jets + W bin T per H
using constant model
[GeV] T H 400 500 600 700 800 900 1000 1100 1200 α 0.5 1 1.5 2 + jets -W bin T per H
using constant model
[GeV] T H 400 500 600 700 800 900 1000 1100 1200 α 0.5 1 1.5 2 + jets t t bin T per H
using constant model CMS 4.98 fb-1 s = 7 TeV [GeV] T H 400 500 600 700 800 900 1000 1100 1200 α 0.5 1 1.5 2 + jets + W bin T per H
using constant model
[GeV] T H 400 500 600 700 800 900 1000 1100 1200 α 0.5 1 1.5 2 + jets -W bin T per H
using constant model
Figure 4: The fitted parameter α as a function of HT for three subsamples of the (left) muon
and (right) electron channel: from top to bottom tt, W++jets, and W−+jets are shown. For the parameters of the error functions a linear dependence on HTis imposed. The points show the
values of α obtained for individual bins in HT. The solid lines correspond to fits to constant
values of α in the control regions.
(“smeared”) to account for the finite detector resolution. The resolution depends on the hadronic activity and on the time-dependent running conditions. The response function for this E/T
smearing can be obtained from QCD multijet events, which do not have a significant amount of true E/ [46]. A sample dominated by these events is selected using a set of triggers based onlyT
on HT, and the response functions are extracted in bins of HT, jet multiplicity, and b-jet
multi-plicity. In each HTbin the shapes for different jet multiplicities are then combined according to
the multiplicity distribution observed in the single-lepton dataset.
The convolution of the true E/ distribution with the response functions described above as-T
sumes that the contribution to E/ from missing particles is uncorrelated in direction with theT
E/ contribution arising from jet mismeasurements. Simulation indicates that the correlationT
coefficient between these two contributions is only 0.13, and ancillary studies confirm that the uncertainty on the prediction incurred by ignoring the correlation is negligible.
5.3 Estimation of the E/T spectrum from data
The full E/ model described in the previous subsections is used in a simultaneous fit to HT Tbins
in the subsamples defined by the three b-jet multiplicities, the two lepton flavors, and the two charges. The bin sizes in HTare chosen to ensure adequate data in each bin. The parameters α
resulting from the fits to data and to simulation are summarized in Table 1.
The predictions for each of the signal regions are obtained by integrating the E/ model in binsT
of HT. In each HT bin the E/ distribution is normalized to the observed number of events atT
100< E/T < 250 GeV. The final estimate is obtained by summing over all HT bins. The
statis-tical uncertainty on the prediction for each signal region is evaluated by pseudo-experiments, repeating the prediction with values for α in the different categories sampled according to the central value and covariance matrix provided by the fit.
5.4 Experimental systematic uncertainties 9
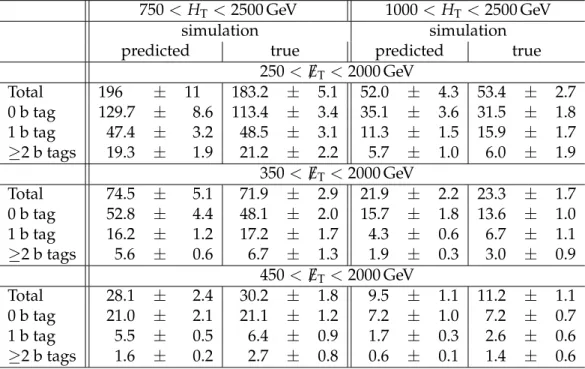
In Table 2 the predictions of the fit of the E/ model to simulated events are compared to theT
true values for regions defined by lower limits of 750 GeV and 1000 GeV on HT, and of 250, 350,
and 450 GeV on E/ . Good agreement is observed. The results from data are summarized inT
Section 7.
Table 1: Fit results for the parameter α from the control regions in data and simulation. The quoted uncertainties are statistical.
W++jets W−+jets tt
µ data 0.676±0.014 0.717±0.024 0.818±0.014
simulation 0.641±0.019 0.709±0.024 0.819±0.013 e data 0.655±0.015 0.697±0.026 0.857±0.016 simulation 0.651±0.013 0.736±0.025 0.806±0.013
Table 2: Predicted and true event counts in simulation for different signal regions. Uncertainties are statistical.
750< HT <2500 GeV 1000< HT<2500 GeV
simulation simulation
predicted true predicted true
250<E/T<2000 GeV Total 196 ± 11 183.2 ± 5.1 52.0 ± 4.3 53.4 ± 2.7 0 b tag 129.7 ± 8.6 113.4 ± 3.4 35.1 ± 3.6 31.5 ± 1.8 1 b tag 47.4 ± 3.2 48.5 ± 3.1 11.3 ± 1.5 15.9 ± 1.7 ≥2 b tags 19.3 ± 1.9 21.2 ± 2.2 5.7 ± 1.0 6.0 ± 1.9 350<E/T<2000 GeV Total 74.5 ± 5.1 71.9 ± 2.9 21.9 ± 2.2 23.3 ± 1.7 0 b tag 52.8 ± 4.4 48.1 ± 2.0 15.7 ± 1.8 13.6 ± 1.0 1 b tag 16.2 ± 1.2 17.2 ± 1.7 4.3 ± 0.6 6.7 ± 1.1 ≥2 b tags 5.6 ± 0.6 6.7 ± 1.3 1.9 ± 0.3 3.0 ± 0.9 450<E/T<2000 GeV Total 28.1 ± 2.4 30.2 ± 1.8 9.5 ± 1.1 11.2 ± 1.1 0 b tag 21.0 ± 2.1 21.1 ± 1.2 7.2 ± 1.0 7.2 ± 0.7 1 b tag 5.5 ± 0.5 6.4 ± 0.9 1.7 ± 0.3 2.6 ± 0.6 ≥2 b tags 1.6 ± 0.2 2.7 ± 0.8 0.6 ± 0.1 1.4 ± 0.6
5.4 Experimental systematic uncertainties
The results can be affected by systematic uncertainties, which arise from detector effects, as-sumptions made about the shape of the distribution, theoretical uncertainties, and the con-tamination due to other backgrounds. The impact of these uncertainties on the prediction can be quantified by a relative variation defined as δρ = (Npred0 /Ntrue0 )/(Npred/Ntrue) −1 where
Npred (Ntrue) is the predicted (true) number of events and the prime denotes the values with
the systematic effect included. For those uncertainties that only affect the estimation proce-dure but not the true number of events in the signal region, this amounts to the relative change in the prediction. For all other sources, δρ determines the variation in closure estimated with simulation, i.e., how well the prediction follows the change of events in the signal region. Miscalibration of the jet energy scale (JES) leads to a modification of the true number of events in the signal region but is compensated to a large extent by a corresponding change in the pre-dicted number of events. The effect due to the uncertainty on the JES is determined by shifting
10 5 TheE/TTemplate Method
the energy of jets with pT > 10 GeV and|η| < 4.7 in simulated events up and down
accord-ing to pT- and η-dependent uncertainties that have been measured using dijet and γ/Z+jets
events [43]. The applied shifts, which are 1–3% for jets with pT > 40 GeV and |η| < 2.0 and
increase towards lower pT and higher|η|, are propagated to the E/ result. The uncertainty onT
the energy of jets with pT < 10 GeV, referred to as unclustered energy, is assumed to be 10%.
This uncertainty is also propagated to the E/ result assuming full correlation with the JES un-T
certainty. For the muon channel and a signal region inclusive in b-jet multiplicity and defined by HT > 1000 GeV and E/T > 250 GeV, the variations are+14% and−30%, respectively, while
the systematic uncertainty δρ is 6%.
Lepton efficiencies are expected to have a small impact on the background prediction, because an overall change of scale is compensated by a corresponding change in the normalization regions, and the preselection cuts have been chosen to use only kinematic regions with stable trigger and reconstruction efficiencies. Therefore only small changes are expected in the ratios of yields between the signal and the normalization regions. In order to test the impact of a possible non-uniformity, the lepton efficiencies are lowered by 5% in the endcap regions and by a linear variation of−20% to 0% in the low pT range of 20 to 40 GeV, where any residual effect of the efficiency in the threshold region would have the highest impact.
Over the course of the data collection period, the maximum instantaneous luminosity per bunch crossing and, hence, the average number of simultaneous collisions, changed dramati-cally. Simulated events are matched to the pileup conditions observed in data using the dis-tribution of the number of reconstructed primary vertices, and the simulation provides a satis-factory description of the dependence of several key observables as a function of the number of simultaneous collisions. Possible residual effects are tested by varying the event weight ac-cording to the reconstructed number of primary vertices nvtxby±5%× (nvtx− hnvtxi)around
the mean numberhnvtxi =7.
Differences between the efficiencies to tag b-quark, c-quark, and light-flavor jets in data and simulation are taken into account by applying pT- and η-dependent scale factors to the
simu-lated events. These scale factors are measured in data using QCD multijet event samples with uncertainties on the order of a few percent [44]. Variations in the efficiency and purity of the b-jet identification would move events among the three b-tag multiplicity bins and change the fractions of W+jets and tt events in each bin. The size of this effect is estimated by varying ef-ficiencies and mistagging rates within the uncertainties. As expected, the determination of the fractions based on fits to the b-jet multiplicity compensates for these changes and the residual effects are small.
5.5 Model-related systematic uncertainties for theE/T templates method
The background estimation procedure is designed to provide individual estimates of the E/T
distribution of each of the leading backgrounds: tt, W++jets, and W−+jets. The accuracy of the separation between tt and W+jets events is tested by varying the tt and W+jets cross sections individually by one third. Moreover, the sensitivity of the fit results to the b-jet multiplicity dis-tribution is estimated by varying the resulting ratio of W+jets to tt events by its uncertainty. The corresponding effect is small. The impact of other background sources, in particular of the con-tribution from dilepton events, is tested by varying the amount of all non-leading backgrounds by±50%.
The uncertainty on the E/ model is tested by varying the β parameter byT ±10% with respect
to its nominal value of 0.5. This variation is motivated by the uncertainty from fitting β in single-lepton events with two jets. As shown in Fig. 4, the parameter α shows no significant
5.5 Model-related systematic uncertainties for theE/T templates method 11
dependence on HT. The uncertainty on this assumption is quantified by imposing a slope
according to the uncertainties of the linear fits as a function of HTin the control region. These
two model-related effects constitute the dominant systematic uncertainties in the background estimation. For the parameters of the error functions b and c, 16 independent variations are considered in the eigenbasis of the parameters of the linear functions describing the evolution in HT, and the model describing this evolution is changed from linear to quadratic. The effect
of these variations is rather small, since the prediction for any signal region is a sum of many HT bins, and the variations of the error function parameters tend to cancel each other.
An additional source of uncertainty is due to the W polarization, which would alter the E/T
distribution for a given momentum of the W boson. In order to quantify this uncertainty we modify the generator-level polarization distributions in bins of lepton pTand rapidity
accord-ing to varied scenarios. The fit is performed for each of the modified datasets, and the highest
δρis then assigned as a systematic uncertainty.
The systematic uncertainties for the signal region defined by HT >1000 GeV and E/T>250 GeV
are presented in Tables 3 and 4. Table 3 contains all contributions that are not directly related to b-jet identification. They have been evaluated in a W+jets and a tt dominated subsample, defined as events without or with at least one identified b jet, respectively. Table 4 lists the b-tagging related systematic effects in the three b-jet multiplicity bins.
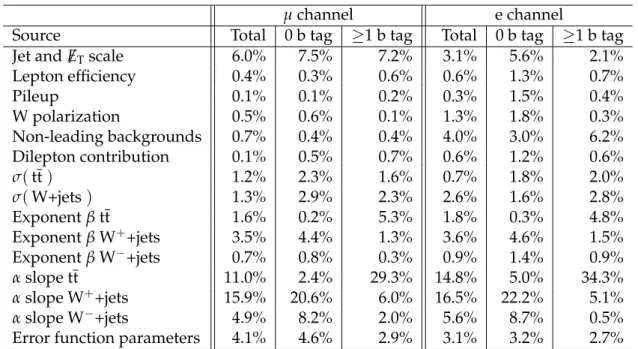
Table 3: Relative systematic uncertainties (δρ) not directly related to b tagging for the back-ground estimation in the signal region 1000< HT<2500 GeV and 250<E/T <2000 GeV.
µchannel e channel
Source Total 0 b tag ≥1 b tag Total 0 b tag ≥1 b tag
Jet and E/ scaleT 6.0% 7.5% 7.2% 3.1% 5.6% 2.1%
Lepton efficiency 0.4% 0.3% 0.6% 0.6% 1.3% 0.7% Pileup 0.1% 0.1% 0.2% 0.3% 1.5% 0.4% W polarization 0.5% 0.6% 0.1% 1.3% 1.8% 0.3% Non-leading backgrounds 0.7% 0.4% 0.4% 4.0% 3.0% 6.2% Dilepton contribution 0.1% 0.5% 0.7% 0.6% 1.2% 0.6% σ(tt) 1.2% 2.3% 1.6% 0.7% 1.8% 2.0% σ(W+jets) 1.3% 2.9% 2.3% 2.6% 1.6% 2.8% Exponent β tt 1.6% 0.2% 5.3% 1.8% 0.3% 4.8% Exponent β W++jets 3.5% 4.4% 1.3% 3.6% 4.6% 1.5% Exponent β W−+jets 0.7% 0.8% 0.3% 0.9% 1.4% 0.9% αslope tt 11.0% 2.4% 29.3% 14.8% 5.0% 34.3% αslope W++jets 15.9% 20.6% 6.0% 16.5% 22.2% 5.1% αslope W−+jets 4.9% 8.2% 2.0% 5.6% 8.7% 0.5%
Error function parameters 4.1% 4.6% 2.9% 3.1% 3.2% 2.7% In simulated event samples, the background estimation procedure produces results that are compatible with the simulated rates. Conservatively, a systematic uncertainty using the maxi-mum of the statistical uncertainty of this comparison and of the absolute value of the deviation is assigned. For the signal region mentioned above, this amounts to 5.9%. We also evaluate the effect of possible differences in the E/ distributions between the different b-tag bins. In orderT
to test the sensitivity to possible deviations in the low-HT control region used for the fit, we
have evaluated the relative variations in the predictions for the 1 b-tag (≥2 b-tag) bin in data by repeating the fit without the ≥2 b-tag (1 b-tag) bin. The uncertainty in the ≥1 b-tag bin was set to the average of the variations in the 1 b-tag and≥2 b-tag bins. For the signal region mentioned above, the uncertainties are 2.0%, 4.2%, and 8.5% for the 1 b-tag,≥1 b-tag, and≥2
12 6 The Factorization Method
Table 4: Relative systematic uncertainties related to b tagging in the signal region 1000< HT <
2500 GeV and 250< E/T<2000 GeV.
Source Total 0 b tag 1 b tag ≥1 b tag ≥2 b tags
µchannel W+jets/tt ratio 2.9% 2.1% 6.1% 4.8% 2.4% b-tagging efficiency 2.0% 1.5% 2.2% 1.3% 5.1% Mistagging rate 0.4% 0.4% 0.7% 0.9% 0.6% e channel W+jets/tt ratio 1.1% 2.4% 2.6% 2.3% 2.3% b-tagging efficiency 2.2% 1.6% 0.8% 1.7% 3.6% Mistagging rate 0.3% 0.4% 0.4% 0.2% 0.1%
b-tag bins, respectively.
6
The Factorization Method
[GeV] T H 0 200 400 600 800 1000 1200 1400 1600 1800 2000 Events / 50 GeV -1 10 1 10 2 10 3 10 4 10 5 10 Data + jets t t W + jets QCD DY + jets single top LM6 LM8 = 7 TeV s , -1 CMS, 4.98 fb [GeV] T H 0 200 400 600 800 1000 1200 1400 1600 1800 2000 Data/Simulation 0 0.5 1 1.5 2 ] GeV [ MET Y 0 2 4 6 8 10 12 14 16 18 GeV Events / -1 10 1 10 2 10 3 10 4 10 5 10 Data + jets t t W + jets QCD DY + jets single top LM6 LM8 = 7 TeV s , -1 CMS, 4.98 fb ] GeV [ MET Y 0 2 4 6 8 10 12 14 16 18 Data/Simulation 0 0.5 1 1.5 2
Figure 5: Distributions of (left) HT and (right) YMET for data compared to the different SM
processes. The muon and electron channels are combined and at least one b tag is required. The CMS data are represented by solid points and the simulated SM events by stacked his-tograms. The two lines represent possible signal scenarios. The simulation is normalized to the integrated luminosity of the data sample.
The factorization method is based on the variables HT and YMET, which are shown for the
inclusive 1 b-tag selection for data and simulated SM events in Fig. 5. The SM simulation lies systematically above the data, showing the need for background estimation from data. Since HTand YMETare nearly uncorrelated for tt production, which constitutes the main background
in events with at least one b jet, a factorization ansatz in the YMET–HT plane can be used to
estimate the background contribution, namely from control regions with low HTand/or YMET.
For the factorization method, a minimum of HT > 375 GeV and E/T > 60 GeV is required
13
background events in the signal region, it is essential to have enough events in the control regions. Therefore, the definition of the signal region depends on the number of required b tags. The analysis is performed, and results are presented, in three channels according to the number of b tags: 1, 2, and≥3 b tags, selected with the track-counting algorithm. In addition we study the 0 b-tag bin for cross checks and use a combined≥1 b-tags bin for limit setting in the CMSSM case. The signal region is defined as HT > 800 GeV and YMET > 5.5
√
GeV for the 1, the 2, and the combined ≥1 b-tag bins, and HT > 600 GeV and YMET > 6.5
√
GeV for the 0 and≥3 b-tag bins. These regions are optimized to balance two opposing requirements: a small background contribution to the signal region but nonetheless enough background events in the three control regions that the statistical uncertainties on the background predictions are small. The signal region is populated with events described by the tails of SM distributions and mis-measurement related to the finite detector resolution. The control regions (A, B, and C) and the
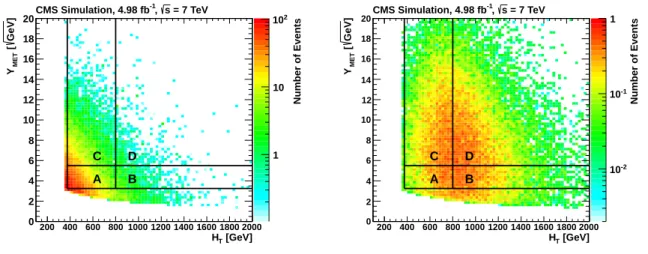
Number of Events 1 10 2 10 [GeV] T H 200 400 600 800 1000 1200 1400 1600 1800 2000 ] GeV [ MET Y 0 2 4 6 8 10 12 14 16 18 20 , s = 7 TeV -1 CMS Simulation, 4.98 fb A B C D Number of Events -2 10 -1 10 1 [GeV] T H 200 400 600 800 1000 1200 1400 1600 1800 2000 ] GeV [ MET Y 0 2 4 6 8 10 12 14 16 18 20 , s = 7 TeV -1 CMS Simulation, 4.98 fb A B C D
Figure 6: Distributions of YMETvs. HT for (left) the SM background and (right) the SUSY LM8
scenario. The muon and electron channels are combined and at least one b tag is required. signal region (D) used for the factorization method with HTand YMETare defined in Table 5.
Table 5: Definition of the different regions used for the factorization method with HTand YMET.
Two sets of selections are defined depending on the number of b tags. Region D is expected to be signal dominated.
Region b tags: 1, 2,≥1 b tags: 0,≥3 HT/GeV YMET/
√
GeV HT/GeV YMET/
√ GeV A 375−800 3.25−5.5 375−600 3.25−6.5 B >800 >600 C 375−800 >5.5 375−600 >6.5 D >800 >600
The number of background events ˆND in region D is estimated from the three control regions
as: ˆ ND =κ NB NC NA . (2)
14 6 The Factorization Method
YMET and HT have a small correlation, the factor κ is determined to be 1.20 with an overall
uncertainty of about 11%, as discussed in Section 6.1.
The distribution of SM events in the YMET–HT plane after the event selection in the combined
muon and electron channel with the requirement of at least one b tag is presented in Fig. 6(a). The corresponding results for the LM8 SUSY scenario are presented in Fig. 6(b). It is observed that the SM events are mainly located in the control regions, while the signal events are present in the signal and the control regions. The signal contamination is taken into account in the likelihood model for the scans during limit setting.
6.1 Systematic uncertainties for the factorization method
As for the E/ template method, many systematic effects result in small uncertainties only, sinceT
the background prediction is affected in the same way as the measurements.
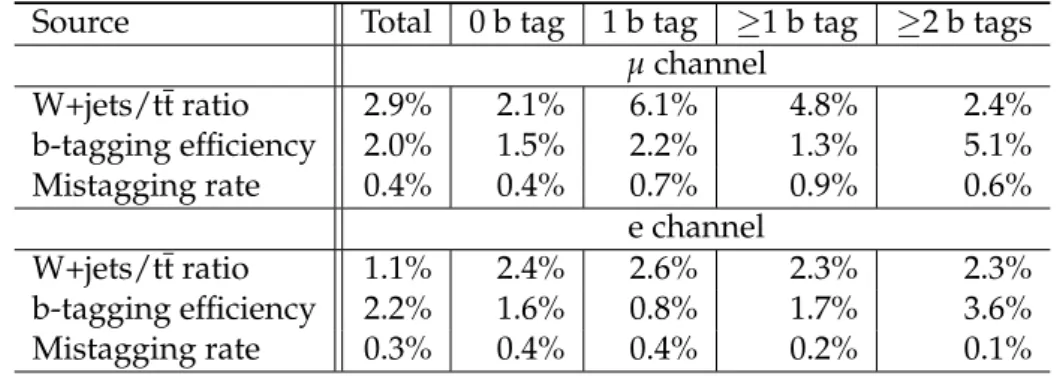
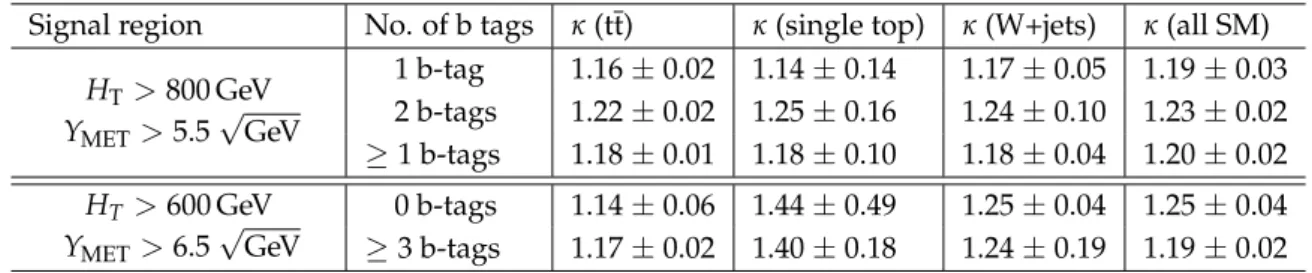
Values of κ as defined in Eq. (2) for the main SM background processes are shown in Table 6 for both signal region definitions and different numbers of b tags. For the dominant background, due to tt events, as well as for the backgrounds from single-top and W+jets events, the corre-lations are larger than one, indicating a residual correlation. Besides these processes we expect only small contributions from Z+jets events. The stability of the correlation factor κ has been tested extensively, and the observed correlation is accounted for by the value of κ from simu-lation. To account for uncertainties in the cross sections of the main SM processes, each cross section is scaled up and down by 50%, and the corresponding uncertainty on κ is determined. Table 6: Correlation factor κ between HTand YMETfor the main SM background processes and
a for different number of b tags, for the two signal regions. For purposes of illustration, the corresponding results for a sample with 0 b tags is also shown. While the 0 b-tag sample is dominated by W+jets events, the channels that include b tags contain mainly tt events. Only statistical uncertainties are shown.
Signal region No. of b tags κ(tt) κ(single top) κ(W+jets) κ(all SM)
HT>800 GeV YMET>5.5 √ GeV 1 b-tag 1.16±0.02 1.14±0.14 1.17±0.05 1.19±0.03 2 b-tags 1.22±0.02 1.25±0.16 1.24±0.10 1.23±0.02 ≥1 b-tags 1.18±0.01 1.18±0.10 1.18±0.04 1.20±0.02 HT >600 GeV YMET>6.5 √ GeV 0 b-tags 1.14±0.06 1.44±0.49 1.25±0.04 1.25±0.04 ≥3 b-tags 1.17±0.02 1.40±0.18 1.24±0.19 1.19±0.02 Except for the E/ requirement, the offline selection criteria are designed to be well above theT
trigger thresholds, where the efficiency reaches a plateau. For events with E/T < 80 GeV, the
efficiency of the triggers with a /HTtrigger threshold of 40 GeV can be as low as around 80%. In these cases the prediction is corrected to account for the inefficiencies.
As the studies above are based on simulation, a cross-check is performed with data in the 0 b-tag channel, which can be considered as signal-free, since previous analyses have already excluded this part of phase space [36]. From this channel a value of κ =1.19±0.13 is observed in data, while for the SM simulation a value of 1.25±0.04 is extracted. Although the values are consistent within their statistical uncertainties, a smaller value of κ cannot be excluded. We account for this possibility by including an additional systematic uncertainty of 10% on the value of κ. The uncertainties for the different selections are described in Section 5.4 and summarized in Table 7. The statistical uncertainty in simulation is relatively small, as the b tagging is applied in the simulation by event weights. In addition, the simulated jet energy resolution (JER) [43] of jets with pT > 10 GeV and |η| < 4.7 is globally increased by 10% to
6.1 Systematic uncertainties for the factorization method 15
provide a more realistic description of the data. The uncertainty on the jet energy resolution is then determined by variation of the corrected simulated JER up and down by ±10%, and propagated to E/ .T
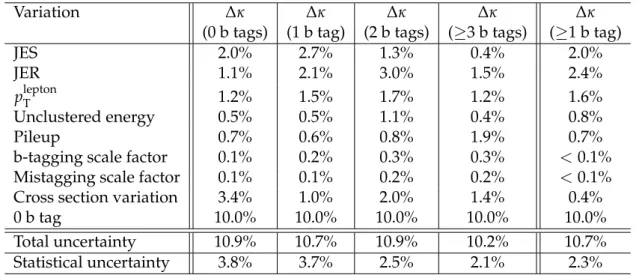
Table 7: Overview of the uncertainties on the correlation factor κ for the different b-tag se-lections. The signal regions corresponding to the number of required b tags are as defined in Table 5. All systematic uncertainties are added in quadrature. The variations in JES, JER, pleptonT , and unclustered energy are propagated to the E/ . The row labeled ’0 b tag’ addressesT
the difference between the values of κ in data and simulation.
Variation ∆κ ∆κ ∆κ ∆κ ∆κ
(0 b tags) (1 b tag) (2 b tags) (≥3 b tags) (≥1 b tag)
JES 2.0% 2.7% 1.3% 0.4% 2.0%
JER 1.1% 2.1% 3.0% 1.5% 2.4%
pleptonT 1.2% 1.5% 1.7% 1.2% 1.6%
Unclustered energy 0.5% 0.5% 1.1% 0.4% 0.8%
Pileup 0.7% 0.6% 0.8% 1.9% 0.7%
b-tagging scale factor 0.1% 0.2% 0.3% 0.3% <0.1%
Mistagging scale factor 0.1% 0.1% 0.2% 0.2% <0.1%
Cross section variation 3.4% 1.0% 2.0% 1.4% 0.4%
0 b tag 10.0% 10.0% 10.0% 10.0% 10.0%
Total uncertainty 10.9% 10.7% 10.9% 10.2% 10.7%
Statistical uncertainty 3.8% 3.7% 2.5% 2.1% 2.3%
Since the value of κ is found to be consistent for all channels within the statistical uncertainties, we use the value κ =1.20±0.02 (stat) found for simulated events with≥1 b-tag to describe all channels. The corresponding systematic uncertainty for each channel is taken from Table 7. The sum of the statistical and systematic uncertainty on κ corresponds to the systematic uncertainty for the prediction ˆND.
For the comparison of data with simulation, the absolute uncertainties for the signal and SM background, and the scale factors between data and simulation, need to be taken into account. These scale factors correct for the differences in the lepton identification efficiency, b-tagging efficiency, and pileup as described in Sections 3 and 5.4. The effect of the b-tagging efficiency is investigated by scaling the scale factors up and down in simulated events. This is performed separately for the b-tagging efficiency scale factor and the mistagging rate scale factor. Since triggers are not used in the simulation, scale factors are applied to account for the trigger effi-ciencies when the simulation is compared to data. An additional uncertainty of 0.2% accounts for the trigger efficiency correction for the prediction in data. The product of all scale factors differs from one by at most ten percent.
Model uncertainties are also taken into account. For the dominant tt background, the uncer-tainties for the inclusive cross section are calculated using the Monte Carlo for femtobarn pro-cesses (MCFM5.8) [47]. The uncertainties associated with scales are determined by separately varying the factorization and matching scales by a factor of 2 up and down. Including parton distribution function (PDF) uncertainties [48], we apply a total uncertainty of 16%.
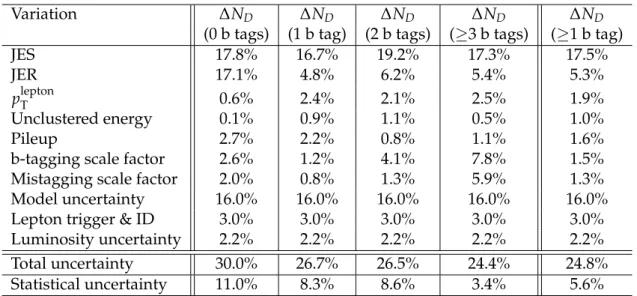
The uncertainties for SM simulation in signal region D, shown in Table 8, are needed for the comparison of data with the SM simulation (as shown in Section 7), but are not used in the limit determination with the scans.
16 8 Interpretation
Table 8: Systematic uncertainties in the signal region for the different selections for the SM sim-ulation, needed for the comparison with data (as in Table 10). The signal regions corresponding to the number of required b tags are as defined in Table 5. All uncertainties are summed in quadrature. The variations in JES, JER, pleptonT , and unclustered energy are propagated to the E/ .T
Variation ∆ND ∆ND ∆ND ∆ND ∆ND
(0 b tags) (1 b tag) (2 b tags) (≥3 b tags) (≥1 b tag)
JES 17.8% 16.7% 19.2% 17.3% 17.5%
JER 17.1% 4.8% 6.2% 5.4% 5.3%
pleptonT 0.6% 2.4% 2.1% 2.5% 1.9%
Unclustered energy 0.1% 0.9% 1.1% 0.5% 1.0%
Pileup 2.7% 2.2% 0.8% 1.1% 1.6%
b-tagging scale factor 2.6% 1.2% 4.1% 7.8% 1.5%
Mistagging scale factor 2.0% 0.8% 1.3% 5.9% 1.3%
Model uncertainty 16.0% 16.0% 16.0% 16.0% 16.0%
Lepton trigger & ID 3.0% 3.0% 3.0% 3.0% 3.0%
Luminosity uncertainty 2.2% 2.2% 2.2% 2.2% 2.2%
Total uncertainty 30.0% 26.7% 26.5% 24.4% 24.8%
Statistical uncertainty 11.0% 8.3% 8.6% 3.4% 5.6%
7
Results
The background estimation methods described in Sections 5 and 6 are used to predict the SM contribution to the signal regions.
A graphical representation of the E/ spectra estimated with the template method in a back-T
ground-dominated region at low HTand the two signal regions at high HTare shown in Fig. 7.
The fit provides a good description of the observed spectrum in the control region, and no ex-cess is observed at high HT. The numerical results for different signal regions are summarized
in Table 9, along with the observed event counts and the expectations for the two SUSY bench-mark scenarios LM6 and LM8. No events are observed above the common upper boundaries of the signal regions of HT <2.5 TeV and E/T<2 TeV.
For the factorization method, the number of events in the signal region ND and the predicted
value ˆND are summarized in Table 10, which additionally includes expectations for the SM
and for the SM with contributions of the LM6 and LM8 SUSY scenarios added. The measured number of events NDand the predicted value ˆND are in agreement and no excess is observed.
The reconstructed number of events in region D and the predicted value ˆND are in agreement
also for the SM simulation, showing the validity of the factorization ansatz for the background estimation. For the comparison of data and simulation, several scale factors are taken into account, as described in Section 6.1. The uncertainty on the number of events ND for the SM
prediction from simulation is larger than that on the prediction ˆND from data, showing the
advantage of this background estimation method.
8
Interpretation
Using the results presented in Section 7, limits are set on the parameters of several supersym-metric models, including the CMSSM and the simplified model described in Section 3.
ra-17 [GeV] T E 100 200 300 400 500 600 700 800 900 1000 Events / 50 GeV 1 10 2 10 3 10 4 10 Fit Data 750 GeV ≤ T 350 < H CMS 4.98 fb-1 s = 7 TeV [GeV] T E 100 200 300 400 500 600 700 800 900 1000 Data/Fit 0 1 2 [GeV] T E 100 200 300 400 500 600 700 800 900 1000 Events / 50 GeV 1 10 2 10 3 10 4 10 Fit Data 2500 GeV ≤ T 750 < H CMS 4.98 fb-1 s = 7 TeV [GeV] T E 100 200 300 400 500 600 700 800 900 1000 Data/Fit 0 1 2 [GeV] T E 100 200 300 400 500 600 700 800 900 1000 Events / 50 GeV 1 10 2 10 3 10 4 10 Fit Data 2500 GeV ≤ T 1000 < H CMS 4.98 fb-1 s = 7 TeV [GeV] T E 100 200 300 400 500 600 700 800 900 1000 Data/Fit 0 1 2
Figure 7: Distribution of E/ in the muon channel: data (points) and fit result of the templateT
method (line) for (top) 350 < HT < 750 GeV; data and prediction obtained from the fit for
(bottom left) 750< HT < 2500 GeV and for (bottom right) 1000 < HT < 2500 GeV. The bands
around the fit correspond to the statistical uncertainty on the parameter α. The systematic uncertainties have been calculated for E/T >250, 350 and 450 GeV and range from 16 – 32% (24
– 42%) for HT >750 (1000) GeV as reported in Tab. 9. The lower panels show the ratio between
18 8 Interpretation
Table 9: Predicted and observed yields from the E/ -template method for the different signal re-T
gions. The first uncertainties are statistical and the second systematic. The expected yields and statistical uncertainties for the two benchmark points LM6 and LM8 are shown for comparison.
observed predicted stat. sys. LM6 LM8
750<HT<2500 GeV, 250<E/T<2000 GeV Total 137 146 ± 9 ± 24 42.2 ± 6.5 79.8 ± 8.9 0 b tag 97 99 ± 8 ± 18 26.3 ± 5.1 21.9 ± 4.7 1 b tag 35 34.6 ± 2.8 ± 7.5 10.7 ± 3.3 29.0 ± 5.4 ≥1 b tag 40 47 ± 3 ± 10 16.0 ± 4.0 57.9 ± 7.6 ≥2 b tags 5 12.3 ± 1.4 ± 2.7 5.2 ± 2.3 28.8 ± 5.4 750<HT<2500 GeV, 350<E/T<2000 GeV Total 44 54 ± 5 ± 12 30.7 ± 5.5 39.1 ± 6.3 0 b tag 32 38.7 ± 3.6 ± 9.5 19.9 ± 4.5 12.0 ± 3.5 1 b tag 11 11.5 ± 1.0 ± 3.5 7.5 ± 2.7 14.6 ± 3.8 ≥1 b tag 12 14.8 ± 1.1 ± 4.5 10.9 ± 3.3 27.1 ± 5.2 ≥2 b tags 1 3.3 ± 0.4 ± 1.0 3.3 ± 1.8 12.4 ± 3.5 750<HT<2500 GeV, 450<E/T<2000 GeV Total 20 19.6 ± 2.1 ± 6.2 19.6 ± 4.4 15.8 ± 4.0 0 b tag 14 14.9 ± 1.7 ± 5.2 13.3 ± 3.7 5.7 ± 2.4 1 b tag 5 3.8 ± 0.4 ± 1.5 4.5 ± 2.1 5.6 ± 2.4 ≥1 b tag 6 4.7 ± 0.4 ± 1.8 6.3 ± 2.5 10.1 ± 3.2 ≥2 b tags 1 0.9 ± 0.1 ± 0.3 1.8 ± 1.3 4.5 ± 2.1 1000< HT<2500 GeV, 250<E/T<2000 GeV Total 36 37.5 ± 3.7 ± 8.9 18.1 ± 4.3 31.1 ± 5.6 0 b tag 30 27.0 ± 3.2 ± 7.0 10.9 ± 3.3 7.9 ± 2.8 1 b tag 5 7.5 ± 1.2 ± 2.6 4.8 ± 2.2 11.5 ± 3.4 ≥1 b tag 6 10.5 ± 1.3 ± 3.6 7.2 ± 2.7 23.2 ± 4.8 ≥2 b tags 1 3.0 ± 0.6 ± 1.0 2.3 ± 1.5 11.8 ± 3.4 1000< HT<2500 GeV, 350<E/T<2000 GeV Total 13 15.5 ± 1.7 ± 4.9 13.0 ± 3.6 15.6 ± 4.0 0 b tag 11 11.7 ± 1.6 ± 4.2 8.1 ± 2.8 4.2 ± 2.1 1 b tag 2 2.9 ± 0.5 ± 1.4 3.4 ± 1.9 5.8 ± 2.4 ≥1 b tag 2 3.8 ± 0.5 ± 1.8 4.9 ± 2.2 11.4 ± 3.4 ≥2 b tags 0 1.0 ± 0.2 ± 0.5 1.5 ± 1.2 5.6 ± 2.4 1000< HT<2500 GeV, 450<E/T<2000 GeV Total 7 6.6 ± 0.9 ± 2.8 8.5 ± 2.9 7.0 ± 2.6 0 b tag 6 5.2 ± 0.8 ± 2.3 5.5 ± 2.3 2.2 ± 1.5 1 b tag 1 1.1 ± 0.2 ± 0.7 2.1 ± 1.5 2.4 ± 1.6 ≥1 b tag 1 1.4 ± 0.2 ± 0.9 3.0 ± 1.7 4.8 ± 2.2 ≥2 b tags 0 0.3 ± 0.1 ± 0.2 0.8 ± 0.9 2.4 ± 1.5
tio. The likelihood function includes a Poisson distribution describing the number of observed events in the signal region. Its mean value is B+µS, where B is the predicted background,
S the expected signal yield at the nominal cross section of the model under study, and µ the signal strength parameter.
For the E/ template method, BT =BNr/(1+µc), where BNis the background in the
normaliza-tion region, r the ratio of the background in signal and normalizanormaliza-tion regions, determined by the E/ model, and c is the relative bias in the background estimation due to signal contamina-T
tion. The effect of signal contamination is determined by repeating the background estimation on simulated samples combining SM processes and a signal at the nominal cross section. The nuisance parameter BNis constrained by a second Poisson distribution with mean BN,
describ-ing the number of observed events in the normalization region. For the factorization method, B=κBBBC/BA. The nuisance parameters Bidescribing the estimated background in the three
8.1 CMSSM 19
Table 10: Number of reconstructed (ND) and predicted ( ˆND) events in the signal region for the
factorization method for the SM, two possible signal scenarios (LM6, LM8), and data. The first uncertainties are statistical and the second systematic. The systematic uncertainty on ˆND in
data is equal to the uncertainty on κ. The systematic uncertainty in simulation includes the uncertainty on the absolute rate of simulated events, as discussed in the text. The exclusive 0 b-tag selection is shown for comparison as well.
Signal region Sample ND NˆD
0 b-tags HT >600 GeV YMET>6.5 √ GeV Σ SM 182±22±55 186±19±40 Σ SM+LM6 221±22±59 191±19±40 Σ SM+LM8 218±24±61 194±20±41 Data 155 162±11±18 1 b-tag HT >800 GeV YMET>5.5 √ GeV Σ SM 74±5±18 74±4±14 Σ SM+LM6 95±5±21 77±4±14 Σ SM+LM8 132±6±29 90±5±16 Data 51 53.9±6.3±5.9 2 b-tags HT >800 GeV YMET>5.5 √ GeV Σ SM 50±3±13 47.5±2.1±8.1 Σ SM+LM6 62±3±15 49.0±2.2±8.2 Σ SM+LM8 103±5±24 62.7±2.7±9.7 Data 27 36.0±5.1±4.0 ≥3 b-tags HT >600 GeV YMET>6.5 √ GeV Σ SM 22.6±1.1±6.0 21.3±0.9±4.0 Σ SM+LM6 27.1±1.1±6.6 21.9±0.9±4.1 Σ SM+LM8 66±4±15 34.3±1.8±4.8 Data 10 13.8±3.2±1.5 ≥1 b-tag HT >800 GeV YMET>5.5 √ GeV Σ SM 136±6±34 134±5±24 Σ SM+LM6 172±6±39 139±5±24 Σ SM+LM8 280±8±63 177±6±28 Data 84 98±8±11
control regions A, B, and C are constrained by three additional Poisson distributions with mean values Bi+µαiS, where i is the index of a control region. The second term describes the
ex-pected contribution of the signal to the control region and ensures a correct estimate in the presence of signal contamination. The full likelihood function contains additional log-normal terms describing the nuisance parameters affecting the expected signal yields and the param-eters r and κ for the E/ template and the factorization method, respectively, corresponding toT
the different sources of systematic uncertainties.
The expected signal yields and systematic uncertainties are evaluated for every signal point in the parameter planes of the two models considered. Sources of experimental uncertainties on the signal selection include the jet energy and E/ scales, b-tagging efficiencies, and mistaggingT
rates. These uncertainties are treated as fully correlated with the corresponding variations in the background estimate. Smaller contributions to the signal uncertainty are due to the lepton and trigger selection efficiencies and to the measurement of the luminosity (2.2%). In the likelihood function used for the factorization method, the correlation of uncertainties between the four regions is taken into account.
8.1 CMSSM
Within the CMSSM limits are set in the m1/2 vs. m0 plane with parameters tan β = 10, A0 =
0 GeV, and µ > 0. The acceptance and efficiency factors eiAi are calculated in a scan over
20 8 Interpretation
next-to-leading order (NLO) and next-to-leading log (NLL) K-factors [51–55] for each SUSY subprocess separately. The experimental uncertainties on the signal selection efficiency are dominated by the jet and E/ energy scales. In the relevant region of the parameter plane, theseT
variations are smaller than 20% for both methods. The contributions due to the lepton and trigger selection are about 5%.
For the E/ template method, the CMSSM limits are set in a multichannel approach using theT
0 b-tag, 1 b-tag, and ≥2 b-tag bins, while for the factorization method at least one b tag is required. In the multichannel approach, the statistical uncertainties on the background estima-tion due to fluctuaestima-tions in the normalizaestima-tion regions are treated as uncorrelated. Correlaestima-tions between b-jet multiplicity bins in the E/ template method are evaluated for the uncertaintiesT
related to the E/ shape parameters. Variations in the b-jet identification efficiencies also lead toT
correlation between different bins and between signal yields and background predictions. All other systematic effects are treated as fully correlated.
The 95% confidence level (CL) limit using the CLs technique is presented in Fig. 8, where the
region below the black curves is excluded. The regions in HTand E/ with the highest sensitivityT
are used: HT > 1000 GeV and E/T > 250 GeV for the E/ template method, and HT T > 800 GeV,
YMET>5.5
√
GeV, and≥1 b tag for the factorization method. Theoretical uncertainties on cross sections, arising from scale and PDF uncertainties, are illustrated by bands of the expected and observed limits with these uncertainties added or subtracted [56]. The E/ template methodT
with the simultaneous use of three b-jet multiplicity bins provides the best expected limit.
8.2 Simplified model interpretation
In simplified models a limited set of hypothetical particles is introduced to produce a given topological signature [23–25]. The final state of the simplified model studied here contains a lepton and b jets as described in Section 3. The model has no intermediate mass state, so it contains only two free parameters: the mass of the LSP and the mass of the gluino. The signal cross sections are calculated up to NLO + NLL accuracy [51–56]. For each point in the param-eter plane, the acceptance times efficiency and a cross section upper-limit is calculated. The systematic uncertainties are, as in the CMSSM case, determined for each point. The acceptance times the efficiency is presented in Fig. 9 for both background estimation methods.
For the E/ template method, the best expected limits for this model are obtained in theT ≥2
b-tag bin. Cross section limits at 95% CL are calculated using the statistical framework described above. The signal region defined by the lower boundaries HT > 750 GeV and E/T > 250 GeV
is used. This choice results in high signal efficiencies also for low gluino masses and small mass differences between the gluino and the LSP. The limit with the factorization method is set requiring≥3 b tags. In this case the signal region is defined as HT > 600 GeV and YMET >
6.5√GeV.
The effect of signal contamination on the background estimation is found to be higher than in the CMSSM case, with values up to 30%. This bias is taken into account in the calculation of the limits, which are shown in Fig. 10.
The analyses have also been tested on a simplified model describing direct stop pair produc-tion. Despite a higher acceptance times efficiency for this model, no limits can be obtained due to the low cross section of this process.
8.2 Simplified model interpretation 21 [GeV] 0 m 200 400 600 800 100012001400160018002000 [GeV] 1/2 m 100 200 300 400 500 600 700 800 ) = 500 g~ m( ) = 1000 g~ m( ) = 1500 g~ m( ) = 1000 q~ m( ) = 1500 q~ m( ) = 2000 q ~ m( ) = 2500 q~ m( ± l ~ LEP2 ± 1 χ∼ LEP2 = LSP τ∼ )=10 β tan( = 0 GeV 0 A > 0 µ = 173.2 GeV t m 95% CL exclusion limits observed median expected exp. σ 1 ± expected theor. σ 1 ± observed = 7 TeV s , -1 CMS, 4.98 fb [GeV] 0 m 200 400 600 800 100012001400160018002000 [GeV] 1/2 m 100 200 300 400 500 600 700 800 ) = 500 g~ m( ) = 1000 g~ m( ) = 2000 g~ m( ) = 1000 q~ m( ) = 1500 q~ m( ) = 2000 q ~ m( ) = 2500 q~ m( ± l ~ LEP2 ± 1 χ∼ LEP2 = LSP τ∼ )=10 β tan( = 0 GeV 0 A > 0 µ = 173.2 GeV t m 95% CL exclusion limits observed median expected exp. σ 1 ± expected theor. σ 1 ± observed 1 b-tag ≥ = 7 TeV, s , -1 CMS, 4.98 fb
Figure 8: The 95% CL limit using the CLs technique for the CMSSM model with tan β = 10,
A0 =0 GeV, and µ>0 (left) for the E/ template method using the multichannel approach andT
(right) for the factorization method requiring at least one b tag. The solid red line corresponds to the median expected limit, including all experimental uncertainties. The area below the solid red line (observed limit) is excluded, with the thin red dashed lines showing the effect of a variation of the signal yields due to theoretical uncertainties. The thick black dashed line shows the expected limit. It is surrounded by a shaded area representing the experimental uncertainties.
22 9 Summary ε × A 0 0.02 0.04 0.06 0.08 0.1 0.12 0.14
gluino mass [GeV]
400 600 800 1000 LSP mass [GeV] 200 400 600 800 CMS -1 7 TeV, 4.98 fb 2 b tags ≥ + µ e/ ) g~ m( > )> q ~ ; m( 0 χ ∼ t t → g ~ , g ~ g ~ → pp ε × A 0 0.02 0.04 0.06 0.08 0.1 0.12
gluino mass [GeV]
400 600 800 1000 LSP mass [GeV] 200 400 600 800 CMS -1 7 TeV, 4.98 fb 3 b tags ≥ + µ e/ ) g ~ m( > )> q ~ ; m( 0 χ ∼ t t → g ~ , g ~ g ~ → pp
Figure 9: Acceptance times efficiency for the simplified model shown in Fig. 1 for (left) the E/T
template method, where at least two b tags are required, and (right) the factorization method with three or more b tags. The diagonal dashed line marks the lower kinematical limit of the LSP mass.
9
Summary
A sample of events with a single electron or muon, multiple energetic jets, including identi-fied b jets, and significant missing transverse energy, has been used to perform a search for new physics motivated by R-parity conserving supersymmetric models. The study is based on a data sample of proton-proton collision data recorded at √s = 7 TeV with the CMS de-tector, corresponding to an integrated luminosity of 4.98 fb−1. The dominant standard model backgrounds are due to tt and W+jets production.
Background contributions to different signal regions have been estimated from data with two complementary approaches. The first approach uses data in a control region at low HT to
determine templates of the E/ spectra for each of the main background components. Fits areT
performed simultaneously for three subsamples with 0, 1, and≥2 identified b jets to determine the templates. Based on the templates and the observed number of events in a normalization region at low E/ , predictions are made for several signal regions at high HT Tand E/ . The secondT
approach uses the low correlation between HT and YMET = E/ /T
√
HT. The standard model
background in signal regions at high values of HTand YMETis estimated based on the observed
yields in three control regions. The two background estimation methods are complementary, as they have only small overlap in their control and signal regions, both in the standard model and in the signal scenarios.
No excess has been observed, and the results have been used to set 95% CL exclusion limits for several models. In the context of the constrained minimal supersymmetric extension of the standard model with parameters tan β=10, A0=0 GeV, and µ>0, the template method with
the simultaneous use of the 0, 1, and≥2 b-jet bins shows the highest sensitivity. Values of m1/2 below about 450 GeV are excluded for m0in the range of about 200 GeV to about 800 GeV.
Limits have also been set in the parameter plane of the gluino and LSP masses of a simplified model that features four top quarks in the final state. Due to the high number of b quarks in the final state, the factorization method, which provides a background estimate for events with at