pISSN 1899-5241 eISSN 1899-5772
Journal of Agribusiness
and Rural Development
www.jard.edu.pl
3(33) 2014, 283-297
Copyright © Wydawnictwo Uniwersytetu Przyrodniczego w Poznaniu
FACTORS CONTRIBUTION TO THE ADOPTION
OF PRODUCTION TECHNOLOGIES BY POTATO
GROWERS IN NORTHWEST BANGLADESH
A.B.M. Sharif Uddin
1, M. Mostafizur Rahman
2,
M. Bashirul Alam
3, M. Hasanul Kabir Kamaly
4 1Zila Parishad, Natore 2
University of Rajshahi 3
Bangladesh Railway (West), Rajshahi 4
Upazilla Agriculture Office, Tanore, Rajshahi
produc-tion, more aspiraproduc-tion, more contact with group members, more peer relation and more fa-vourable attitude were found to better adopt the potato production technologies.
Key words: adoption, production technologies, potato, factors contribution
INTRODUCTION
Keeping this view in mind, the present study was undertaken with the objective to iden-tify the factors which contribute to the adoption of production technologies by potato growers.
MATERIALS AND METHODS
Study area, population and sample
The study was conducted in the Rajshahi district of northwest area of Bangladesh. Three Upazilla (administrative unit) namely, Mohonpur, Bagmara and Durgapur from this district were also selected considering their production performance and area cover-age under potato cultivation. Finally, six villcover-ages from Mohonpur, 10 from Bagmara and four from Durgapur were selected randomly as a location of the study. Total num-ber of potato growers who have at least 0.13 hectare of land for potato cultivation in these twenty villages was 1547 which constituted population of the study, 232 potato growers were selected randomly as the respondents covering 15 percent of the active population.
Data Collection and statistical analysis
Data were collected through personal interviews by using a structured interview schedule from July 2010 to February 2011. Necessary secondary data were also collect-ed from different sources in addition to primary data. Descriptive statistical measures such as number, percentage distribution, range, mean, standard deviation and coefficient variation were used in describing the selected variables. To examine the relationship between the predicted and response variables, Perason’s Product Moment Correlation Coefficient (r) was done. To ascertain the per cent contribution of a predict variable on the response variable full model and stepwise regression analyses were used. Path anal-ysis technique was also used to interpret the cause effect relation.
Measurement of predicted (independent) variables
differ-ent agricultural training programs. A score of one (1) was assigned for each day of train-ing received. For measurtrain-ing the supervision of crop production, 15 statements were asked to indicate their opinion against four types of responses, such as ‘frequently’ ‘sometimes’ ‘rarely’ and ‘not at all’ the weights of 3, 2, 1 and 0, respectively. The range of the score was from 0 to 45 where 0 indicated no supervision and 45 indicated very high supervision. Peer relationship was determined according to the number of day contact made by the respondent with five selected peers in a week. Four measuring the psychological variables like attitude, aspiration and risk orientation, 5 point Likert type scale was used. A four point of awareness scale was prepared in this study for measur-ing potato production problem awareness of the farmers. Innovativeness, formal group affiliation, cosmopoliteness and extension media (individual, group and mass) contact were measured by as usual methods which are exiting in social science.
Measurement of response (dependent) variable
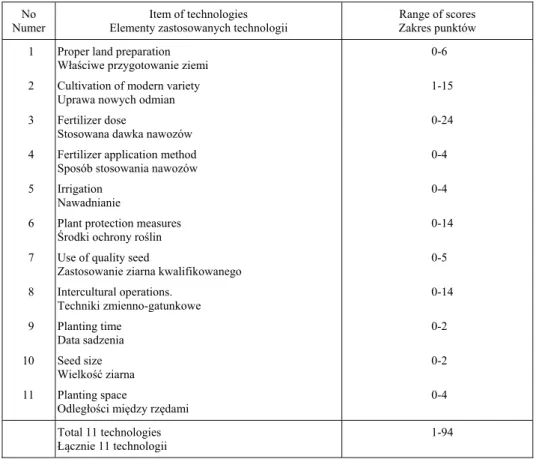
Based on available literature on the selection of potato production technologies [Muttaleb 1995, Hasan 2003, Farukh 2007], field visit and discussion with resource person of Department of Agricultural Extension (DAE), the researcher selected 11 tech-nologies for studying in this investigation. These are (i) well land preparation, (ii) culti-vation of modern variety, (iii) fertilizer dose, (iv) fertilizer application method, (v) irri-gation, (vi) plant protection measures, (vii) quality seed, (viii) inter cultural operations, (ix) planting time, (x) seed size and (xi) planting space. Procedure for computing score for adoption of each of the eleven technologies and the score for overall adoption of the eleven technologies are described as follows:
Good land preparation. Ploughing depth and smoothness of cultured soil provide predisposition for potato cultivation. Land preparation score could range from 0 to 6, where 0 indicated non adoption of good ground preparation and 6 indicated high adop-tion of proper land preparaadop-tion.
Modern variety cultivation score. If the modern variety potato cultivated area co-vers up to 10% of the total cultivated area could score 01 and at every 10% more area add one sub-score ultimately highest sub-score ranges 10. Time sub-score was comput-ed by using continuous cultivation practice as 1, 2, 3, 4 for the number of years and 5 for continuous cultivation practice up to 5 years or more. Thus the scores could range from 1-15 where 1 indicated lowest adoption and 15 indicated highest adoption of mod-ern varieties potato cultivation.
Fertilizer dose. Fertilizer score is consisted of combined scores of recommended or over six fertilizers dose score of Urea, Triple Super Phosphate (TSP), Muriate of Potash (MP), Gypsum, Zinc Sulphate and cowdung and scored as 4, 3, 2 and 1 for recommend-ed dose. Also 0, 1, 2 and 3 for double, three-fourths, half, or quarter for the over dose respectively. So, six fertilizer full dose scored 6 by 4 = 24 and double dose scored 6 by 0 = 0. The score could range from 0-24.
Irrigation. Irrigation score of a respondent was computed on the basis of the num-ber like no irrigation, one time irrigation, 2 times irrigation, 3 times irrigation and 4 or more times irrigation with the corresponding score of 0, 1, 2, 3 and 4 respectively.
Plant protection measures. Tuber crop research centre recommended six types of plant protection like seed treatment, soil treatment, insect control, disease control, seed sorting, and suberization. In addition proper care of aeration and light for the potato fields and stores of tuber seeds was considered as a way of prevention of seed quality control, against the extent of measurement as no treatment, occasional treatment and necessarily treatment with marking of 0, 1 and 2 accordingly. The seven sub-scores as told above collectively constituted the plant protection score. Each of the seven sub-scores could range from 0 to 2. Therefore, the plant protection score could range from 0 to 14, where 0 indicated no adoption and 14 indicated highest adoption.
Use of quality seed. Score were assigned for certified or Bangladesh Agricultural Development Corporation seeds, self produced/own seeds, collected from fellow farmer’s seed, seed from other nearest sources and seed collected from unknown person or open market weighed as 5, 3, 2, 1 and 0 accordingly. Thus Seed score could range from 0 to 5, where 0 indicated non adoption of quality seed and 5 indicated high adop-tion.
Intercultural operation. A list of intercultural operations as weed control, mulch-ing, roughmulch-ing, removal of virus affected plant, breaking of soil clots, rodent control and earthing up were assigned as of plant protection measures with corresponding extent of measurement of nature of action taken as no, occasional and according to necessity and weighed as o, 1 and 2 respectively
Planting time. The scale used for computing the planting time score as last week of October to mid November, mid November to November and after November as scored of 0, 1 and 2 respectively and where 0 indicated non adoption of optimum planting time and 2 indicated high adoption.
Seed size score According to the recommendation of potato scientists, the following scale of tuber cut into 2 pieces, tuber cut into 3 to 4 pieces and tuber cut into more than 4 pieces weighed as 2, 1 and 0. Seed size score could range from 0 to 2, where 0 indi-cated non adoption of appropriate seed size and 2 indiindi-cated high adoption.
Planting space. Spacing score consisted of two scores, namely line to line sub-score 23-24 inch, 20-22 inch and less than 20 inch sub-scored as 2, 1 and 0; and plant to plant sub-score 5-6, 3-4 and less than 3 inch weighed as 2, 1 and 0. Spacing score was obtained by adding its two sub-scores as told above. Each of the two sub-scores could range from 0 to 2. Therefore, spacing scores of the respondents could range 0 to 4, where 0 indicated non-adoption of recommended spacing and 4 indicated high adoption.
Table 1. Scoring system of adoption technologies
Tabela 1. System punktowego oznaczania zastosowanych technologii
No Numer
Item of technologies Elementy zastosowanych technologii
Range of scores Zakres punktów
1 Proper land preparation Wła ciwe przygotowanie ziemi
0-6
2 Cultivation of modern variety Uprawa nowych odmian
1-15
3 Fertilizer dose
Stosowana dawka nawozów
0-24
4 Fertilizer application method Sposób stosowania nawozów
0-4
5 Irrigation Nawadnianie
0-4
6 Plant protection measures rodki ochrony ro lin
0-14
7 Use of quality seed
Zastosowanie ziarna kwalifikowanego
0-5
8 Intercultural operations. Techniki zmienno-gatunkowe
0-14
9 Planting time
Data sadzenia
0-2
10 Seed size
Wielkoć ziarna
0-2
11 Planting space
Odległo ci między rzędami
0-4
Total 11 technologies
Łącznie 11 technologii
1-94
MEASUREMENT OF COMPARATIVE ADOPTION OF ELEVEN SELECTED PRODUCTION TECHNOLOGIES OF POTATO PRODUCTION
For comparing the extent of adoption of all selected technologies as a factor of adop-tion determinants it was required to compute an adopadop-tion index for each of the eleven technologies. The adoption index for a certain technology was computed by using the following formula:
Adoption index = Pn 0 + Pl 1 + Pm 2 + Ph 3
where: Pn – Percentage of farmers having no adoption, Pl – Percentage of farmers having low adoption, Pm – Percentage of farmers having medium adoption, Ph – Percentage of farmers having high adoption.
RESULTS AND DISCUSSION
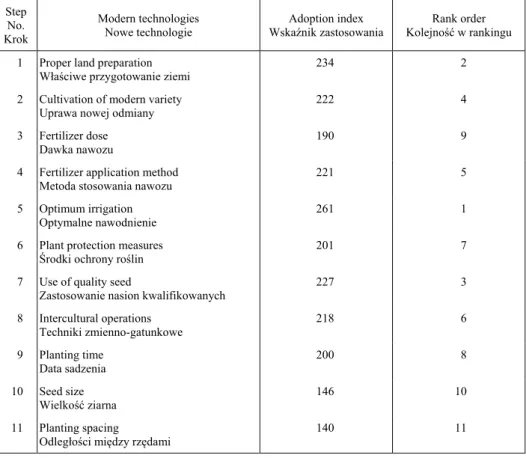
The eleven modern technologies have been arranged in rank order on the basis of their adoption indices in Table 2. Analysis of data in Table 2 indicates that among the extent of adoption of modern eleven technologies recommended irrigation was at top highest ranking by the adoption index of 261. Muttaleb [1995] also found the similar findings in his study. The adoption index of well land preparation, use of quality seed, modern variety cultivation, fertilizer application method, inter cultural operations, plant protection measures were 234, 227, 222, 221, 218 and 201 respectively. But below two-thirds of adoption index scores were found in planting time, fertilizer doze, seed size and plant spacing 200, 190, 146 and 140 respectively.
Table 2. Ranking order of modern variety potato production technologies
Tabela 2. Uszeregowanie zastosowanych technologii w zakresie wykorzystania nowych odmian ziemniaków
Step No. Krok
Modern technologies Nowe technologie
Adoption index Wska nik zastosowania
Rank order Kolejnoć w rankingu
1 Proper land preparation Wła ciwe przygotowanie ziemi
234 2
2 Cultivation of modern variety Uprawa nowej odmiany
222 4
3 Fertilizer dose Dawka nawozu
190 9
4 Fertilizer application method Metoda stosowania nawozu
221 5
5 Optimum irrigation
Optymalne nawodnienie
261 1
6 Plant protection measures rodki ochrony ro lin
201 7
7 Use of quality seed
Zastosowanie nasion kwalifikowanych
227 3
8 Intercultural operations Techniki zmienno-gatunkowe
218 6
9 Planting time
Data sadzenia
200 8
10 Seed size
Wielkoć ziarna
146 10
11 Planting spacing
Odległo ci między rzędami
140 11
Source: own calculations from field data.
Adoption of seed size and plant spacing were at lowest ranking. Seed size of lowest ranking also observed by Muttaleb [1995]. From the above findings, it is evident that the comparative priority in adoption of quality seed is considered by the farmers but might be due to unconsciously optimum seed size is still ignored. Fertilizer application method is more adopted than fertilizer doze indicated farmers’ exposure among them is better but doze selection would have been going on as self-centered pre-conceived idea of fertilizer use or lack of knowledge about nutrient contents in fertilizer and manures.
OVERALL ADOPTION OF MODERN POTATO PRODUCTION TECHNOLOGIES
In order to have a clear understanding of the combined adoption of the eleven se-lected potato production technologies, an overall adoption score was computed for each of the respondent by adding the score of 11 modern potato production technologies. Possible range of the overall adoption score of the study respondent farmers could range from 1 to 96, where 1 indicated minimum adoption and 96 indicated maximum adoption of potato production technologies. Computed overall adoption scores of the farmers ranged from 45 to 80.50. The mean value is being 63.32 with standard deviation and co-efficient of variation 7.92 and 62.70 respectively. Based on the observed scores, potato grower farmers were classified into three categories such as ‘low’ adoption, ‘medium’ adoption and ‘high’ adoption as shown in Table 3.
Table 3. Distribution of the farmers according to their overall adoption of modern potato tech-nologies
Tabela 3. Rozmieszczenie przestrzenne rolników w oparciu o zastosowane przez nich nowocze-sne technologie uprawy ziemniaków
Categories according to overall adoption (scores)
Kategorie w oparciu o całkowite dane doty-czące zastosowanych technologii (punktacja)
Potato growers
Mean rednia
Standard deviation Odchylenie standardowe
Co-efficient of variation Współ czyn-nik
zmien-no ci number
iloć
percentage procent
Low adoption (45-57)
Niski stopie zastosowania (45-57)
55 23.71 63.32 7.92 62.70
Medium adoption (57.01-68.83) redni stopie zastosowania (57.01-68.83)
116 50.00
High adoption (68.84-80.50)
Wysoki stopie zastosowania (68.84-80.50)
61 26.29
Total
Łącznie
232 100
Source: own calculations from field data.
ródło: obliczenia własne na podstawie danych z bada terenowych.
(73.71%) of the farmers had low or medium adoption. Potato as a short duration starchy vegetable crop might have scope of alternative source of staple food would play a sig-nificant role in meeting the increasing demand of rice and wheat grain.
VARIABLE RELATED TO ADOPTION OF POTATO PRODUCTION TECHNOLOGIES
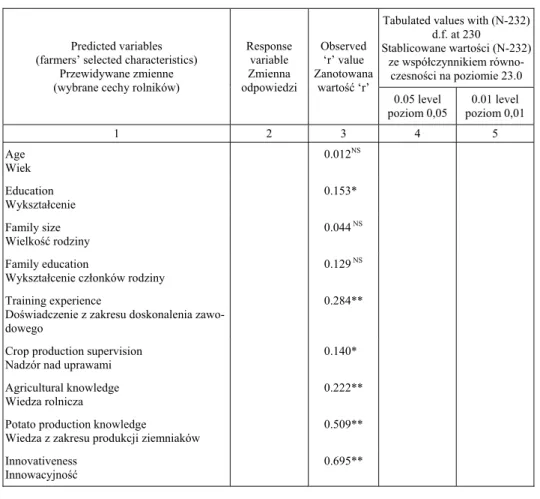
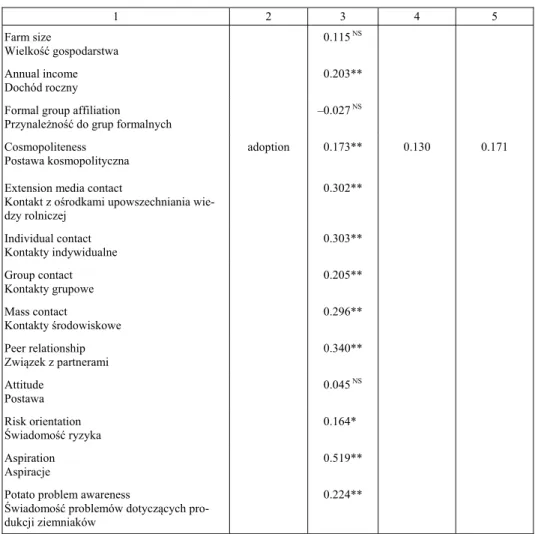
A total of 22 selected characteristics of the potato growers were considered as pre-dict variables in this study. In order to test the relationship of these characteristics to adoption of potato production technologies was computed. The computed correlation coefficients are shown in the Table 4.
Table 4. Coefficient of correlation between the selected characteristics of potato growers and their adoption of potato production technologies
Tabela 4. Współczynnik korelacji między wybranymi cechami plantatorów ziemniaków a zasto-sowaniem ró nych technologii produkcji
Predicted variables (farmers’ selected characteristics)
Przewidywane zmienne (wybrane cechy rolników)
Response variable Zmienna odpowiedzi
Observed ‘r’ value Zanotowana
wartoć ‘r’
Tabulated values with (N-232) d.f. at 230
Stablicowane warto ci (N-232) ze współczynnikiem
równo-czesno ci na poziomie 23.0
0.05 level poziom 0,05
0.01 level poziom 0,01
1 2 3 4 5
Age Wiek
0.012NS
Education Wykształcenie
0.153*
Family size Wielkoć rodziny
0.044 NS
Family education
Wykształcenie członków rodziny
0.129 NS
Training experience
Do wiadczenie z zakresu doskonalenia zawo-dowego
0.284**
Crop production supervision Nadzór nad uprawami
0.140*
Agricultural knowledge Wiedza rolnicza
0.222**
Potato production knowledge
Wiedza z zakresu produkcji ziemniaków
0.509**
Innovativeness Innowacyjnoć
Table 4 – cont. / Tabela 4 – cd.
1 2 3 4 5
Farm size
Wielkoć gospodarstwa
0.115 NS
Annual income Dochód roczny
0.203**
Formal group affiliation Przynale noć do grup formalnych
–0.027 NS
Cosmopoliteness Postawa kosmopolityczna
adoption 0.173** 0.130 0.171
Extension media contact
Kontakt z o rodkami upowszechniania wie-dzy rolniczej
0.302**
Individual contact Kontakty indywidualne
0.303**
Group contact Kontakty grupowe
0.205**
Mass contact
Kontakty rodowiskowe
0.296**
Peer relationship Związek z partnerami
0.340**
Attitude Postawa
0.045 NS
Risk orientation wiadomoć ryzyka
0.164*
Aspiration Aspiracje
0.519**
Potato problem awareness
wiadomoć problemów dotyczących pro-dukcji ziemniaków
0.224**
NS – not significant, *significant at 0.05 level of probability, **significant at 0.01 level of probability. Source: own calculations from field data.
NS – nieistotne, *istotne na poziomie prawdopodobie stwa równym 0,05, **istotne na poziomie prawdo-podobie stwa równym 0,01
ródło: obliczenia własne na podstawie bada terenowych.
CONTRIBUTION OF SELECTED PREDICT VARIABLES TO THE FARMERS’ ADOPTION OF POTATO PRODUCTION TECHNOLOGIES
In order to find out the contribution of variability in predicting farmer’s adoption of potato production technologies the problem of multi-co linearity, stepwise regression analysis was computed in the present study. According to Dropper and Smith [1981], the purpose of stepwise multiple regression analysis is to insert variables in turn until the regression equation is satisfactory. The objective of the regression model was to find out the contribution of the variables, which were significant only, apart from the prob-lem of multi-co linearity on the adoption behaviour of the farmers. In order to find out the contribution of predict variables to farmers’ adoption of potato technologies step-wise regression analysis was computed. Out of 22 variables, only 16 which had signifi-cant relationship with response variable based on the correlation results were selected for stepwise multiple regression analysis (Table 5).
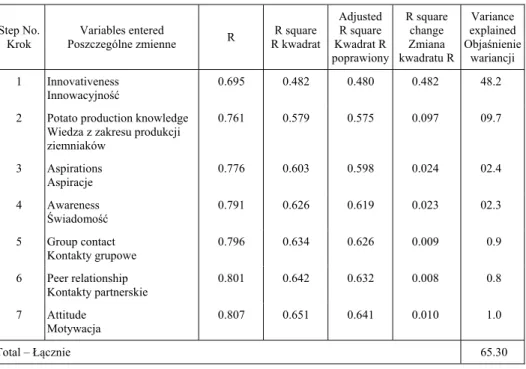
Table 5. Summary of stepwise multiple regression analysis showing the contribution of all 22 independent variables to the adoption of potato production technologies
Tabela 5. Podsumowanie analizy wielokrotnej regresji krokowej ukazującej wpływ wszystkich 22 niezale nych zmiennych na zastosowanie technologii produkcji ziemniaków
Step No. Krok
Variables entered
Poszczególne zmienne R
R square R kwadrat
Adjusted R square Kwadrat R poprawiony
R square change Zmiana kwadratu R
Variance explained Obja nienie
wariancji
1 Innovativeness Innowacyjnoć
0.695 0.482 0.480 0.482 48.2
2 Potato production knowledge
Wiedza z zakresu produkcji ziemniaków
0.761 0.579 0.575 0.097 09.7
3 Aspirations Aspiracje
0.776 0.603 0.598 0.024 02.4
4 Awareness
wiadomoć
0.791 0.626 0.619 0.023 02.3
5 Group contact
Kontakty grupowe
0.796 0.634 0.626 0.009 0.9
6 Peer relationship
Kontakty partnerskie
0.801 0.642 0.632 0.008 0.8
7 Attitude Motywacja
0.807 0.651 0.641 0.010 1.0
Total – Łącznie 65.30
Source: own calculations from field data.
ródło: obliczenia własne na podstawie bada terenowych.
These seven predict variables were important and combindly explained 65.30 percent of the total variation in predicting the farmers’ adoption behaviour. But out of them, inno-vativeness singularly explained 48.2 percent of variation, because it played a most vital role in the whole process. Interest in any new innovation can make an individual aware to contact with all other relevant factors of influencing dissemination of new technolo-gy. Use of any new technology shows an individual as ready reference. As a whole, innovativeness leads other attribute of a farmer.
PATH ANALYSIS FOR MEASURING DIRECT AND INDIRECT EFFECT OF FARMERS’ SELECTED CHARACTERISTICS TO THEIR ADOPTION OF POTATO PRODUCTION TECHNOLOGIES
According to Sasmal and Chakrabarty [1978], the technique of path co-efficient analysis involves a method of partitioning the total correlation between the response variable and the predict variables into direct effect of independent variables and it’s indirect effects via third variable on response variable. Path co-efficient is simply a standardized partial regression co-efficient and as such measures the direct influence on one variable upon another and permits the separation of the correlation co-efficient into components of direct and indirect effects [Dewey and Lu 1959]. According to Li [1954], path co-efficient analysis is superior to multiple regression analysis, as it is free from effects of measuring unit, whatever be the actual units of measurement for the variables.
In the present study, correlation and stepwise multiple regression were conducted. It was not possible to find out the direct effects and indirect effects separately by the cor-relation test or stepwise multiple regression test. Path co-efficient analysis was applied in order to obtain clear understanding of the direct and indirect effects of selected seven independent variables namely Innovation, potato production knowledge, aspirations, potato problem awareness, group contact, peer relationship and attitude. These were entered into stepwise regression model of farmer’s adoption of potato technologies. Path co-efficient shows the direct and indirect effects of selected seven predict variables with the farmers’ adoption of modern potato production technologies (dependent varia-bles) are presented in Table 6.
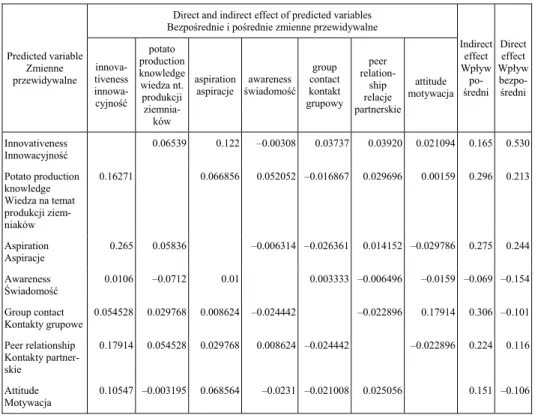
Analysis of data indicate that among the predicted variables, innovativeness had the highest positive direct effect (0.530) on the adoption of potato production technologies by the farmers, followed by aspiration, potato knowledge and peer relationship with a positive and substantial direct effect (0.244, 0.213 and 0.116) respectively. Potato prob-lem awareness, group contact and attitude had negative direct effect on adoption. The variable group contact had the highest (0.306) total indirect effect and potato problem awareness had the lowest (0.69) indirect effects.
Table 6. Path co-efficient showing the direct and indirect effects of selected predicted variables on the adoption of potato production technologies
Tabela 6. Współczynnik cie kowy obrazujący wpływ bezpo rednich i po rednich zmiennych przewidywalnych na zastosowanie technologii produkcji ziemniaków
Predicted variable Zmienne przewidywalne
Direct and indirect effect of predicted variables Bezpo rednie i po rednie zmienne przewidywalne
Indirect effect Wpływ po-redni Direct effect Wpływ bezpo-redni innova-tiveness innowa-cyjnoć potato production knowledge wiedza nt. produkcji ziemnia-ków aspiration aspiracje awareness wiadomoć group contact kontakt grupowy peer relation-ship relacje partnerskie attitude motywacja Innovativeness Innowacyjnoć
0.06539 0.122 –0.00308 0.03737 0.03920 0.021094 0.165 0.530
Potato production knowledge Wiedza na temat produkcji ziem-niaków
0.16271 0.066856 0.052052 –0.016867 0.029696 0.00159 0.296 0.213
Aspiration Aspiracje
0.265 0.05836 –0.006314 –0.026361 0.014152 –0.029786 0.275 0.244
Awareness wiadomoć
0.0106 –0.0712 0.01 0.003333 –0.006496 –0.0159 –0.069 –0.154
Group contact Kontakty grupowe
0.054528 0.029768 0.008624 –0.024442 –0.022896 0.17914 0.306 –0.101
Peer relationship Kontakty partner-skie
0.17914 0.054528 0.029768 0.008624 –0.024442 –0.022896 0.224 0.116
Attitude Motywacja
0.10547 –0.003195 0.068564 –0.0231 –0.021008 0.025056 0.151 –0.106
Source: own calculations from field data.
ródło: obliczenia własne na podstawie bada terenowych.
contribut-ed 1.0 percent to the adoption of potato production technologies with the direct and indi-rect effect negatively and positively. It may be inferred that other variable remaining con-stant, the attitude had substantial indirect effect.
CONCLUSION
From the preceding discussion, out of eleven production technologies for the adop-tion of potato fertilizer applicaadop-tion method is more frequently adopted. It also appears that due to the fact that growers do not use recommended practices, adoption of potato production technologies by the growers in this study is not at satisfactory level. Step-wise multiple regression analysis depicted that seven variables contributed significantly to the adoption of potato production technologies and these are the key factors for adop-tion of potato producadop-tion technologies. Path analysis indicated that those variables had both direct and indirect effects on the adoption. Hence the importance of these variables needs to be recognised and emphasis should be given. Thus it may be concluded that adoption variations in different technologies will not be improved unless effective steps are taken to increase farmers’ exposure to get benefits of using such technologies as per recommendations. Therefore, attempt should be made by the competent authority to arrange motivational programme for increasing innovativeness, and knowledge in rela-tion to potato producrela-tion. An adult educarela-tion and training programme may also help them to increase attitude and other variables.
REFERENCES
BBS. 2010. Yearbook of Agricultural Statistics of Bangladesh. Bangladesh Bureau of Statistics, Planning Division, Ministry of Planning, Government of the Peoples Republic of Bangladesh. Dhaka, Bangladesh.
BES. 2009. Bangladesh Economical Survey. Economical Advisory Section, Finance Division, Ministry of Finance, Government of the Peoples Republic of Bangladesh. June 2009.
Bhuiyan N.I., Parl D.N.R., Jabbar M.A., 2002. Feeding the extra million by 2025. Challenges for Rice Research and Extension in Bangladesh. A Keynote Paper Presented at National Work-shop on Rice Research and Extension 2002. Bangladesh Rice Research Institute, Gazipur, Bangladesh 29-31 January, 2002.
DAE. 2010. A Plan Book of Upazilla-wise Crop Production in Rajshahi District (2009-2010). Department of Agricultural Extension, Office of the Deputy Director, Rajshahi. Bangladesh. Dewey D.P., Lu K.H., 1959. A correlation of and path-coefficient analysis of components of
crested wheat grass seed production. J. Agron. 51, 515-518.
Dropper N.K., Smith H., 1981. Applied regression analysis. Wiley, New York.
Farukh A.H.M., 2007. High Value Food Crop Production Technology Training Module. Dhaka: Project Director, Northwest Crop Diversification Project (NCDP), June 2007, pp.19-22. Hasan M.M., 2003. Adoption of recommended potato cultivation practices by the farmers in some
selected areas of Rajshahi District. M.Sc. Thesis. Department of Agricultural Extension Edu-cation. Bangladesh Agricultural University, Mymensingh, Bangladesh, 8-9.
Li C.C., 1954. Population genetics. The University of Chicago Press, Chicago.
Muttaleb M.A., 1995. Farmers’ preference matching and adoption of modern rice cultivation prac-tices in Haor Area of Northeast Bangladesh.Ph.D. Thesis.Department of Agricultural Extension Education, Bangladesh Agricultural University, Mymensingh, Bangladesh, 208-212.
Netherlands Catalogue of Potato Varieties. 2013. Ed. M.R. Van-Diepan NIVAP, The Nether-lands.
Rashid M.M., 1987. Potato production in Bangladesh. A Consultancy Report Prepared for FAO Regional Office for Asia and the Pacific, Bangkok, Thailand. Tuber Crops Research Center, Bangladesh Agricultural Research Institute, Joydevpur, Gazipur, Bangladesh.
Rogers F.M., 1995. Diffusion of innovations, 5th ed. The free press, New York.
Sasmal B.C., Chakrabarty K., 1978. Correlation and path co-efficient analysis of yield component in mesta (Hibiscus Cannabinus L.). Indian J. Heredity 10(2), 19-26.
WPŁYW RÓ NYCH CZYNNIKÓW NA DOBÓR TECHNOLOGII
PRODUKCJI ZIEMNIAKÓW W PÓŁNOCNO-ZACHODNIM BANGLADESZU
Streszczenie. Poni ej opisane badania zostały podjęte w celu oznaczenia czynników, któ-re mają wpływ na wybór technologii produkcji ziemniaków. Wybory dokonane przez ho-dowców zostały zbadane za pomocą przetworzenia danych dotyczących punktowego oszacowania wła ciwego przygotowania ziemi, uprawy nowej odmiany, zastosowanej dawki nawozu, metody aplikacji nawozu, nawodnienia, rodków ochrony ro lin, jako ci ziarna, technik zmienno-gatunkowych, daty sadzenia, wielko ci nasion i odstępów między rzędami. Dane zebrano od 232 losowo wybranych rolników uprawiających ziemniaki. Zrobiono to przy pomocy ankiety przeprowadzonej ustnie w trzech powiatach dystryktu Rajshahi w Bangladeszu w okresie od lipca 2010 do lutego 2011 roku. Spo ród 11 technik odnoszących się do uprawy ziemniaków, wskazania na nawadnianie jako najistotniejszą z nich znalazły się na 1. miejscu, podczas gdy odległo ci między rzędami na ostatnim. Większoć plantatorów (46,55%) wykazała się rednim wska nikiem zastosowania tech-nik, 29,74% znacznym oraz 23,71% niskim. Na podstawie współczynnika korelacji Pear-sona stwierdzono, e spo ród 22 zmiennych, 16 wykazało istotne pozytywne związki z zastosowanymi technikami produkcji ziemniaków. Wyniki przeprowadzonej krokowej analizy wielokrotnej regresji wykazały, e siedem zmiennych, tj.: innowacyjnoć, wiedza na temat produkcji ziemniaków, aspiracje, wiadomo ć problemów występujących w trakcie produkcji, kontakty grupowe, partnerskie oraz postawa, przyczyniło się w znacznym stopniu do takiego wyniku. Łącznie zró nicowanie osiągnęło 65,30% (cał
o-ci zró nicowania technologii). Analiza o-cie kowa wykazała, e te zmienne wpłynęły za-równo po rednio, jak i bezpo rednio na przyjętą postawę. Hodowcy, którzy odznaczali się znaczną innowacyjno cią, lepszą wiedzą tematyczną i wy szymi aspiracjami, częstszymi kontaktami z członkami zespołu, i z partnerami, oraz wła ciwymi postawami, łatwiej ad-aptowali techniki produkcji ziemniaków.
Słowa kluczowe: zastosowanie, techniki produkcji, ziemniaki, wpływ czynników
Zaakceptowano do druku – Accepted for print: 1.07.2014