1
Economic Efficiency, Allen / Uzama and Morishima
Elasticities of Smallholder Agriculture In Dedza
District, Malawi
Assa M. MAGANGA1* Abdi-Khalil EDRISS1 and Greenwell C. MATCHAYA2
1. Department of Agricultural and Applied Economics, Bunda College of Agriculture, University of Malawi, P.O. Box 219, Lilongwe, Tel. +265999101046, Email: [email protected] “Correspondence” 2. School and Agriculture and Policy Development, University of Reading, UK
ABSTRACT
This paper is an attempt to measure the economic efficiency of Dedza smallholder Irish
potato (Solanum tuberosum) farmers in Malawi using a translog cost frontier,
inefficiency effect model and input Elasticities from Seeming Unrelated Regression Model for asystem of cost share equations for labour, fertilizer, seed and land. A sample of 200 farmers has been considered from Dedza district in Malawi. Results indicate that the mean economic efficiency of Irish potato production in Dedza District is 0.61 with scores ranging between 0.12 and 0.94. The economic efficiency differences are significantly explained by non-farm employment, education, credit access, farm experience, degree of specialization, household size and frequency of weeding. The highest input substitution existed between labour and fertilizer, followed by seed-fertilizer.
Keywords: Allen, Morishima, Economic efficiency, elasticity, Irish potato, Malawi
JEL CLASSIFICATION: D12, D24, O33, Q16
INTRODUCTION
The agricultural sector has always been an important component of the Republic of Malawi’s economy. During the 2000s, agriculture accounted for as much as 35-40 percent of the Gross Domestic Product (GDP), 92 percent of overall employment, over 90 percent of the country’s foreign exchange earnings, provided 64% of total income for rural people and contributed 33.6 percent to the economic growth. Agriculture supports the manufacturing industry by supplying 65% of the raw materials needed. A significant feature of the Malawi’s agriculture is its duality in structure. This dual structure consists of large scale farming, which includes estates sector, and small scale production (GoM, 2007 and Damaliphetsaet.al, 2007).
126 126 126
2
Research has shown that cultivation of horticultural crops is a potential alternative source of income to tobacco which is a major income source for most farmers and an important export earner for the country. In addition to national contribution, horticultural
commodities such as Irish potato (Solanum tuberosum) the potential to contribute to
household nutrition, food security and income (Kachule et al., 2009). Statistics from the Ministry of Economic Planning and Development (MEPD) indicate that on average, the horticulture sector contributes about 22% to the national Gross Domestic Product (GDP) and about 58% within the agricultural sector.
The Malawi government recognizes that expansion of horticultural production for agro-processing is one of the strategies for increasing agricultural productivity. In an effort to enhance performance of the horticulture sector, the government emphasizes developing marketing and agribusiness management skills for the horticulture sector. It is envisaged that such efforts have the potential to contribute to development of horticultural marketing and food processing in Malawi (Kachule et al., 2009). However, such efforts would be undermined by inefficiency in resource use.
Efficiency studies have become more relevant in today’s world especially in Malawi’s agriculture sector which is characterised by resource constraints. The subject of efficiency in Malawi has received considerable attention in the literature (Edriss and Simtowe 2002; Tchale and Sauer 2007; Maganga 2012; Chirwa 2003). However, none of such studies from the study area had estimated economic efficiency and input demand elasticities in Irish potato production. Thus, this study aimed at identifying the socio-economic characteristics of the smallholder farmers, estimating the economic efficiency in Irish potato production among smallholder farmers and calculating input elasticities, Allen and also Morishima technical substitution elasticity of the inputs for cost items such as labor, seedling, fertilizers and land, which play a key role in the production of Irish potato.
METHODOLOGY
Data
The data used in this study were collected from Dedza district in Malawi, which is one of high Irish potato producing districts. Dedza is a district in the Central Region of Malawi. It covers an area of 3,624 km² to the south of the Malawi capital city, Lilongwe, between Mozambique and Lake Malawi with 145,878 households (NSO, 2008). The landscape is a mixture of grassland with granite outcrops, natural woodland and commercial pine plantations on the mountains and some bamboo forest nearer the Lake (DDA, 2001). The wet season is November to April with almost no rainfall at other times. The higher altitudes have moderate temperatures and can be cold in June and July (DDA, 2001).
A Multi-stage sampling technique was undertaken where 200 smallholder Irish potato farmers were selected. The district was clustered into Extension Planning Areas (EPAs)
127 127 127
3
from which one EPA was randomly selected from the District. Secondly, a simple random sampling technique was used to sample two sections from the sampled EPA as secondary sampling units. Thirdly, sections were clustered into villages whereby villages were randomly sampled from each sampled section. Fourthly, from each sampled village, simple random sampling technique was used to select Irish potato farmers proportionately to size (Edriss, 2003). Data were collected using a structured questionnaire and focus group discussions. The questionnaire was designed and pre-tested in the field for its validity and content and to make overall improvement of the same and in line with the objectives of the study. Data were collected on output, input use, prices, socio-economic and institutional variables.
Theoretical and Econometric Construct
The stochastic frontier cost functions model for estimating plot level overall economic efficiency is specified as:
Ci = g (Yi, Wi; α) + εii = 1, 2, …n. [1]
Where Ci represents minimum cost associated with Irish potato production, Yi
represents output produced, Wi represent vector of input prices, α, represents the
parameters of the cost function and εi represents the composite error term. Using
Sheppard’s Lemma we obtain
) , , (W Y α X P C i i = ∂ ∂ [2]
This corresponds to minimum cost input demand equations (Bravo – Ureta and Evenson, 1994 and Bravo- Ureta and Pinheiro, 1997). Substituting a farm’s input prices and quantity of output in equation (2) yields the economically efficient input vector. With observed levels of output given, the corresponding technically and economically
efficient costs of production will be equal to XiiP and XieP, respectively. While the actual
operating input combination of the farm is XiP. These cost measures can then be used
to compute economic efficiency (EE) indices as follows;
EE = (Xie.P) / (Xi.P) [3]
Economic efficiency was measured using stochastic translog cost frontier function for Irish potato production. The function is specified as follows:
∑
= + + + = 4 1 1ln ln ln k i ki ki w y
c α β θ
∑∑
= = + 4 1 4 1 2 2 2 1 ln ln 2 1 k l li ki
kl w x θ y
β
∑
= + 4 1 ln ln k k ky w yβ +vi+ui
[4]
Where lnci represents total input cost of the ith farm, w1 is the average price of kg of
fertilizer, w2 is the average wage rate per man days of labour per day per hectare, w3 is
the price per kg of tuber, w4 is the average rental price and yiIrish potato output. The βs,
128 128 128
4
θs and α are parameters to be estimated. The cost frontier function is estimated
through maximum likelihood methods.
Discovering whether farms are economically efficient might not be important exercises unless an additional effort is made to identify the sources of the inefficiencies. Taking cognisance of this, the study investigated the sources of plot-level economic
inefficiencies for the surveyed farmers. Empirically, the inefficiency model ui is specified
as;
∑
= + = 9 1 0 r ri r i zu φ φ [5]
Where, zi is a vector of farm specific determinants of economic inefficiency, φ are the
inefficiency parameter vectors to be estimated.
The cost share equation for factor i is derived by differentiating the cost function with
respect to lnwi following Chiang (1984):
y w w d c d ky j kj i ln ln ln
ln =α +
∑
β +β[6]
But, using Shephard’s Lemma for the penultimate equality:
i i i i i i s c x w w c c w w c = = ∂ ∂ = ∂ ∂ ln ln [7] Therefore: y w
si =α+
∑
βkjln j +βky [8]To derive the elasticity of factor demand, which is the change in the quantity of factor i
in response to a change in the price of factor j, observe that:
i i i s
w c
x = [9]
) ( log log i i j i j j i kj s w c w x w w x ∂ ∂ = ∂ ∂ = λ [10] = + k i j j k kj i j w s x w w c x w β
(using Shephard’s Lemma)
5
j i kj
j i
kj s
s w
x
+ = ∂
∂
= β
λ
log log
[11]
Allen Elasticity of Substitution (AES) is given as:
1
+ =
j i
ii ij
s s
β
σ [12]
βij = 0, yields an AES of unity. The expression for the own elasticity of factor demand is
(Binswanger, 1974):
1
− + = i
i i
ii
kk s
s s
β
λ [12]
While the corresponding AES is:
i i
i ii
ii s
s
s + −
= β 1
σ [13]
Humphrey and Wolkowitz (1976) suggest the own AES can be interpreted as a change in a factor’s demand responsiveness to a change in its own price. While, the Morishima elasticities of substitution (MES) were estimated from the factor demand elasticities as
kk kj λ
λ − . AES do not indicate the curvature or ease of substitution. They are single input
- price elasticities and do not relate optimal input ratios to those of input prices. Thus, they cannot provide information on the relative input responsiveness to changesin input prices. In contrast, the MES preserve the salient features of the Hicksian concept in the multifactor context and measure theease of substitution. The MES are, therefore, sufficient statistics for assessing the effects of changes in the price on relative factor shares (Blackorby and Rusell, 1989).
RESULTS AND DISCUSSION
Descriptive Statistics
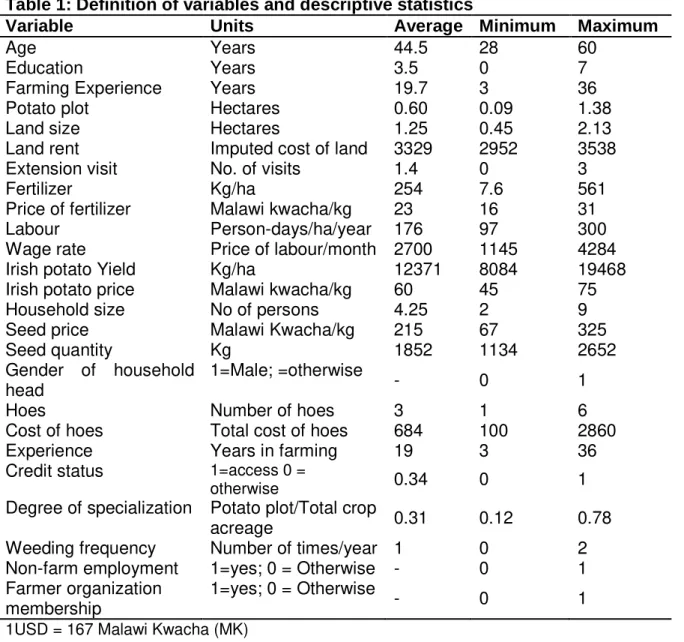
The average statistics of the sampled Irish potato farmers are presented in Table 1. On the average, a typical Irish potato farmer in the district is 45 years old, with 4 years of education, 19 years of farming experience and an average household size of 4.9 persons. The average Irish potato farmer cultivated 0.6 ha, made an average of 1.4 extension contacts in the year, used about 254kg of fertilizer and 1852kg of Irish potato, employed 176 man-days of labour and produced an output of 12371kg of Irish potato per annum. Irish potato production in the district is a male dominated occupation as about 62% of the farmers were males.
130 130 130
6 Estimation of Farm Level Economic Efficiency
The stochastic frontier model is specified for the analysis of economic efficiency of farmers in the production of Irish potato in Dedza district. The stochastic cost frontier in Equation 4 is used to estimate the model. A single stage estimation procedure was applied. The Maximum-Likelihood estimates of the parameters of the Translog frontier cost function are presented in Table 2.
Table 1: Definition of variables and descriptive statistics
Variable Units Average Minimum Maximum
Age Years 44.5 28 60
Education Years 3.5 0 7
Farming Experience Years 19.7 3 36
Potato plot Hectares 0.60 0.09 1.38
Land size Hectares 1.25 0.45 2.13
Land rent Imputed cost of land 3329 2952 3538
Extension visit No. of visits 1.4 0 3
Fertilizer Kg/ha 254 7.6 561
Price of fertilizer Malawi kwacha/kg 23 16 31
Labour Person-days/ha/year 176 97 300
Wage rate Price of labour/month 2700 1145 4284
Irish potato Yield Kg/ha 12371 8084 19468
Irish potato price Malawi kwacha/kg 60 45 75
Household size No of persons 4.25 2 9
Seed price Malawi Kwacha/kg 215 67 325
Seed quantity Kg 1852 1134 2652
Gender of household head
1=Male; =otherwise
- 0 1
Hoes Number of hoes 3 1 6
Cost of hoes Total cost of hoes 684 100 2860
Experience Years in farming 19 3 36
Credit status 1=access 0 =
otherwise 0.34 0 1
Degree of specialization Potato plot/Total crop
acreage 0.31 0.12 0.78
Weeding frequency Number of times/year 1 0 2
Non-farm employment 1=yes; 0 = Otherwise - 0 1
Farmer organization membership
1=yes; 0 = Otherwise
- 0 1
1USD = 167 Malawi Kwacha (MK)
131 131 131
7
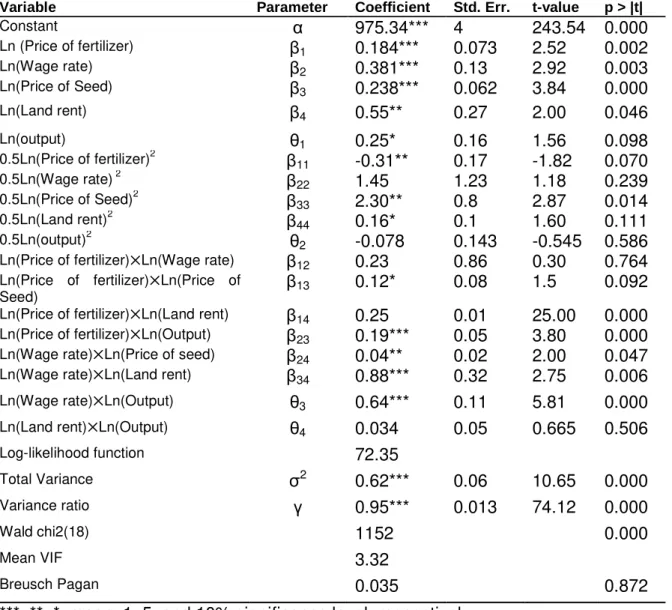
The cost function estimates showed that all the linear terms were significant at different conventional levels. Though some interactive elements were not significant, most of them were significant hence validating suitability of translog model.
Table 2: Estimated Translog Stochastic Frontier Cost Function for Irish Potato in Dedza District, Malawi
Variable Parameter Coefficient Std. Err. t-value p > |t|
Constant α 975.34*** 4 243.54 0.000
Ln (Price of fertilizer) β1 0.184*** 0.073 2.52 0.002
Ln(Wage rate) β2 0.381*** 0.13 2.92 0.003
Ln(Price of Seed) β3 0.238*** 0.062 3.84 0.000
Ln(Land rent) β4 0.55** 0.27 2.00 0.046
Ln(output) θ1 0.25* 0.16 1.56 0.098
0.5Ln(Price of fertilizer)2 β11 -0.31** 0.17 -1.82 0.070
0.5Ln(Wage rate) 2 β22 1.45 1.23 1.18 0.239
0.5Ln(Price of Seed)2 β33 2.30** 0.8 2.87 0.014
0.5Ln(Land rent)2 β44 0.16* 0.1 1.60 0.111
0.5Ln(output)2 θ2 -0.078 0.143 -0.545 0.586
Ln(Price of fertilizer)⨉Ln(Wage rate) β12 0.23 0.86 0.30 0.764
Ln(Price of fertilizer)⨉Ln(Price of
Seed) β13 0.12* 0.08 1.5 0.092
Ln(Price of fertilizer)⨉Ln(Land rent) β14 0.25 0.01 25.00 0.000
Ln(Price of fertilizer)⨉Ln(Output) β23 0.19*** 0.05 3.80 0.000
Ln(Wage rate)⨉Ln(Price of seed) β
24 0.04** 0.02 2.00 0.047
Ln(Wage rate)⨉Ln(Land rent) β
34 0.88*** 0.32 2.75 0.006
Ln(Wage rate)⨉Ln(Output) θ
3 0.64*** 0.11 5.81 0.000
Ln(Land rent)⨉Ln(Output) θ4 0.034 0.05 0.665 0.506
Log-likelihood function 72.35
Total Variance σ2 0.62*** 0.06 10.65 0.000
Variance ratio γ 0.95*** 0.013 74.12 0.000
Wald chi2(18) 1152 0.000
Mean VIF 3.32
Breusch Pagan 0.035 0.872
***, **, *, mean, 1, 5, and 10% significance level, respectively
The Maximum Likelihood (ML) estimates of the stochastic frontier Translog cost
parameters for Irish potato are presented in Table 2. For the cost function, the sigma (σ2
= 0.62) and the gamma (γ=0.95) are quite high and highly significant at 1.0% level. The
132 132 132
8
high and significant value of the sigma square (σ ) indicates the goodness of fit and
correctness of the specified assumption of the composite error terms distribution (Idiong, 2005).
In addition, the Wald chi-square statistic for joint test of the model indicates that the model is significant (p <0.01), overly. There was tolerable level of multicollinearity justified by a mean VIF of 3.32 <10 (Edriss, 2003). The homoskedasticity hypothesis was also satisfied as indicated by Breusch Pagan chi-square estimate of 0.035 (p>0.1).
The gamma (γ = 0.95) shows that 95% of the variability in the output of Irish potato
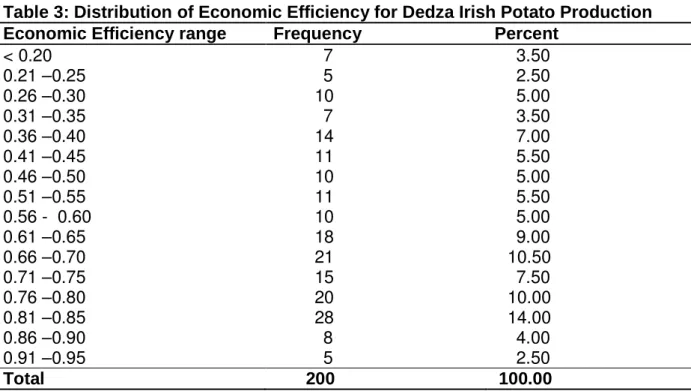
farmers that are unexplained by the function is due to economic inefficiency. The predicted economic efficiencies (EE) estimated as inverse of cost efficiencies differs substantially among the farmers, ranging between 0.12 and 0.94 with a mean EE of 0.61. This means that if the average farmer in the sample area were to reach the EE level of its most efficient counterpart, then the average farmer could experience a cost saving of 35 percent [i.e. 1-(0.61/0.94)x100].The same computation for the most economically inefficient farmer suggests a gain in economic efficiency of 87 percent [i.e. 1- (0.12/0.94x100].
Table 3: Distribution of Economic Efficiency for Dedza Irish Potato Production Economic Efficiency range Frequency Percent
< 0.20 7 3.50
0.21 –0.25 5 2.50
0.26 –0.30 10 5.00
0.31 –0.35 7 3.50
0.36 –0.40 14 7.00
0.41 –0.45 11 5.50
0.46 –0.50 10 5.00
0.51 –0.55 11 5.50
0.56 - 0.60 10 5.00
0.61 –0.65 18 9.00
0.66 –0.70 21 10.50
0.71 –0.75 15 7.50
0.76 –0.80 20 10.00
0.81 –0.85 28 14.00
0.86 –0.90 8 4.00
0.91 –0.95 5 2.50
Total 200 100.00
And to give a better indication of the distribution of the economic efficiencies, a frequency distribution table of the predicted economic efficiency scores is presented in
133 133 133
9
Table 3. The frequencies of occurrence of the predicted economic efficiency scores indicate that the highest number of farmers have economic efficiencies between 0.81 – 0.85, representing about 14 percent of the respondents while about 57 percent of the respondents have EE of 0.61 and above which is an indication that farmers are fairly efficient. That is, the farmers are fairly efficient in producing a pre – determined quantity of Irish potato at a minimum cost for a given level of technology.
Factor Demand Elasticities
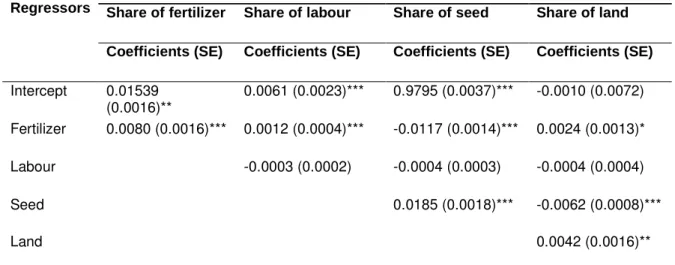
The parameters of the system of cost share equations for labour, fertilizer, seed and land were estimated using Seemingly Unrelated Regression (SUR) technique of (Zellner, 1962). The parameters could be estimated using the ordinary least squares (OLS). However, OLS estimation would yield inefficient results because of the restrictions imposed and the correlation of the error terms across the systems of equations (Zellner, 1962). Breusch Pagan test gave a value of 45.23 (p <0.1) suggesting that the residuals of the estimated cost share equations were correlated, thus using the seemingly unrelated regression technique was appropriate. As the sum of the shares is equal to one and therefore the system is not linearly independent, one of the cost share equations was dropped. The estimated results are presented in Table 4. The coefficients for the price variables in the cost share equations are represented by the diagonal coefficients in Table 4.
Table 4: Parameter estimates - Seemingly Unrelated Regression Results
Regressors
Inputs
Share of fertilizer Share of labour Share of seed Share of land Coefficients (SE) Coefficients (SE) Coefficients (SE) Coefficients (SE) Intercept 0.01539
(0.0016)**
0.0061 (0.0023)*** 0.9795 (0.0037)*** -0.0010 (0.0072) Fertilizer 0.0080 (0.0016)*** 0.0012 (0.0004)*** -0.0117 (0.0014)*** 0.0024 (0.0013)* Labour -0.0003 (0.0002) -0.0004 (0.0003) -0.0004 (0.0004)
Seed 0.0185 (0.0018)*** -0.0062 (0.0008)***
Land 0.0042 (0.0016)**
In parentheses are standard errors (SE); ***, ** and * denote 1%, 5% and 10% significant levels, respectively.
134 134 134
10
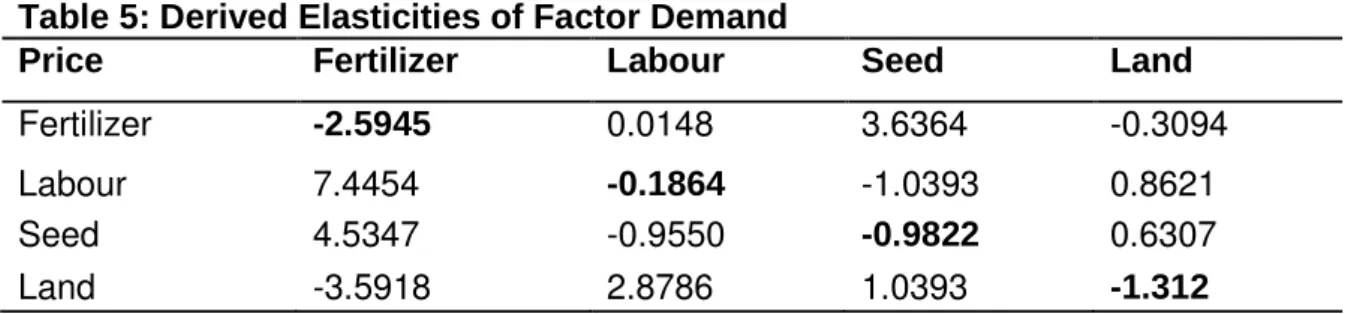
Elasticities of input demand in Irish potato, calculated from the cost share system of equations, are given in Table 5. Own price elasticities of fertilizer, seedling, labor and land of Irish potato were estimated by Irish potato input demand model as 2.595, -0.186, -0.982 and -1.312, respectively. Own elasticities of fertilizer and land were elastic and of seedling and labour were inelastic. Ten percent (10%) increase in fertilizer, labour, seedling and land prices will decrease the demands of these inputs by 25.95, 1.86, 9.82 and 13.12%, respectively.
Table 5: Derived Elasticities of Factor Demand
Price Fertilizer Labour Seed Land
Fertilizer -2.5945 0.0148 3.6364 -0.3094
Labour 7.4454 -0.1864 -1.0393 0.8621
Seed 4.5347 -0.9550 -0.9822 0.6307
Land -3.5918 2.8786 1.0393 -1.312
According to these values, in case of price increase in inputs, the farmer will give up the input of fertilizer the easiest, and this will be followed by land, seedling and labour, respectively. Labor prices had the hardest elasticity among the inputs used for Irish potato production.
A positive sign between two inputs shows substitution relationship between them, while negative sign between them shows complementary relationship. The cross-price effects between seed and labour and between fertilizer and land were negative, suggesting that these pairs of purchased inputs were complements. The rest of the derived cross-price elasticities of factor demand were positive. Cross price elasticity of fertilizer and labour, fertilizer and land, seed and labour, and between seed and land were inelastic. The highest substitution was between labour and fertilizer, followed by seed-fertilizer.
Ten percent increase in fertilizer price increases labour demand by 74.5%, while 10% increase in labour price increases fertilizer demand by 0.15%. Ten percent increase in fertilizer price increases seed demand by 45.3%, while 10% increase in seed price increases fertilizer demand by 36.3%. Ten percent increase in fertilizer price decreases land demand by 35.9%, while 10% increase in land rent decreases fertilizer demand by 3%. This shows strong complementary relationship between fertilizer and land. Ten percent increase in labour wage decreases seed demand by 9.5%, and 10% price increase in seed decreases labour demand by 10%. 10% increase in land rent will increase labour and seed demands by 8.6% and 6.3%, respectively. A 10 percent increase in the wage and price of seed increase demand for land by 28.9% and 10.4%, respectively.
135 135 135
11
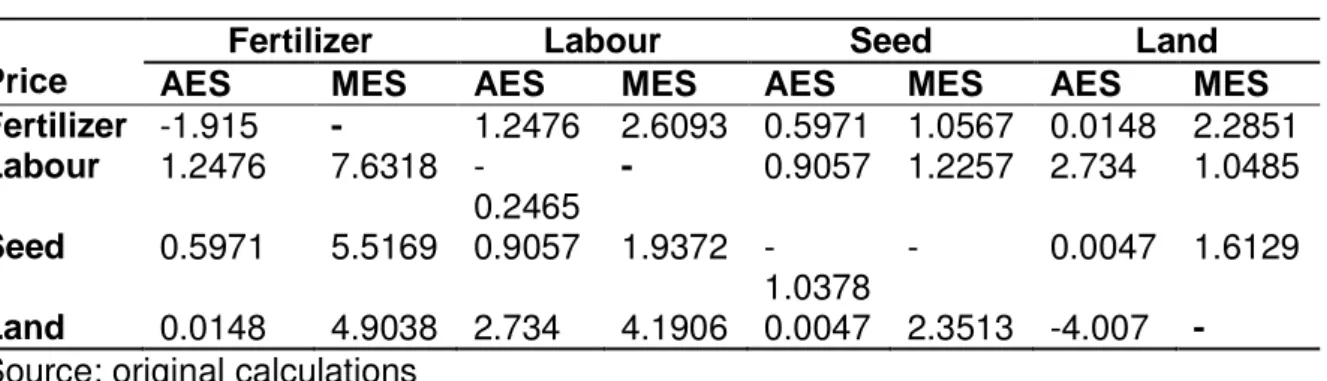
Morishima Technical Substitution Elasticities (MES) are shown in Table 6. As can be
seen in the table, the substitution elasticities are higher than zero. Accordingly, it is understood that there is an incomplete substitution between all input pairs in Irish potato production. Here, technical substitution elasticity between labour and fertilizer was found as 7.63. If fertilizer prices increase when labour prices are stable, fertilizer use will decrease, and more seedlings (the production factor with lower cost) will be used instead. The decrease in the use of labour will be 7.63% of labour-fertilizer use ratio. Similarly, the decrease in fertilizer use will be 5.52% of seed-fertilizer use ratio, or 4.9% of land-fertilizer use ratio. A similar situation is also valid for the other inputs, and it appears that these inputs are substitutable inputs, one for the other, for Irish potato.
Table 6: Allen/Uzama and Morishima Elasticities of Factor Substitution
Price
Fertilizer Labour Seed Land
AES MES AES MES AES MES AES MES
Fertilizer -1.915 - 1.2476 2.6093 0.5971 1.0567 0.0148 2.2851
Labour 1.2476 7.6318 -0.2465
- 0.9057 1.2257 2.734 1.0485
Seed 0.5971 5.5169 0.9057 1.9372 -1.0378
- 0.0047 1.6129
Land 0.0148 4.9038 2.734 4.1906 0.0047 2.3513 -4.007 -
Source: original calculations
The Allen Elasticities of Substitution are also presented in Table 6. The Allen partial elasticities of substitution (AES) were calculated at the sample mean of the cost shares for Irish potato production. Positive signs indicate substitution relationships between any pair of inputs. A strong substitution relationship was found between land and labour.
With respect to the sources of efficiency in Table 7, the coefficients of extension visits, education and farm experience were statistically significant at least at 5% significance level. These findings are similar with those of Wadud (2000) and Nwachukwu (2006).With education, farmers have high aptitude to learn and understand new information about farming technologies and calculate gross margins. While with experience, farmers improve on previous flows they had. In contrast with priori, extension visits decreased economic efficiency. This could be attributed to low extension – farmer ratio in Malawi, in which case, the effectiveness of extension advice is undermined. Non-farm employment significantly reduced economic efficiency among Irish potato farmers. Most probably, it competes with family labour supply to the Irish potato farms. Possible alternative to non-farm employment could be improving access to credit. Credit access increased economic efficiency (p<0.01). Degree of specialization and household size significantly increased economic efficiency (p<.01). Degree of specialization enables the farmer to enjoy economies of scale, spread the
136 136 136
12
costs over a large output. Household size is mostly a source of cheap labour that helps to cut on production costs. Weeding was very crucial in the study area as it increased economic efficiency (p<0.01). Programs that encourage farmers in increase their frequency of weeding would be enhance economic efficiency among Irish potato smallholder farmers.
Table 7: Determinants of Economic Inefficiency of Irish Potato Production Variable Coefficient Std. Err. t-value p-value
Intercept term 0.108 0.321 0.336 0.737
Non-farm employment 0.620*** 0.127 4.88 0.000
Education -0.182** 0.074 -2.4594 0.014
Extension visits 0.021*** 0.006 3.5 0.001
Credit status -1.543*** 0.499 -3.092 0.002
Farm Experience -0.897*** 0.275 -3.261 0.001
Degree of specialization
-0.053*** 0.008 -6.625 0.000
Age 0.145 0.449 0.3229 0.747
Household size -0.194*** 0.060 -3.233 0.001
Frequency of weeding -0.164* 0.97 -0.169 0.866
Values in parenthesis are standard errors.*,** and *** means significant at 10%, 5% and 1% levels,
CONCLUSION AND POLICY IMPLICATIONS
The study analyzed economic efficiency and input elasticities among Irish potato farmers in Dedza district, Malawi, using the stochastic translog cost and Seemingly Unrelated Regression (SUR) model. The findings of the study showed that Irish potato farmers in Dedza district are not operating at full economic efficiency level, but opportunities exist for improvement of economic efficiency by the Irish potato farmers. Education, credit access farm experience, degree of specialization, household size and frequency of weeding increased economic efficiency. Credit should be extended to Irish potato farmers to enable them to purchase farm inputs. Non-farm employment led to misallocation of the resources employed by Irish potato farmers. Therefore, there is need for households to be linked to microfinance institutions for credit access which can take the place of non-farm employment.
REFERENCES
Blackorby, C. Russell, R.R., (1989) Will the real elasticity of substitution please stand up? A comparison of the Allen/Uzama and MorishimaElasticities. American Economics Review. 79, 882 – 888.
137 137 137
13
Bravo-Ureta, B.E., Pinheiro, A., (1997) Technical, economic and allocative efficiency in peasant farming: Evidence from Dominica Republic. The Developing Economics, xxxv-1, 48-67.
Bravo-Ureta, B.E., Evenson R.E., (1994) Efficiency in agricultural production: The case of peasant farmers in Eastern Paraguay. Agricultural Economics 10 (1): 27 – 37. Binswanger, H., (1974) A cost function approach to the measurement of elasticities of
factor demand and elasticities of Substitution. American Journal of Agricultural Economics, 56(2).
Chiang, A.C. (1984) Fundamental methods of mathematical economics. 3rd ed. McGraw-Hill.
Chirwa, E.W., (2002) Sources of technical efficiency among smallholder maize farmers in Southern Malawi. Work in progress report presented at the biannual research workshop organised by the African Economic Research Consortium, Durban, South Africa, December.
Damaliphetsa, A.M., Kaunda, E.K.W., Makwenda, B., Suliwa, J. Chilongo, T. (2007) Analysis on agriculture policy. Report submitted to the Malawi lake basin programme (MLBP).
Edriss, A.K. (2003). A passport to research methods. International Publishers and Press, Las Vegas.
Edriss, A.K., Simtowe, F., (2002) Technical efficiency in groundnut production in malawi: An application of a frontier production function. UNISWA Journal, 45-60. GoM (Government of Malawi). (2007) Economic report. Ministry of economic planning
and development, Lilongwe, Malawi.
Humphrey, D., Wolkowitz, B., (1976) Substituting intermediates for capital and labour with alternate functional forms: An aggregate study. Applied Economics, 8.
Kachule, R., Franzel, S. (2009) The Status of fruit production, processing and marketing
in malawi.working. Paper 87. Nairobi: World Agroforestry Centre.
Maganga, A.M., (2012) Technical efficiency and its determinants in irish potato production: evidence from Dedza District, Central Malawi. African journal of agricultural research, 7(12), 1794-1799.
Nwachukwu, I.N., (2006) Efficiency of vegetable production in Imo State. The Case of Fadama Telfairia Occidentadis .M.Sc Thesis, Department of Agricultural Economics, Michael Okpara University of Agriculture, Umualike, Abia State, Nigeria.
Ray, S., (1988) Data envelopment analysis, non discretionary inputs and efficiency: An alternativeinterpretation. Socio- Econom Plann Sci, 22: 167- 176.
Tchale, H. and Sauer, J., (2007). The efficiency of maize farming in Malawi: A
bootstrapped translog frontier. Cahiers d’économieetsociologierurales, n° 82-83
Sharma, K.R.P., Leung, P. and Zaleski, H.M., (1999) Technical, allocative and economic efficiencies in Swine production in Hawaii: A Comparison of parametric and nonparametric approaches. Agricultural Economics, 20: 23-35.
138 138 138
14
Wadud, A.B., (2000) White farm house hold efficiency in Bangladesh: A comparison of stochastic frontier and dea methods. Applied Economics. 32: 1665 – 1673.
Zellner, A. (1962) An efficient method of estimating seemingly unrelated regressions and tests for aggregation bias. Journal of American Statistics Association. 57: 348 – 368.
139 139 139