A High-productivity Computational Tool to Model
and Calculate Railway Catenary Support Structures
Ruben Saa, Alberto Garcia, Carlos Gomez, Felix Garcia-Carballeira, and Jesus Carretero
Abstract—This paper introduces a novel approach in order to design and calculate railway overhead infrastructure on com-mon and high speed railway lines. Recently, railway companies are promoting the construction of electric railway networks, based on overhead wires. Deployment of such networks involves the design of complex structures to support the wires. We propose a set of models to represent railway domain elements, such us portal frames, poles, foundations, cantilevers, and wires. We use them to compose a structure as a set of interconnected bars, nodes and loads, and rely on the direct stiffness method (DSM) to calculate stresses and displacements of each node. These models also include equations to verify the integrity and feasibility of the designed structure. According to the proposed approach, a high-productivity computational tool has been developed, thus allowing users a fast design, calculation and verification of the previous mentioned elements. The tool exploits the parallelism of current computers to carry out multiple calculations concurrently, outperforming current ways of designing and calculating railway overhead infrastructure.
Index Terms—Railway catenary infrastructure, structural
modeling and calculus, direct stiffness method, high-productivity tool
I. INTRODUCTION
Since the mid-twentieth century, railway companies tend to deploy overhead lines as a mechanism to supply energy to electric locomotives [11]. Clemow shows in [3], that electric traction and in particular the use of the catenary, has several advantages over diesel and other kinds of traction, as it performs a higher power-to-weight ratio, resulting in a faster acceleration and a higher practical limit of power. This fact allows railway companies to use powerful locomotives and more traffic over the tracks (see [7]).
In spite of its advantages, railway electrification through overhead lines, requires significant capital expenditure re-garding the installation. As Crompton and Wallace show in [5], a very large proportion of the electrification cost in a railway construction project is spent on the deployment of overhead equipment, like wires, cantilevers, poles, founda-tions, and portal frames. Deployment process includes the following tasks:
1) To place structures along the track stretches. This may include a ground projection of the elements and an analysis of geography, climate, and terrain.
2) To design supporting elements, like poles and portal frames, in order to withstand the main catenary infras-tructure members (wires and cantilevers). Moreover,
Manuscript received February 14, 2012; revised February 25, 2012. This work has been partially funded by the Spanish Ministry of Science and Innovation under the grant TIN2010-16497.
Author details: R. Saa ([email protected]), A. Garcia ([email protected]), C. Gomez ([email protected]), F. Garcia-Carballeira ([email protected]), and J. Carretero ([email protected]) are with the Computer Science and Engineering Department. University Carlos III of Madrid, Leganes, Madrid (Spain). Tel.: +34 916249452.
these supporting elements must deal with extreme conditions, like strong winds and ice overload. Since the second task is performed once per each pole or portal frame deployed, engineers must carry out a laborious structural analysis, with calculations of complex structures. Several methods are currently used to perform structural analysis, but they require specialized personnel with skills in structural engineering. For example, in order to analyze buckling in lattice structures, Hopkins [8] uses a simplified model, and Moreau [9] proposes a continuum modeling approach. In addition to this point, designing a portal frame may need a few days, if it is hand-calculated, or several hours if a structural engineer is aided by a software tool in order to design and calculate the whole structure.
The overhead contact line, hereinafter also called catenary, is assembled considering a range of spans of about 60 m in length, normally between 15 and 20. Each of them is supported by a pair of poles, thus leading to more than 30 poles per km in two-way standard tracks. At railway stations, the number of tracks is increased and the space is limited, so poles are replaced with portal frames, thus allowing simultaneous support for multiple close-located catenaries, through a single structure. As there may be several hundreds of catenary structures per project, a substantial effort for structural engineers part is needed, as they can not design and develop a single common calculus solution.
Some research concerning structural calculus over portal frames, poles, trusses, cantilevers, etc., has been developed. Finite element method (FEM) [10], presented by Courant in [4], is mainly used to carry out the task of calculating support structures, obtaining stresses and displacements at any point. Direct stiffness method (DSM) [12] is the most common implementation of FEM. For example, Benet [2] uses FEM to model pantograph-catenary interaction. Both FEM and DSM have been included in a lot of software tools in order to automate structural calculus [6], thus avoiding mistakes due to hand-calculation. Alberto [1] uses the model described in [2] to implement a high peformance tool to simulate pantograph-catenary interaction.
for calculating catenary support structures can be provided. In this paper, we present a tool that allows engineers to design and calculate complex railway structures in few seconds. We also propose a method to model complex structures in the field of railway overhead lines. We focus on the following railway elements: poles, portal frames, foundations, cantilevers, and catenaries. A calculus model, containing an idealization of every catenary support element and based on direct stiffness method, is presented. Structural restrictions and feasibility conditions are also considered in the calculus process, so that the solutions obtained are valid in terms of material resistance and construction regulations. All these proposals are integrated in a software tool that may work with the inventory of railway companies.
The paper is organized as follows. Section II shows the procedure to design and calculate a single support structure. Section III describes how the procedure has been enhanced to provide high-performance. Section IV introduces the software tool and Section V provides some experimental evaluations. Finally, Section VI shows some conclusions and future work.
II. COMPUTING A CATENARY SUPPORT STRUCTURE
Processing and calculating railway catenary support struc-tures lead to model poles and lintels as bar elements intercon-nected at nodes. If so, direct stiffness method can be used to resolve the defined structure. Since loads applied to a whole structure may exist on both the track perpendicular plane and the track parallel plane, the chosen model should be a three-dimensional one. Most loads, though, are essentially planar, i.e., there are not significant loads out of the track perpendicular plane. Moreover, a 3D-structure analysis and calculation needs a high computation time, so a 2D-model, which has a better performance, is considered in this paper. In order to obtain a solution for a single structure, we need to find:
1) A valid design for all the cantilevers. 2) A feasible bar assembly of poles and lintels. 3) A valid choice for every foundation.
Three main problems arise from this modeling and calcu-lating task.
Firstly, the designed structures are very heterogeneous, i.e., they have their own characteristics and constraints, with regard to the track route, the catenaries to be held, the hy-pothesis of non-permanent-action loads, or the construction regulations. This problem prevents structural engineers from developing a single common calculus solution.
Secondly, applying DSM is a laborious and complex task, owing to the size of the set of equations generated. For example, when analyzing a standard portal frame, that is formed by a 40-meters-span truss lintel and two truss poles, a 2D-model with 285 bars is obtained (169 bars belonging to the lintel and 58 bars per pole). This composition entails a 402x402 global stiffness matrix. Moreover, loads and feasibility verification formulas with their safety coefficients, must be considered in order to resolve the whole structure.
Thirdly, depending on the inventory size which the system is linked to, the set of combinations where a feasible solution can be found, may be very large. For example, having 6 lin-tels, 43 poles, 25 foundations, and 9 cantilevers, catalogued
Algorithm 1ComputeStructure
Input:si, L, P, F, C
Output:si, f easibleSolution
1: for all(cantilever∈si)do
2: si.cantilever.value←GetV alidDesign(si, C)
3: end for
4: f easibleSolution←f alse
5: while (f easibleSolution == F ALSE) & ((si.assembly ←
GetAssembly(si, L, P))6= 0)do
6: barsXplane←0;
7: for all(lintel∈si.assembly)do
8: lintelBars←GenerateLintelBarM odel(lintel)
9: barsXplane←[barsXplane, lintelBars]
10: end for
11: for all(pole∈si.assembly)do
12: posteBarsXplane←GenerateP oleBarM odel(pole)
13: barsXplane←[barsXplane, posteBarsXplane]
14: barsZplane[pole]←GenerateP oleBarM odel(pole)
15: end for
16: DSM(barsXplane)
17: for all(pole∈si.assembly)do
18: DSM(barsZplane[pole])
19: end for
20: barsF easibilityXplane←T RU E 21: for all(bar∈barsXplane)do
22: barsF easibilityXplane ←
CheckStructuralF easibility(bar) &
barsF easibilityXplane 23: end for
24: barsF easibilityZplane←T RU E 25: for all(pole∈si.assembly)do
26: for all(bar∈barsZplane[pole])do
27: barsF easibilityZplane ←
CheckStructuralF easibility(bar) &
barF easibilityZplane
28: end for
29: end for
30: lintelF easibility←T RU E 31: for all(lintel∈si.assembly)do
32: lintelF easibility ← CheckDef lection(lintel) &
lintelF easibility 33: end for
34: f easibleSolution ← barsF easibilityXplane &
barsF easibilityZplane & lintelsF easibility 35:end while
36:for all(f oundation∈si)do
37: f oundationF easibility←F ALSE
38: while (f oundationF easibility == F ALSE) &
((si.f oundation.value ← GetN extDesign(si, F)) 6= 0)
do
39: f oundationF easibility ←
CheckOverturning(si.f oundation.value) &
CheckSubsidence(si.f oundation.value)
40: end while
41: f easibleSolution ← f oundationF easibility &
f easibleSolution 42:end for
in the inventory, the number of possible combinations for a standard portal frame (a lintel, two poles, and 4 cantilevers) is 18280.
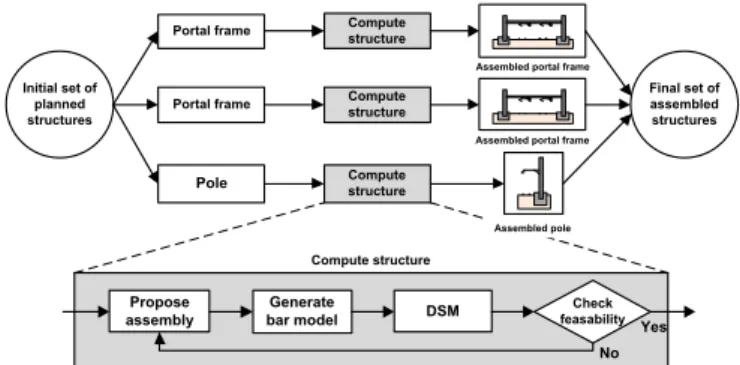
Considering these three issues, a hand-calculation of the structure might result in human mistakes, besides being unfeasible in terms of time and effort invested. Thus, experts approach to this problem imposing severe constraints that limit the solution space and reduce the structures chosen to a very narrow subset. To overcome this limitations, the tool provides an algorithm, named ComputeStructure, that is in charge of modeling and computing a single catenary support structure. From the inventory I and the structure
si, the algorithm carries out the step sequence described in
Algorithm 1. As may be seen, the main actions are:
• Designing cantilevers per each structure; proposing a specific assembled structure, including lintels and poles.
• Applying DSM to the 2D model of the structure gener-ated, to compute stress and displacements at any point of the bars.
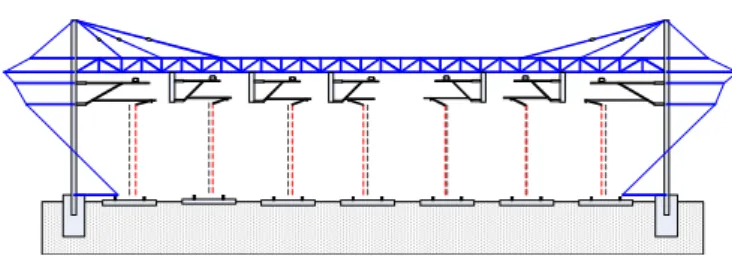
condi-Fig. 1. Planned portal frames and poles within a railway project
tions to all bars. If the proposed assembly is not feasible, the process goes to step 2 again to look for a new struc-ture composition, i.e., as many assemblies as necessary will be calculated until finding the feasible one. When a feasible assembly of bars is found, a specific and valid component of F, is assigned to every foundation and anchor foundation. This step is executed once per each structure si. The algorithm finishes when a valid
combination is found, or when all the combinations have been tested and no one resulted in a feasible solution. The algorithm proposed is computationally complex. On the one hand, generating a feasible solution entails the com-bination with repetition of the railway company inventory components per each element existing in the structure (lin-tels, poles, foundations, and cantilevers). The criteria used to choose these component combinations are based, not only on height restrictions of the catenaries situated under the portal frame, but also on a cost-optimization approach in terms of minimum weight design. According to this approach, the components are selected from the lowest to the highest weight until the whole structure is feasible. On the other hand, DSM consists of resolving a set of equations through matrix algebra. Summarizing, we have to model each bar of the structure applying Eq. (1) to each bar, where each k is a stiffness matrix. Stiffness matrices of all the bars must be combined, as they are connected to form the structure. The more complex a structure is, the higher the number of bars is, thus resulting in both a high use of memory and a high computational effort.
q=k·δ (1)
Then, the effect of external loads in bars and nodes must be calculated through effort laws and displacement laws of each bar. This is necessary to know the structural behavior of the catenary support structure. Effort laws of each bar are presented in Eq. 2, 3, 4. Displacement laws of each bar are presented in Eq. 5, 6.
N(x) =N−X
i
Fixhx−xbii
0 −X
i
qix
h
hx−xeii
1
− hx−xf ii
1i
(2)
T(x) =T−X
i
Fiyhx−xaii
0 −X
i
qiy
h
hx−xcii
1
− hx−xdii
1i
(3)
Mz(x) = −M−
X
i
mihx−xgii
0
+X
i
Fiyhx−xaii
1
+ X
i
qiy
2 h
hx−xcii
2
− hx−xdii
2i
(4)
u(x) = u(0) + N
EAx−
X
i
Fix
EAhx−xbii 1
− X
i
qix
2EA
h
hx−xeii
2
− hx−xf ii
2i
(5)
v(x) = v(0) +v′(0)x−X
i
mi
2EIz
hx−xgii
2
+ T
6EIz
x3+X
i
Fiy
6EIz
hx−xaii
3
+ X
i
qiy
24EIz
h
hx−xcii
4
− hx−xdii
4i
(6)
In this section, the process of calculating a single catenary support structure has been presented. Nevertheless, when designing a real rail work project, such as planning the infrastructure of a railway station, or allocating all the poles along a 50 km. track stretch, many structures may be needed. Fig. 1 shows an example of a planned project containing a few portal frames and single poles. All things considered, if all the structures within a project are desired to be calculated, the computational effort would increase enormously. This fact presents a new issue to be analyzed.
III. HIGH PRODUCTIVITY COMPUTATIONAL CALCULUS
Depending on the problem size, there may be several hundreds of catenary structures per project with heteroge-neous design features. Moreover, as every complex single structure is generated, the model of bars and nodes has a different size for the global stiffness matrix. This fact results in a calculation time that may range from seconds to a few minutes. So, concerning the computational complexity, the higher the number of catenary support structures within a
Portal frame
Portal frame
Pole
Initial set of planned structures
Compute structure
Compute structure
Compute structure
Assembled portal frame
Assembled portal frame
Assembled pole
Propose assembly
Check feasability
Generate
bar model DSM
No Yes
Compute structure
Final set of assembled structures
Fig. 3. Assembled portal frame modeled and calculated by the tool
project, the greater the computational effort for a computer. In order to cope with this issue, we propose a new approach that exploits the ability of current computers to run tasks concurrently. Recently, the number of cores in computers has been increasing, so different structural calculus might be fulfilled in different threads at the same time, thus optimizing the overall performance.
Fig. 2 shows how a complex design problem is tackled in the software tool, and how several structural calculus can be performed simultaneously. We start from the assumption that the initial set of planned structures have their own features and are independent of each other. If so, the process of calculating a single catenary support structure can be assigned to a calculating task. At the end of the process, every assembled solution is obtained by its assigned task. Owing to this task independency, a coarse-grained paral-lelism technique has been adopted, i.e., a thread is in charge of computing a structure. This design allows to dispatch each thread to a core when using multi-core computing, so that the tasks can run concurrently. A new extension of the
ComputeStructure algorithm, shown in Algorithm 2, allows
engineers to calculate as many single structures as there are within a project.
Algorithm 2 ComputeNStructures
Input: W, L, P, F, C 1: for all(si∈W)do
2: StartT hread{ComputeStructure(si, L, P, F, C)}
3: end for
IV. SOFTWARE TOOL
A software tool has been implemented in C#, so as to automate the algorithms of modeling and calculating railway catenary support structures.
This tool is oriented to the computer-aided design of rail-way infrastructures. Through an user-friendly interface, users are able to design real rail work projects in detail, defining and modifying the elements that are planned (length and direction of track stretches, type and mechanical tension of overhead wires, catenary height, cantilevers, poles and portal frames and their location along the tracks, etc.). Moreover, the tool works with the railway company inventory, so the components and materials of its stock list are included in the developed software.
Concerning structural calculus, the tool gathers all the information related to each catenary support structure in the project, and it is able to perform its calculation process, allowing for structural restrictions and European railway companies regulations. Since the tool is desired to be inter-active, users are always informed about the results obtained.
Fig. 4. Portal frame bending moment obtained by the tool
On the one hand, if a feasible solution is achieved, the assembled structure is presented showing the following information:
• A 2D-visualization of X-plane, including the elements
that compound the structure. The user is able to identify the specific components per element that were used in the calculation process of the solution obtained. Fig. 3 shows an example of a truss portal frame that leans on two beam poles. As may be seen, the portal is completely designed.
• Numerical results of the calculation process are also presented. Users can access detailed information at any point of the modeled bars: axial and shear stresses, bending moments, and displacements. Their maximum and minimum values are also obtained and located at specific points in the assembled structure, so that users can analyze its structural behavior. Besides, different diagrams are also used to represent graphically these numerical values. An example may be seen in Fig. 4.
• Z-plane calculus information of each pole belonging to
the structure. By right-clicking on a pole, the user is able to know its structural behavior under the influence of Z-plane loads.
• Overturning moments and compression forces of foun-dations where poles are embedded in.
• Tension of wires used to hold the lintels under a feasible deflection. Their location along the lintel is also provided.
• A 3D view of the portal frame designed, as shown in
Fig. 5, including all the elements of the structure, plus terrain, light and viewing effects.
On the other hand, if the tool was not able to find a feasible solution, the user is informed about the reasons why the structure is not valid: lintel over-deflection, bar
collapse, foundation subsidence, etc. The tool also shows graphic information, as will for a feasible solution. Invalid elements are identified with a different color, so that users can analyze where and why the structure is collapsing.
The tool is also conceived as an integrated approach, i.e., its scope does not focus only on the modeling and implementation of DSM, but also concerns other areas of railway domain. First, the tool allows to design different pantograph models. Second, once the track infrastructure and the catenary configuration have been defined, the tool is also suited to run some simulations. The aim is to analyze the pantograph-catenary interaction with different configurable parameters (type of pantograph, train and wind speed, wind force direction, mechanical tension of overhead wires, track camber, etc.).
V. EXPERIMENTAL RESULTS
In this section we outline the experimental results obtained by using our railway catenary infrastructure model, and the computational tool that implements it.
By way of illustration, only the results of two study cases are presented herein. The first case consists of calculating a portal frame, with a 30-meters-span truss lintel supported by two beam poles. The aim is to outline the feasibility and relevance of our model. The second case is a massively calculation of an entire railway project, with large number of poles, portal frames, and half portal frames. They must be calculated independently of each other, so we can not develop a single common solution. The computational efficiency and scalability of the tool are desired to be analyzed.
We use the following inputs for the first study case: 1) Truss lintel.
2) Two beam poles.
3) Seven rail tracks, with high-speed catenaries. 4) Lintel span: 30 m.
5) Structure headroom: 6,15 m.
6) Inventory, which the tool is linked to, contains 16 poles, 6 lintels, 25 foundations and 4 cantilevers. For the second case study, we consider a set of 2048 heterogeneous railway structures. Then, we perform experi-ments calculating subsets of 4, 8, 16, 32, 64, 128, 512, 1024 and 2048 of these structures, and timing the process. It is not relevant how the structures are defined, since we just want to measure computational efficiency.
The experiments have been carried out in two hardware platforms. Platform 1 is a windows workstation with a Intel Core i5 760 2800 MHz, 4 CPU cores, and 8 GB of RAM. Platform 2 is a windows workstation with a Intel Core i7 920
Fig. 6. Execution time varying the number of structures.
2660 MHz, 8 CPU cores, and 12 GB of RAM. We have used windows workstations because we want to perform these experiments in an environment similar to the predictable one where the tool will be deployed.
The results of the first experiment may be analyzed from three different standpoints:
• From a structural point of view, the values obtained allow engineers to understand how the existing loads af-fect the whole structure. All the elements involved in the calculation process, may be analyzed to verify their fea-sibility. As may be seen in Table I, maximum values of stresses and displacements are presented for lintels and poles. Overturning moments and compression forces are referred to foundations. Tensioned wires, used to hold the lintel, include information about the tension and the distance to the closest side of the lintel. Moreover, every element is checked individually in order to know whether it is compliant with structural restrictions and European railway companies regulations.
• From a design perspective, the results obtained by the tool are inputs for a building stage. As the components used in the tool belong to railway companies inventory, we provide a well-designed structure, with real mea-surements. Fig. 3 contains a scale graphical view of the assembled structure, with information of the specific components that were calculated.
• From a computational effort point of view, Algorithm
1 spent only 13 seconds on searching for a feasible solution. The number of calculated assemblies was 28 from a set of 1536. Besides, 16 foundations from a set of 625 were tested, and 35 cantilevers from a set of 2401 were validated. When analyzing existing ways of calculating railway support structures, a few days may be needed if this portal frame is hand-designed and hand-calculated, or a few hours if a structural engineer is aided by a standard software tool of structural calculus. When comparing these times, the performance and time improvement that our tool provides, is substantial. The results of the second experiment are showed in Fig. 3 and Fig. 4, which are direct screenshots taken off the application. Some analysis of both figures are stated below:
• Regarding sequential calculus (Fig. 6), the time
differ-ence between workstation 1 and 2, lies in their CPU speed. Whereas workstation 2 has more number of cores, workstation 1 has a higher CPU speed, thus investing less time in the sequential calculus of every set of structures.
• As seen in Fig. 6, concurrent calculus outperforms
TABLE I
STRUCTURAL RESULTS AND FEASIBILITY INFORMATION FOR EVERY ELEMENT OF THE CALCULATED STRUCTURE
Lintel Left pole Right pole Left tensioned wires Right tensioned wires
Beam Foundation Beam Foundation T1 T2 T3 T4 T5 T6
Max. displacement (cm) -3.9 -2.8 2.7
Max. axial stress (kg) -4820.83 -3101.68 -3111.25
Max. shear stress (kg) 0 -6800.4 6764.67
Max. bending moment (kg·m) 0 -12920.76 12852.87
Overturning moment (kg·m) 10185 9848
Compression force (kg/cm2) 0.64 0.66
Tension (kg) 492.99 1131.17 5549.75 487.23 1114.65 5537.43
Position (cm) 228 428 728 228 423 723
Feasible Yes Yes Yes Yes Yes Yes Yes Yes Yes Yes Yes
sequential calculus, since the workstations used for the experiments, are prepared to exploit parallelism, i.e., several threads may calculate different structures at the same time. To be precise, 4 and 8 threads can be run concurrently in workstation 1 and 2 respectively.
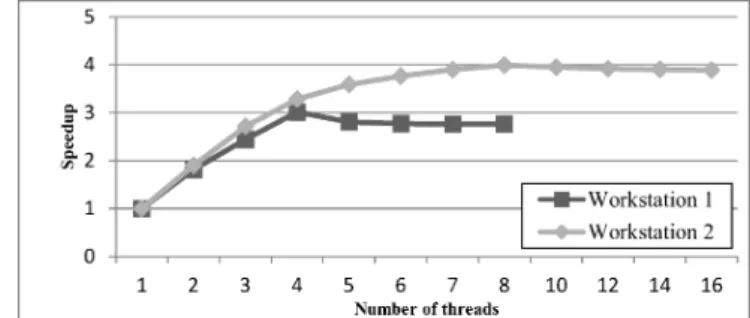
• Speedup, presented in Fig. 7, shows the time improve-ment provided by concurrent calculus when using a multi-core computer. If analyzing workstation 1, the maximum ideal speedup should be 4, as it is the number of cores in workstation 1. It is not reached, though, because there is a main thread in charge of managing the tool graphic interface. In workstation 2, the maximum ideal speedup should be 8. We do not obtain a good scalability owing to the action of the .NET Garbage Collector (GC), whose task is to reallocate memory when needed. In .NET framework, GC suspends all other threads when executing. Concerning this fact, the more number of threads we run, the more size of memory is used, so Garbage Collector is more often raised in order to fulfill the memory requirements. This results in a slight loss of performance due to thread locking. When the number of threads used in the calculation process, goes beyond the number of cores, speedup starts decreasing. This happens in both workstations, because there are not enough cores for all the running threads.
VI. CONCLUSIONS
In this paper, we have proposed an approach that allows railway engineers to model and calculate catenary support structures, such as single poles or portal frames. These structures may be very heterogeneous. Since they have their own characteristics and constraints (with regard to the track route, the catenaries to be held, the existing loads, the hy-pothesis of non-permament-action loads, or the construction regulations), a single common design and calculus solution is unfeasible. Direct stiffness method is used to perform the calculus over the set of bars generated. DSM is conceived to obtain forces and displacements at any point of the structure. According to the proposed approach, a high-productivity computational tool is also presented. The tool tries to find a feasible solution for a planned structure by selecting specific components from railway companies inventory. The tool also helps structural engineers to design and calculate safer and more efficient complex railway catenary support structures. Besides, performance and time improvement that the tool provides over hand-design and hand-calculation, is
substantial. We have estimated that the time of designing and calculating a portal frame, can be reduced by two magnitude orders. The tool does not compute a single structure, but as many as there are within a rail work project. By exploiting the ability of multi-core computers to run tasks concurrently, several structures may be calculated simultaneously with dif-ferent threads. The results are a complete design of catenary structures, including calculus results and constructive details, and a 2D-view and 3D-view representation of the structure. The developed tool has been implemented in C#. In the near future, more effort will be devoted to enhance the parallelism and to optimize the process of calculation to provide more scalability. Another future guideline will be focused on improving the intelligence of the tool to make automatic optimal designs of catenary structures, taking into account other economic aspects apart from minimum weight, like the price of the building materials.
REFERENCES
[1] Alberto, A., Benet, J., Arias, E., Cebrian, D., Rojo, T. & Cuartero, F. (2008). A high performance tool for the simulation of the dynamic pantograph-catenary interaction. In Mathematics & Computers in Simulation.,vol. 79(3), 652–667.
[2] Benet, J., Alberto, A., Arias, E., Rojo, T. A Mathematical Model of the Pantograph-Catenary Dynamic Interaction with Several Contact Wires. InInternational Journal of Applied Mathematics.,vol. 37(2). [3] Clemow, C. J. (1972). Planning for railway electrification. In
Proceedings of the IEE.,vol. 119(4), 431–440.
[4] Courant, R. (1943). Variational methods for the solution of problems of equilibrium and vibration. InBull. Amer. Math. Soc.,vol. 49, 1–23. [5] Crompton, O. J. & Wallace, G. A. (1953). Economic aspects of overhead equipment for d.c. railway electrification In Proceedings of the IEE - Part I: General.,vol. 100(124), 133–145.
[6] Farmaga, I., Shmigelskyi, P., Spiewak, P., Ciupinski, L. (2011). Eval-uation of computational complexity of finite element analysis. In CAD Systems in Microelectronics (CADSM), 2011 11th International Conference The Experience of Designing and Application of. [7] Hartland, D. (2008). Electric contact systems - passing power to
the trains. In Electric Traction Systems, 2008 IET Professional Development course on., 25–33.
[8] Hopkins, R. W., Meek, J. L. & Al-bermani, F. A. (1995). A simplified model for buckling mechanism in lattice structures. InComputers & Structures.,vol. 57(4), 745–750.
[9] Moreau, G., & Caillerie, D. (1998). Continuum modeling of lattice structures in large displacement applications to buckling analysis In Computers & Structures.,vol. 68(1-3), 181–189.
[10] Oden, J. T. (1991). Finite elements - An introduction. InHandbook of numerical analysis.,vol. 2., 3–15.
[11] Ross, B. A. (1971). A Survey of Western European AC Electrified Railway Supply Substation and Catenary System Techniques and Stan-dards. InIEEE Transactions on Industry and General Applications., vol. IGA-7(5), 666–672.