Canadian Studies in Population, Vol. 31(2), 2004, pp. 179-196
179
New Estimates of Aboriginal Fertility, 1966-1971 to 1996-2001
Bali Ram
Demography Division Statistics Canada Ottawa, Ontario
Abstract
Using census data on children in families, this paper estimates various fertility measures for the total aboriginal population and four specific groups, North American Indians, Registered Indians, Metis, and Inuit. The “own-children” procedure is used for deriving the number of births by the age of the mother during specific years preceding the census. The major focus of the paper is on the trends of total fertility rate and the convergence of age patterns between various subgroups over the past 30 years. Strengths and limitations of the method are also discussed.
Résumé
À l’aide des données du recensement sur les enfants vivant dans les familles, ce document présente des estimations de diverses mesures de fécondité pour l’ensemble de la population autochtone et quatre groupes précis : les Indiens de l’Amérique du Nord, les Indiens inscrits, les Métis et les Inuits. La méthode des « propres enfants » est utilisée pour calculer le nombre de naissances selon l’âge de la mère au cours d’années précises précédant le recensement. Le document est axé principalement sur les tendances de l’indice synthétique de fécondité et sur la convergence des tendances selon l’âge parmi divers sous-groupes au cours des trente dernières années. Les avantages et les limites de cette méthode sont également discutés.
Mony-clés : population autochtone, Métis, Inuits, la méthode des « propres enfants »
Introduction
New Estimates of Aboriginal Fertility, 1966-1971 to 1996-2001
181
Previous Research
Although the estimation of Aboriginal fertility has a rather long history in Canada, demographers are still uncertain about its exact level, let alone the age patterns. Data limitations such as large population undercoverage, incomplete birth registration,1 conceptual inconsistency over various censuses on the definition of the Aboriginal population and groups, and ethnic mobility have been major obstacles in the way of finding correct and consistent numerators and denominators for various rates. Much of the early research on Aboriginal fertility has focussed on the estimation of crude birth rates (Piché and George, 1973; Romaniuk and Piché, 1972; Romaniuc, 1981). According to these estimates, the Aboriginal birth rate remained basically stable, around 40 births per 1,000 population until about the mid-1940s. However, during the course of modernization the birth rate rose significantly, reaching 45-50 births per 1,000 over the post-war period to the mid-1960s. Since then, the Aboriginal population has been experiencing a sharp decline in its birth rate, reaching 30 per 1,000 by the mid-1970s and around 23 per thousand during 1996-2001.
There have been two direct sources of fertility data for the Aboriginal population in Canada. Until 1991, selected measures of fertility were derived from a direct question on fertility in Canadian censuses. This question allowed analyses of cumulative fertility measures such as average parity or average number of children ever born by age and distribution of women by number of children ever born, by various characteristics (Ram, 1991; Trovato, 1987). According to this measure, the average number of children born to married women aged 40 to 44—a reasonable proxy for completed fertility rate—declined slightly between 1961 and 1971, from 6.76 to 6.15, and rapidly thereafter reaching 5.19 in 1981 and 3.48 in 1991. A direct question on fertility in the Canadian census does not exist any more.
Data and Method
Fertility estimates for this paper are derived from the number of children in families, as reported in various censuses of Canada, by applying the “own-children” method (Cho, Grabill, and Bogue, 1970; Grabill and Cho, 1965). Essentially, it involves the “reverse survival” of the numbers of young children under age ‘x’ (usually under 10 years) and women in reproductive age groups in a given census, and thereafter an estimation of age-specific fertility rates ‘x ’ years preceding the census. This method is based on the premise that children under 5 years of age at the time of the census represent the survivors of all children born during the five years preceding the census and those aged 5-9 represent survivors of children born during the period 5 to 10 years preceding the census.
For this study, the estimation of fertility involved the following steps. First, tabulations were retrieved from various censuses on the number of children aged 0-4 and 5-9 in families (husband-wife families and female lone-parent families), by the age of mother.2 Although most young children live with their mothers in the same family, some children (especially those born to unmarried women) may have been put up for adoption or are being raised by male lone parents or other relatives (e.g., grandmother). The distribution of all children by age of women, including those away from their mothers, was made by pro-rating the total population aged 0-4 and 5-9, in the census. On the assumption that young children relate to women in their reproductive ages, further pro-rata was done to redistribute the number of children living with older women (45 years and over) or very young women (less than age 15) to those in reproductive age groups. This procedure is likely to be affected by the so-called “grand-mother effect” since children reported to be living with older women (usually grandmothers) may have been disproportionately born to younger women, who were unmarried (Retherford and Cho, 1978; Rindfuss, 1978). Consequently, as shown later the number of children allocated to younger women (aged 15 to 19) is usually underestimated and that allocated to older women is overestimated.
New Estimates of Aboriginal Fertility, 1966-1971 to 1996-2001
183
of births by the mid-year population of women produced cumulative fertility of five years. Finally, average-annual age-specific fertility rates were derived for the five and ten year periods preceding the census,4 by applying Grabill and Cho’s (1965) “Sprague fifth difference osculatory interpolation” multipliers to these cumulative figures.
This procedure is affected by limitations that usually concern census-based measures, including conceptual inconsistency, undercoverage and response error. Census questions for collecting data on the Aboriginal population have changed markedly from one census to another. In more recent years, the 1996 and 2001 Censuses have included a question on Aboriginal identity and thus provided conceptually consistent data. Earlier censuses included a question on Aboriginal ancestry, usually as part of the ethnic origin question. Mixing the two concepts could lead to inconsistent findings.5 Undercoverage is another serious limitation of the estimates based on the census. In every census, a certain number of Indian reserves did not participate in the census enumeration. In 1991, 78 Indian reserves and settlements were incompletely enumerated, accounting for an estimated 37, 620 missed persons. In 1996, 77 Indian reserves or settlements with a population of about 44,000 did not participate in the census. However, the number of such reserves and settlements declined to 30, with an estimated population of about 31,000 persons (Dick, 2003). Response error includes primarily those who deliberately or erroneously report themselves as Aboriginal peoples. A classic example occurred in 1981 when a small number of immigrants from India (“East Indians”) erroneously reported themselves to be of native Indian origin. This led to more appropriate editing procedures in subsequent censuses.
The own-children procedure assumes that the effect of undercoverage on fertility rate is minimized because it affects both the numerator (children) and denominator (women) similarly. This is not necessarily a strong assumption because of differential undercoverage of children and women. The pro-rata procedure of distributing the number of children not in the family and/or with their mother, or those living with someone else other than their mother (especially with their grandmothers), is also not without flaws.
obtained from life tables prepared by the Demography Division of Statistics Canada. Following some earlier research (Nault, et al., 1993), the survival ratios for the Metis were assumed to be the average of the ratios for Registered Indian and Canadian populations. The average survival ratios of the specific Aboriginal groups provided the ratios for the total Aboriginal population.
Fertility estimates for recent years (beginning with 1986-91) may also be affected by the ethnic mobility of Aboriginal peoples. Under an amendment to the Indian Act of Canada, in 1985 known as Bill C-31, a significant number of people, especially women who had lost status through marriage, regained their Aboriginal status. This may have increased the number of women reporting themselves as the Aboriginal person, who in previous censuses may not have.6
Notwithstanding these limitations, the fertility estimates based on the “own-children” procedure are superior to other methods, particularly because of the consistency between the numerator and denominator, which come from the same source, the census. The effects of the above-mentioned limitations are greatly minimized because they tend to affect both numerator and denominator similarly.
How Reliable are the Estimates?
There are five benchmarks to evaluate the reliability of the above estimates: (i) fertility rates for the total population, obtained from vital statistics; (ii) fertility rates for the comparable population in the United States; (iii) fertility rates obtained from the Indian register; (iv) comparison between fertility rates for Nunavut (Vital Statistics) and those for Inuit, obtained from the census; and (v) comparison between estimates based on children aged 0-4 in year x and those based on children aged 5-9 in year x-5.
New Estimates of Aboriginal Fertility, 1966-1971 to 1996-2001
185
Fertility rates for Aboriginal peoples in the United States provide another benchmark for evaluating the reliability of the Canadian estimates derived from the “own-children” procedure. There is a very high consistency between the two sets of rates in terms of both the level and the age pattern (Ram, 2003). The total fertility rate for Canada was slightly higher (2.60 in 1996-2001) than that observed in the United States (2.51 in 1999), while the estimates of the mean age of fertility were strikingly similar (25.69 versus 25.64). Even the fertility rate for the Canadian Aboriginal women in the 15-19 age group, which is known to be of rather poor quality, corresponds well to that for the United States (99.9 versus 95.9).
The third benchmark is the fertility rates calculated from the registered number of births. The Demography Division has produced these rates for projecting the population of Registered Indians (Loh et al, 1998). A comparison between fertility rates from the Indian register and those from the census are strikingly close. The total fertility rate for the 1991-96 period from the census was 2.86, while that from the Indian register was 2.81. The corresponding rates for 1986-91 were 2.95 versus 2.91. A comparison between fertility rates for the Inuit obtained from the census and those for the total population of Nunavut (where the Inuit form a major proportion of the population) for the1996-2001 period also shows a high degree of consistency, at 3.24 versus 3.21 (Bélanger, 2003).
Theoretically, fertility rates calculated from the number children aged 0-4 in the census year x and those from the number of children aged 5-9 in the Census year x + 5, should be equivalent. Taking into consideration conceptual changes, varying undercoverage, and ethnic mobility, the total fertility rates seem to be highly reliable (Ram, 2003), although there are relatively large differences at the age-specific level. Usually, this paper relies on fertility rates derived from the number of children aged 0-4, although rates derived from children aged 5-9 were used when consistent data were not available.
Findings
Fertility Levels
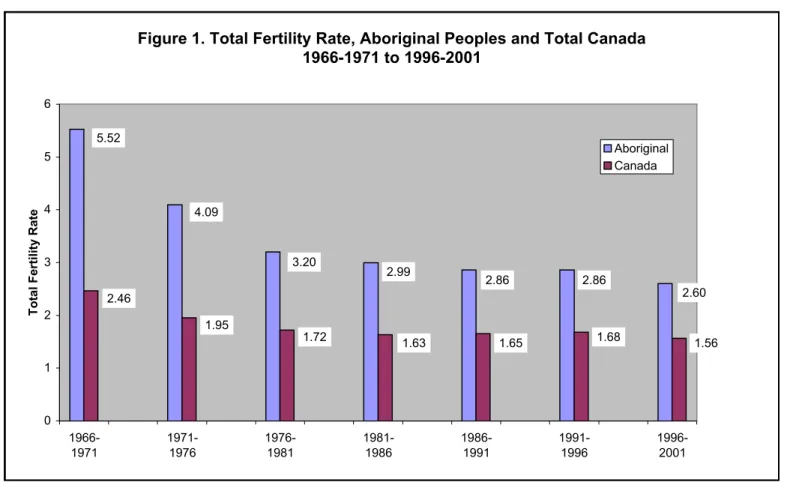
Figure
1.
Total
Fertility
Rate,
Aboriginal
Peoples
and
Total
Canada
1966-1971
to
1996-2001
0 1 2 3 4 5 6
1966-1971
1971-1976
1976-1981
1981-1986
1986-1991
1991-1996
1996-2001
Total
Fertility
Rate
Aboriginal Canada 5.52
2.46
4.09
1.95
3.20
1.72
2.99
1.63
2.86
1.65
2.86
1.68
2.60
1.56
All North
Period Aboriginal American Registered Metis Inuit
Peoples Indian Indian
1966-1971 5.52 Children aged 0-4 by Aboriginal ancestry in 1971 Census
1971-1976 4.09 Children aged 5-9 by Aboriginal ancestry in 1981 Census
1976-1981 3.20 3.07 4.87 Children aged 0-4 by Aboriginal ancestry in 1981 Census
1981-1986 2.85 2.54 4.45 Children aged 0-4 by Aboriginal ancestry in 1986 Census
1986-1991 2.86 3.00 2.91 2.46 4.54 Children aged 5-9 by Aboriginal identity in 1996 Census
1991-1996 2.86 2.98 2.86 2.48 3.99 Children aged 0-4 by Aboriginal identity in 1996 Census
1996-2001 2.60 2.81 2.68 2.15 3.21 Children aged 0-4 by Aboriginal identity in 2001 Census
Total Fertility Rates of Aboriginal Peoples and Aboriginal Groups for Canada, 1966-1971 to 1996-2001
Table 1
Data Source
New Estimates of Aboriginal Fertility, 1996-1971 to 1996-2001
fertility stabilized during the 1980s and early 1990s, but has dwindled since then. The current level is lower than that observed in a number of developing countries (Ram, 2003).
It is well known that the Aboriginal population does not form a homogeneous group. Because of their small numbers, it is difficult to come up with reliable estimates of fertility levels for various subgroups. However, estimates were made along two dimensions, region of residence and broad aboriginal category. As shown in Figure 2, Aboriginal fertility varies enormously by region of residence.7 In 1996-2001, the highest total fertility rate for Aboriginal peoples was observed in Nunavut (3.84), followed by that in Saskatchewan (3.21), Yukon and the Northwest Territories (3.15), and Manitoba (2.96), whereas the lowest rate were observed in Ontario (2.24) and British Columbia (2.34). The Aboriginal population has experienced fertility declines everywhere, but the largest drop between 1991-1996 and 1996-2001 was observed in high-fertility regions, the territories (12%), Saskatchewan (11%), Alberta (10%), and Quebec (9%). However, the gap between the Aboriginal and the rest of the Canadian populations remains wide everywhere. The gap between the two groups is closest in the territories, Nunavut in particular, which is to be expected because Aboriginal peoples form a large proportion of the population in these regions. The smaller Aboriginal versus total population gap in Ontario and British Columbia is largely due to relatively low levels of Aboriginal fertility in these provinces.
0.0 0.5 1.0 1.5 2.0 2.5 3.0 3.5 4.0 4.5
Canada Atl Que Ont Man Sask Alb B.C. Y/N/N Nun
Total
Fertility
Rate
1991-1996 1996-2001
Figure 2. Total Fertility Rates for Aboriginal Peoples for Canada, Provinces and Territories:
1991-1996 and 1996-2001
2.86
2.60 2.59
2.38 2.68
2.44 2.38
2.25 3.24
3.13 3.59
3.19
2.87
2.59 2.43
2.33 3.58
3.14
3.84
New Estimates of Aboriginal Fertility, 1966-1971 to 1996-2001
surprising that they have the lowest fertility level. The levels for North American Indians and Registered Indians fall somewhere in between. Nevertheless, in recent years there seems to have been a convergence of fertility rates among the various Aboriginal groups.
Age Patterns of Fertility
The own-children procedure does not yield highly reliable estimates on age-specific fertility rates. As noted earlier, it produces an underestimate at younger ages and an overestimate at older ages (Retherford and Lee-Jay Cho, 1978). There are several reasons for this. First, many children born to young unmarried mothers may have been given up for adoption to older women with few or no children. This is highly likely among the Aboriginal population, which has a higher incidence of children born to single women.9 Second, some of the children born to unmarried women may have been misreported as children of older mothers, while others may have been wrongly imputed as children of older mothers (Rindfuss, 1976; Retherford and Cho, 1978). Because of these limitations, age patterns of Aboriginal fertility need to be examined with caution.
Consistent with most high-fertility populations, the age patterns of Aboriginal fertility can be characterized as the “early peak” type, with the largest number of children born to women in the 20-24 age group (Table 2). When the overall level of fertility for a population declines, age patterns of fertility usually change from the “early peak” type to the “broad peak” or the “late peak” types. For Canada as a whole, the age patterns of fertility used to be the “early peak” type until 1968, when the total fertility rate was around 2.4. Since 1969 when the total fertility rate declined to 2.3 or lower, the age pattern shifted to the “late peak” type. This has not happened for the Aboriginal population. Despite large declines in the overall fertility, the age pattern has remained almost unchanged over the past 30 years. Interestingly, despite large differences in their fertility levels, age patterns of fertility for the four Aboriginal groups under examination are similar (Table 3). Even for the Metis, whose fertility has reached close to the replacement level and who exhibit the lowest fertility rates at each age group, the age patterns are similar to that observed for the overall Aboriginal population.
1966-1971 1976-1981 1986-1991 1991-1996 1996-2001
120.4 112.3 115.5 116.2 99.9
297.5 203.9 183.1 181.7 168.4
251.6 160.7 143.8 145.5 131.4
189.6 85.3 89.3 81.6 74.2
153.3 51.4 54.3 35.2 33.3
79.2 24.4 10.5 10.2 11.6
11.9 2.7 1.3 1.7 1.0
North
Canada All American Registered Metis Inuit
Age group Aboriginal Indian Indian
15-19 20.3 99.9 114.2 110.3 72.5 100.0
20-24 64.2 168.4 182.3 173.6 142.3 179.0
25-29 103.7 131.4 136.7 128.5 119.6 156.9
30-34 85.5 74.2 78.5 73.9 63.1 101.0
35-39 32.9 33.3 36.8 35.7 25.4 57.4
40-44 5.3 11.6 13.7 13.6 5.5 41.0
45-49 0.2 1.0 1.0 1.0 0.7 6.6
Age-Specific Fertility Rates for Canada and Aboriginal Groups, 1996-2001 Age group
15-19 20-24 25-29 30-34 35-39 40-44 45-49
Table 3 Table 2
Age-Specific Fertility Rates for Aboriginal Peoples Canada, 1966-1971 to 1996-2001
New Estimates of Aboriginal Fertility, 1966-1971 to 1996-2001
for most high-fertility populations10 (Ram, 2003). Interestingly, the fertility level for women in the 15-19 age group has changed very little over the years.
Summary and Conclusions
Using the ‘own-children’ procedure, this paper estimated the levels, trends and patterns of fertility among Aboriginal peoples and their four subgroups, North American Indians, Registered Indians, Metis, and Inuits. Despite its limitations, the procedure was found to provide reasonably reliable estimates. Over the past three decades, the total fertility rate for Aboriginal peoples declined by more than half, reaching 2.6 children per woman in 1996-2001. Although the decline in Aboriginal fertility is still lagging behind the overall Canadian level by about thirty years, it is much lower than that observed in a number of developing countries. The level in certain provinces such as Ontario and British Columbia is even lower, around 2.3 children, although it is markedly higher (slightly larger than 3.0 children) in Manitoba, Saskatchewan, and the territories. Over the years, fertility has declined among all Aboriginal groups, with the Metis reaching close to the replacement level. However, Inuit fertility remains rather high, with 3.2 children in 1996-2001.
Following fertility declines, the shape of age patterns usually shifts from the early peak type to the late peak type, with most women having children in the age group 25 to 29. This has not happened among Aboriginal peoples—not even among the Metis whose fertility has been approaching the replacement level. Aboriginal fertility has retained the traditionally youthful nature of its age patterns. Women in their early 20s remain the largest contributors to the overall fertility, which is somewhat inconsistent with the experiences of most populations undergoing demographic transition. Even more unusual is the striking persistence of high teen-age fertility among Aboriginal peoples. In 1996-2001, fertility among teen-age women was around 100 births per 1,000, which is higher than most populations today.
New Estimates of Aboriginal Fertility, 1966-1971 to 1996-2001
193 Acknowledgements:
This is a revised version of the paper presented at the annual meeting of the Canadian Population Society, Halifax, June 1 -3, 2003. I would like to thank my colleagues at Statistics Canada, M. V. George, Réjean Lachapelle, Andy Siggner, and Ravi Verma, and two anonymous referees for their helpful comments on earlier drafts. The opinions expressed in this paper are mine, and do not necessarily reflect the views of Statistics Canada.
End Notes:
1. Birth registration is available for the Registered Indian population, but that too is marred by late reporting. Demographers at Statistics Canada have tried to minimize this problem and have come up with various measures of fertility for a sufficiently long period, beginning with 1960 (see Nault et al., 1993; Piché and George; 1973; Ram and Romaniuc, 1985).
2. Estimates done from the number of children aged 5-9, are not as reliable as those based on the number of children aged 0-4. The older the child, the higher the probability of his/her being away from the natural mother.
3. Survival ratios were calculated from the life tables for Registered Indian populations, prepared by Verma et al. (Forthcoming). The same ratios were used for all subgroups of the Aboriginal population, except for the Metis. The survival ratio for the Metis is assumed to be the average of the ratios for Registered Indians and total Canada (see, Nault et al., 1993). The average of Aboriginal groups provided the survival ratios for the total Aboriginal population. Survival ratios for the total population were obtained from the life tables prepared by D. Nagnur (1986) and Demography
Division.
4. Calculation of age-specific rates by single year of age avoids the use of these multipliers, but introduces errors that characterize small population groups.
6. Such reinstatements represent an additional component of population growth accounting for about 39% of annual growth in 1991-92 (Norris, Kerr, and Nault, 1995). The effect of this Bill will be felt most on the 1991 Census count or 1986-91 fertility estimates, and also to some extent on 1991-96 and 1996-2001 estimates.
7. These estimates are rather crude because of being affected by geographic mobility.
8. It may be mentioned that these trends are not highly precise because of conceptual changes. As mentioned earlier, in the 1996 and 2001 Censuses, Aboriginal identity was used to classify a person in a subgroup, whereas in previous censuses Aboriginal ancestry was used. The Inuit may be the least affected group by these changes.
9. Higher fertility of single women in the Northwest Territories (which consists of a high proportion of its population that is Aboriginal compared to that observed in the whole of Canada) seems to support this observation. In the 1991 Census, the age-adjusted average number of children born to ever-married women aged 15-49 for the Northwest Territories was 1.6 times higher than that observed for Canada. The corresponding ratio for never married was much higher, at 3.6. The ratio is particularly pronounced among younger age groups.
10. For example, the fertility rate for women in the 15-19 age group was 54.0 in India (1997), 82.1 for Zimbabwe (1992), 85.2 for Mexico (1995), and 73.3 for blacks in the United States (2001).
References:
Bélanger, Alain. 2003. Report on the Demographic Situation in Canada 2002. Ottawa: Statistics Canada, Catalogue 91-209-XPE
Cho, Lee-Jay. 1973. “The Own-Children Approach to Fertility Estimation: An Elaboration.” International Union for the Scientific Study of Population, International Population Conference, Liege, 1973, Vol. 2: 263-278.
New Estimates of Aboriginal Fertility, 1966-1971 to 1996-2001
195
Cho, Lee-Jay, Wilson H. Grabill, and Donald J. Bogue. 1970. Differential Current Fertility in the United States. Chicago: University of Chicago Press.
Dick, Peter. 2003. “Summary of Indian Reserves.” Federal, Provincial and Territorial Workshop on 2001 Coverage Estimates. Ottawa: Statistics Canada, April 2003.
Grabill, Wilson H. and Lee-Jay Cho. 1965. “Methodology for the Measurement of Current Fertility from Population Data on Young Children,”
Demography 2: 50-73.
Kerr, Don and Andy Siggner. 1994. “Canada’s Aboriginal Population, 1981-1991.” A report prepared for the Royal Commission on Aboriginal Persons and Housing, Family and Social Statistics Division, Statistics Canada, March 1994.
Loh, Shirley, Ravi B. P. Verma, Edward Ng, Mary Jane Norris, M. V. George, and Jeanine Perreault. 1998. Population Projections of Registered Indians. Demography Division, Statistics Canada.
Nagnur, Dhruva. 1986. Longevity and Historical Life Tables 1921-1981 (Abridged), Canada and Provinces. Ottawa: Statistics Canada. Catalogue 89-506.
Nault, Francois, Jiajian Chen, M. V. George, and Mary Jane Norris. 1993. Population Projections of Registered Indians, 1991-2016. Report prepared by Demography Division, Statistics Canada for Indian and Northern Affairs Canada.
Norris, Mary Jane. 1996. “Contemporary Demography of Aboriginal Peoples in Canada,” in David A. Long and Olive P. Dickson (Eds.), Visions of the Heart: An Introduction to Canadian Aboriginal Issues. Toronto: Harcourt Brace Canada.
Norris, Mary Jane, Don Kerr, and Francois Nault. 1995. Projections of the Population with Aboriginal Identity in Canada, 1991-2016. Ottawa: Statistics Canada, Demography Division.
Ram, Bali. 1991. Assimilation and Fertility of Native Indians: Some New Evidence. Paper presented at the annual meeting of the Canadian Population Society, Kingston, Ontario, June.
Ram, Bali. 2003. Emerging Patterns of Aboriginal Fertility, 1966-1971 to 1996-2001. Paper presented at the annual meeting of the Canadian Population Society, Halifax, June.
Ram, Bali and Anatole Romaniuc. 1985. Fertility Projections of Registered Indians, 1982 to 1996. Ottawa: Indian and Northern Affairs Canada.
Retherford, Robert D. and Lee-Jay Cho. 1978. “Age-Parity-Specific Birth Rates and Birth Probabilities from Census and Survey Data on Own Children,” Population Studies 32: 567-581.
Rindfuss, Ronald R. 1976. “Annual Fertility Rates from Census Data on Own Children: Comparisons with Vital Statistics Data for the United States,” Demography 13: 235-249.
Romaniuk, Anatole and Victor Piché. 1972. “Natality Estimates for the Canadian Indians by Stable Population Models, 1900-1969,” Canadian Journal of Sociology and Anthropology 9: 1-20.
Romaniuc, Anatole.1987. “Transition from Traditional High to Modern Low Fertility: Canadian Aboriginals,” Canadian Studies in Population 14: 69-88.
Romaniuc, Anatole. 2000. “Aboriginal Population of Canada: Growth Dynamics under Conditions of Encounter of Civilisations,” The Canadian Journal of Native Studies 20: 95-137.
Trovato, Frank. 1987. “A Macrosociological Analysis of Native Indian Fertility in Canada: 1961, 1971, and 1981,” Social Forces 66: 463-485.
Verma, Ravi, Margaret Michalowski, and R. Pierre Gauvin. 2003. Forthcoming. “Abridged Life Tables for Registered Indians in Canada, 1976-1980 to 1996-2000,” Canadian Studies in Population.