Adaptability and stability in commercial maize hybrids in the
southeast of the State of Minas Gerais, Brazil
1Adaptabilidade e estabilidade de híbridos comerciais de milho no sudeste de Minas
Gerais
Sirlene Viana Faria2, Luiz Silva Luz3, Mateus Cupertino Rodrigues3, José Eustáquio de Souza Carneiro3, Pedro Crescêncio Souza Carneiro4 and Rodrigo Oliveira DeLima3*
ABSTRACT -The aim of this study was to evaluate the adaptability and stability of 29 commercial maize hybrids in the southeast of the State of Minas Gerais, Brazil, employing three methods. The 29 commercial maize hybrids from the 2014/2015 crop were evaluated for grain yield in five locations in the southeast of Minas Gerais. A randomised-block design was used, with two replications. Each lot comprised two rows, five meters in length, at a spacing of 0.80 m, giving an effective area of 8.00 m2. In addition to individual and combined variance analysis, the methods of Eberhart & Russell (1966), AMMI (Additive Main Effects and Multiplicative Interaction Analysis) and mixed models were used to evaluate the adaptability and stability of the 29 hybrids. There was a significant difference (P<0.01) for the effects of hybrid, environment and the hybrid x environment interaction. The majority of the hybrids under evaluation displayed broad adaptability with good stability. It was concluded that the Eberhart & Russell, AMMI and mixed-model methods show similar results in classifying maize hybrids of broad adaptability. There is a difference in indicating hybrids with specific adaptability to favourable and unfavourable environments. Based on the three methods, the hybrids SHS7920PRO, BM709PRO2, BRS1055 and BM650PRO2 show a general adaptability for the environments under evaluation.
Key words:Zea mays L.. Genotype x environment interaction. Hybrid recommendation.
RESUMO -O objetivo deste trabalho foi avaliar a adaptabilidade e estabilidade de 29 híbridos comerciais de milho, no sudeste de Minas Gerais, com emprego de três metodologias. Os 29 híbridos comercias de milho foram avaliados para produtividade de grãos, em cinco locais do sudeste de Minas Gerais, na safra 2014/2015. Utilizou-se o delineamento em blocos ao acaso com duas repetições. Cada parcela foi constituída de duas linhas de cinco metros de comprimento, espaçadas em 0,80 m com área útil de 8,00 m2. Além das análises de variâncias individual e conjunta, empregou-se os métodos
de Eberhart & Russell (1966), AMMI (Additive Main Effects and Multiplicative Interaction Analysis) e modelos mistos para avaliar a adaptabilidade e estabilidade dos 29 híbridos. Houve diferença significativa (P < 0,01) para os efeitos de híbridos, ambientes e interação híbridos x ambientes. A maioria dos híbridos avaliados apresentou ampla adaptabilidade e boa estabilidade. Conclui-se que as metodologias de Eberhart & Russell, AMMI e modelos mistos, apresentam resultados semelhantes na classificação de híbridos de milho com ampla adaptabilidade; há divergência na indicação de híbridos com adaptabilidade específica a ambientes favoráveis e desfavoráveis e; com base nas três metodologias, os híbridos SHS7920PRO, BM709PRO2, BRS1055 e o BM650PRO2 apresentam adaptabilidade geral nos ambientes avaliados.
Palavras-chave:Zea mays L.. Interação genótipos x ambientes. Recomendação de híbridos. DOI: 10.5935/1806-6690.20170040
*Autor para correspondencia
Recebido para publicação em 16/03/2016; aprovado em 30/06/2016
1Parte da Dissertação de Mestrado do primeiro autor apresentada ao Programa de Pós-Graduação em Genética e Melhoramento, Universidade
Federal de Viçosa/UFV
2Universidade Federal de Viçosa/UFV, Minas Gerais-MG, Brasil, [email protected]
3Departamento de Fitotecnia, Universidade Federal de Viçosa/UFV, [email protected], [email protected], [email protected], rodrigoodelima@
ufv.br
INTRODUCTION
Maize (Zea mays L.) is grown almost all over
Brazil, in a wide variety of environments, using different production systems and levels of technology
(MALDANER et al., 2014). The identification of
genotypes with high production potential and with broad adaptability and stability is one of the principle target of maize breeding programs. This is why, before being released and recommended to farmers, hybrids are evaluated in many locations. However, cultivars evaluated in different environments may display different behaviour due to environmental variations, which would characterise the interaction between genotype and environment (HALDANE, 1946). Studying adaptability and stability is an alternative for reducing the effects of this interaction, and makes it possible to identify cultivars which have predictable behaviour, and which are responsive to environmental improvements (CRUZ; CARNEIRO; REGAZZI, 2014).
Different methods have been proposed to study the adaptability and stability of maize cultivars. Among these is the method proposed by Eberhart and Russell (1966), based on linear regression analysis, which among its advantages includes ease of application and interpretation of results. The recommendation of maize cultivars based on this method has been successfully employed by several authors (CARGNELUTTI FILHO
et al, 2009; MIRANDA et al, 2009; OLIVEIRA;
MOREIRA; FERREIRA, 2013; RIOS et al., 2009;
SCAPIM et al., 2010), and recently, Carvalho et al.
(2014) used this method to study the adaptability and stability of 16 maize genotypes in the state of Tocantins, and classify them as to production objective: either grain or green weight.
Among recent methods is AMMI analysis (Additive Main Effects and Multiplicative Interaction) (GAUCH; ZOBEL, 1996). It allows a more detailed evaluation of the genotype x environment interaction, and enables easy graphical interpretation of the results. The application of this analysis to evaluating maize
cultivars can be found in the work of Balestre et al.
(2009), Cargnelutti Filho et al. (2009) and Mirandaet
al. (2009). According to these last authors, the AMMI
method is relatively simple, making it possible to study the phenotypic stability and genotypic behaviour of cultivars, as well as inferring the degree of divergence between the cultivars under evaluation.
In addition to these two methods, the method of mixed models has been used in recommending cultivars
of various crops: carrots (SILVA et al., 2011), coffee
(ROCHAet al., 2015) and beans (TORRESet al., 2015),
as it displays some advantages over traditional methods
(RESENDE, 2007). The method considers the errors correlated within locations, provides genetic values already discounting instability, and allows selection by three attributes at one time (productivity, stability and
adaptability). Mendeset al. (2012) employed this method
to evaluate 45 varieties of maize in 49 environments. The authors concluded that, due to the characteristics of the method, it was suitable for use in maize breeding programs.
Traditional methods for the study of adaptability and stability have been used with success in the recommendation of maize cultivars. However, work employing more modern methods, such as AMMI and mixed models, in the evaluation of maize hybrids are scarce, and need further study. Thus, the objective of this study is to evaluate the adaptability and stability of 29 commercial maize hybrids in the southeast of the State of Minas Gerais (MG), employing the methods of Eberhart and Russell (1966), AMMI and mixed models.
MATERIAL AND METHODS
For this study, twenty-nine commercial maize hybrids released by different seed companies were evaluated in five environments in the southeast of Minas Gerais in the 2014/2015 season (Table 1): The Experimental Station of Coimbra, in the town of Coimbra, MG (20º49’46.5” S, 42º45’51.1” W, altitude 715 m); The Diogo Alves de Mello Experimental Station, in Viçosa, MG (20º46’04” S, 42º52’10” W, altitude 662 m) (Viçosa1); The Horta Nova Experimental Station (20º45’47.6” S, 42º49’25.1” W, altitude 665 m), located in the district of São José do Triunfo, Viçosa, MG
(Viçosa2); The Experimental Station ofEmbrapa Milho
e Sorgo, in Sete Lagoas, MG (19º27’57” S, 44º14’48” W, altitude 761 m), and in São Miguel do Anta, MG (20º42’22.6” S, 42º43’09.4” W, altitude 661 m).
The experimental design was of randomised blocks with two replications. Each plot consisted of two rows, five meters in length, spaced 0.80 m apart, with
an effective area of 8.00 m2. When more than 50% of
the plots had reached the V4 stage (four fully developed leaves), thinning was carried out in order to obtain a final
population of 62,500 plants ha-1.
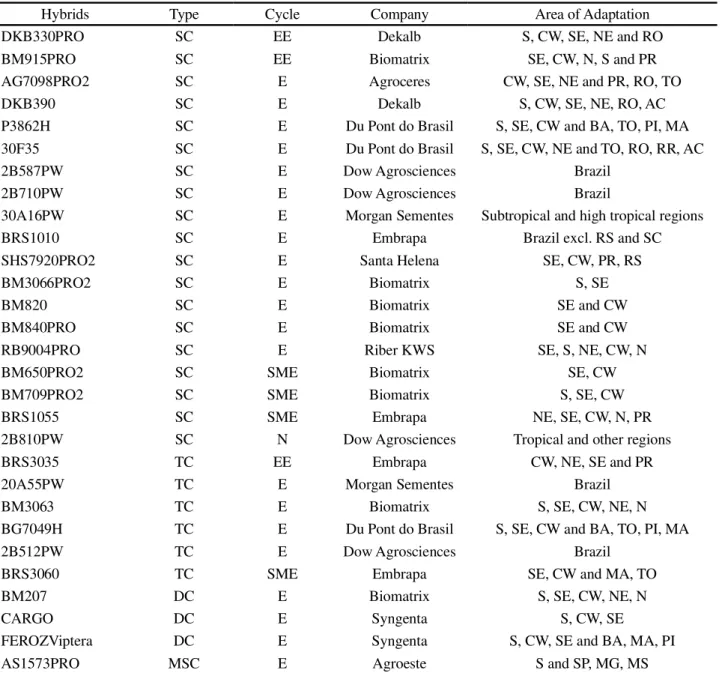
Table 1 - Agronomic characteristics of 29 commercial maize hybrids evaluated for five environments in the southeast of Minas Gerais in the 2014/2015 season
Type: SC Single cross; TC Tripleway cross; DC Double cross; MSC Modified Single cross. Cycle: EE ExtraEarly; E Early; SME SemiEarly; N -Normal. Area: S - South; CW - Central West; SE - Southeast; NE- Northeast; N - North; PR - Paraná; RO - Rondônia; TO - Tocantins; AC - Acre; BA - Bahia; PI - Piauí; MA - Maranhão; RR - Roraima; RS - Rio Grande do Sul; SC - Santa Catarina; SP- São Paulo; MG - Minas Gerais; MS - Mato Grosso do Sul
Hybrids Type Cycle Company Area of Adaptation
DKB330PRO SC EE Dekalb S, CW, SE, NE and RO
BM915PRO SC EE Biomatrix SE, CW, N, S and PR
AG7098PRO2 SC E Agroceres CW, SE, NE and PR, RO, TO
DKB390 SC E Dekalb S, CW, SE, NE, RO, AC
P3862H SC E Du Pont do Brasil S, SE, CW and BA, TO, PI, MA
30F35 SC E Du Pont do Brasil S, SE, CW, NE and TO, RO, RR, AC
2B587PW SC E Dow Agrosciences Brazil
2B710PW SC E Dow Agrosciences Brazil
30A16PW SC E Morgan Sementes Subtropical and high tropical regions
BRS1010 SC E Embrapa Brazil excl. RS and SC
SHS7920PRO2 SC E Santa Helena SE, CW, PR, RS
BM3066PRO2 SC E Biomatrix S, SE
BM820 SC E Biomatrix SE and CW
BM840PRO SC E Biomatrix SE and CW
RB9004PRO SC E Riber KWS SE, S, NE, CW, N
BM650PRO2 SC SME Biomatrix SE, CW
BM709PRO2 SC SME Biomatrix S, SE, CW
BRS1055 SC SME Embrapa NE, SE, CW, N, PR
2B810PW SC N Dow Agrosciences Tropical and other regions
BRS3035 TC EE Embrapa CW, NE, SE and PR
20A55PW TC E Morgan Sementes Brazil
BM3063 TC E Biomatrix S, SE, CW, NE, N
BG7049H TC E Du Pont do Brasil S, SE, CW and BA, TO, PI, MA
2B512PW TC E Dow Agrosciences Brazil
BRS3060 TC SME Embrapa SE, CW and MA, TO
BM207 DC E Biomatrix S, SE, CW, NE, N
CARGO DC E Syngenta S, CW, SE
FEROZViptera DC E Syngenta S, CW, SE and BA, MA, PI
AS1573PRO MSC E Agroeste S and SP, MG, MS
done manually. Management and treatment were carried out in accordance with the technical recommendations
for maize crops (CRUZ et al., 2008). When planting,
400 kg ha-1 of 08-28-16 formulation NPK fertiliser was
applied. Later, at the V6 stage (six fully developed leaves)
a topdressing of 150 kg N ha-1 was applied in the form of
urea. Grain yield was evaluated, weighing the grain from each lot corrected for 14.5% moisture, with the values
converted to kg ha-1.
the Eberhart and Russell (1966), AMMI and mixed-model REM/BLUP methods. In the evaluation of individual genotypes, the Eberhart and Russell method (1966) uses
the average productivity ( oi), the regression coefficient
( 1i) of each genotype in relation to the environmental
index, and the variation in deviation of this regression 2
di). In using this method, the following regression model
(Equation 1) was employed:
yij = oi + 1iIj + ij + ij (1)
where: yij is the mean value of genotypei, in environment
j; oi is the constant of the regression and represents
the overall mean value for genotype i; 1i is the linear
regression coefficient which measures the response of
the i-th genotype to variation in the environment; I
jis
the encoded environmental index; ijis the deviation of
regression; and ij is the mean experimental error.
For the AMMI analysis (GAUCH; ZOBEL, 1997), which combines into a single model additive components for the main effects of the genotypes and environments, and multiplicative components for the interaction effects, the following model was used:
yij= µ + gi + aj+ n
k=1 k ik jk + jk + ij (2)
where:yij is the average productivity of genotypei (i = 1,2,
..., 29) in environmentj (j = 1,2, ..., 5); is the overall mean
value of the experiments;g
i is the fixed effect of genotype
i;ajis the effect of environmentj; kis thek-th single value
of the interaction matrix; ikis the element corresponding
to thei-th genotype in the k-th single vector column of
matrix GA; jk is the element corresponding to the j-th
environment, in thek-th single vector line of matrix GA;
jkis the residual associated with the term for the classic
interaction of genotype i with environment j; ij is the
mean experimental error associated with the observation,
assuming ~N (0, 2) as independent; andn is the number
of axes or retained main components for describing the pattern of the genotype x environment interaction.
For the mixed-model method, model 54 of the SELEGEN REML/BLUP software was used (RESENDE, 2007):
y = Xr + Zg + Wi + e, (3)
where: y is the data vector; r is the vector of fixed
repetition effects added to the overall mean value;g is
the vector of random genotypic effects;i is the vector
of the random effects from the genotype x environment
interaction;e is the random error vector; and X, Z and W
are the incidence matrices forb,g andc respectively.
The joint selection, taking productivity, stability and adaptability of the maize genotypes together, was obtained
from the harmonic mean of the relative performance of the predicted genotypic values:
(4)
where:nis the number of environments; PRVGij=VGij/
VGj, where: VGij is the genetic value of genotype i in
environment j; and VGj corresponds to the genotypic
mean in environmentj.
To facilitate interpretation of the results, the MHPRVG values were multiplied by the overall mean value, giving results of the same magnitude as the characteristic being studied. Later, the environments were grouped into favourable and unfavourable, according to the overall mean of the hybrids in all of the environments, and separate analyses were carried out for each environment group. Environments where the average value was higher than the overall average were considered favourable, and those where the average value was less than the overall average were considered unfavourable. This resulted in the creation of new values for MHPRVG for each environment group, which were compared using dispersion diagrams.
The genetic and statistical analyses were carried out with the help of the Genes (CRUZ, 2013), the SELEGEN (RESENDE, 2007) and the R Statistical Software (R Development Core Team, 2010).
RESULTS AND DISCUSSION
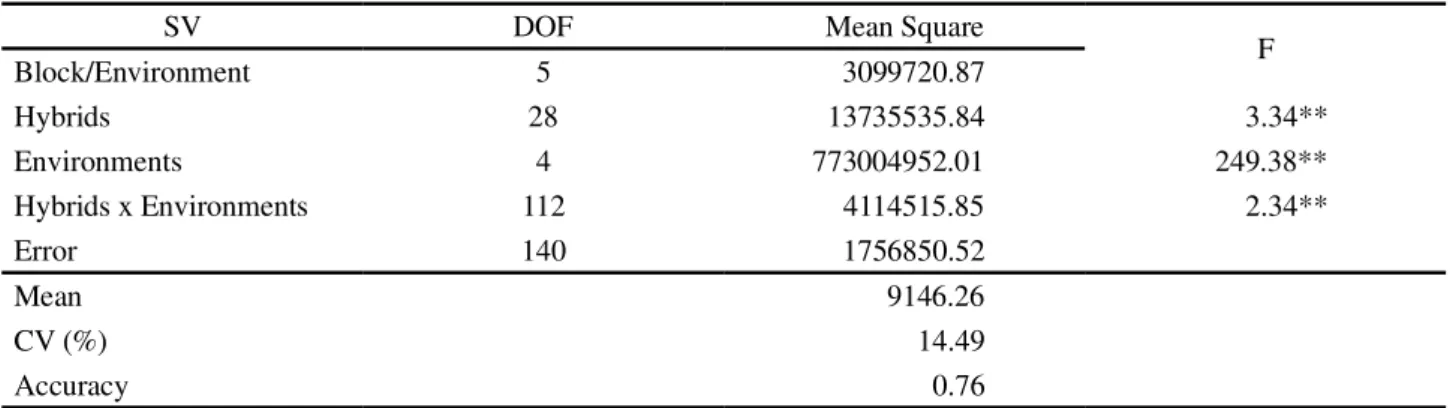
With the results of the individual analysis of variance, a significant difference (P<0.05) was found between the hybrid averages for grain yield at all the sites under evaluation (data not shown). Accuracy values ranged from 0.75 to 0.89, indicating the high precision of the experiments (RESENDE; DUARTE, 2007). Furthermore, it was found that the ratio between the largest and smallest residual mean square was less than 7.0 (2.8), which indicates homogeneity of the residual variances. This made it possible to carry out combined analysis (Table 2), which showed a significant effect (P<0.01) for all the tested sources of variation. The significant hybrid x environment interaction demonstrates that the hybrids had different responses in relation to the environmental changes. In the work of
Balestreet al. (2009) and Mirandaet al. (2009), different
responses were also seen for grain yield in commercial maize hybrids when grown in different environments.
The average grain yield of the hybrids in the
environments ranged from 3,163 kg ha-1 in São Miguel
average of 9,146 kg ha-1. This average was higher
than the national average of 5,411 kg ha-1, obtained in
the last harvest (CONAB, 2016). The coefficient of variation (CV), which measures experimental accuracy, was 14.49%, classified as average for the productivity
of maize grain (FRITSCHE-NETO et al., 2012) and
indicating good experimental precision. In similar studies with maize, the value for the coefficient of variation
ranged from 10.66% (CARGNELUTTI FILHOet al., 2009)
to 22.0% (CARDOSOet al., 2012) for the characteristic
of grain yield. Such satisfactory precision was confirmed by the high value for accuracy (0.76) obtained with the combined analysis (RESENDE; DUARTE, 2007).
According to the Eberhart and Russell method (1966), two environments were classified as unfavourable - Coimbra and São Miguel do Anta. These environments
showed negative values forI
j, which are usually associated
with areas of adverse weather or soil conditions, or areas with low levels of technology and little input. The environments at Viçosa1, Viçosa2 and Sete Lagoas were classified as favourable, and were where the hybrids had the highest grain yields.
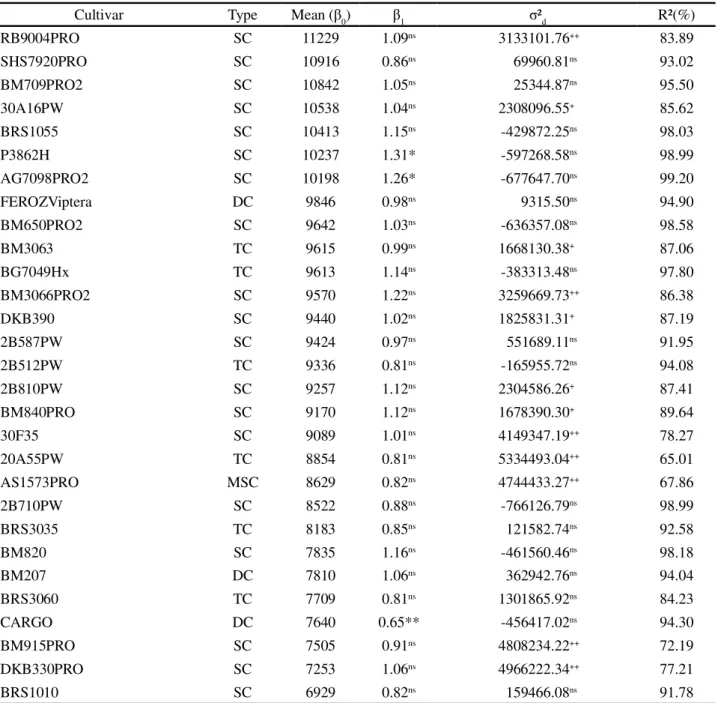
When analysing the parameters of adaptability and stability by the Eberhart and Russell method (1966) (Table 3), it can be seen that 89.66% of the hybrids had regression coefficients statistically equal to one ( 1i = 1) and were classified as having general adaptability. The P3862H and AG7098PRO2 hybrids were classified as having specific adaptability to favourable environments
1i>1), i.e. according to this method, these hybrids
responded favourably to improvements in the
environment. The CARGO hybrid had a value for 1i
statistically less than one ( 1i<1), which demonstrates the
adaptability of this hybrid to unfavourable environments; it displayed no increase in grain yield with improvements in the environment, and should be recommended for areas of low investment and low levels of technology.
Table 2 - Summary of the combined analysis of variance for grain yield evaluated in 29 commercial maize hybrids for five environments in Minas Gerais, in the 2014/2015 season
**: significant at 1% probability by F-test
For phenotypic stability, 59% of the hybrids
showed a deviation of regression equal to zero ( 2
di= 0), which indicates the high behavioural predictability of these hybrids. In contrast, the hybrids RB9004PRO, 30A16PW, BM3063, BM3066PRO2, DKB390, 2B810PW, BM840PRO, 30F35, 20A55PW, AS1573PRO, BM915PRO and DKB330PRO showed significant
deviation of regression ( 2
di 0), demonstrating their
unpredictable behaviour in the environments. These are single hybrids, with the exception of BM3063 (TC) and 20A55PW (TC), and have a constitution of low genetic stability, as they result from the crossing of only two lines (HALLAUER; MIRANDA FILHO; CARENA, 2010). However, such results should not limit the use of these hybrids because, with the exception of hybrids RB9004PRO, 30F35, 20A55PW, AS1573PRO, BM915PRO and DKB330PRO, they had
values for the coefficient of determination (R2) of over
85%, which is recommended for maize (OLIVEIRA; MOREIRA; FERREIRA, 2013). This coefficient is an auxiliary measure of comparison between genotypes, and reflects the goodness of fit of the model to the yields observed in each of the hybrids under evaluation. These results showed that a large part of the variations was explained by the adopted model.
In the simultaneous analysis of the parameters of
adaptability and stability ( 1i and 2
di), obtained with the
Eberhart and Russell method (1966), it is found that most hybrids showed high behavioural predictability and broad adaptability. The hybrids SHS7920PRO, 30A16PW, BM709PRO2, BRS1055, FEROZViptera, BM650PRO2, BM3063, BG7049Hx, BM3066PRO2, DKB390, 2B587PW, 2B512PW and 2B810PW are noteworthy, as together with these parameters they had grain yields higher
than the overall average (9,146 kg ha-1). Furthermore, they
had values for the coefficient of determination (R2) greater
than 85%.
SV DOF Mean Square
F
Block/Environment 5 3099720.87
Hybrids 28 13735535.84 3.34**
Environments 4 773004952.01 249.38**
Hybrids x Environments 112 4114515.85 2.34**
Error 140 1756850.52
Mean 9146.26
CV (%) 14.49
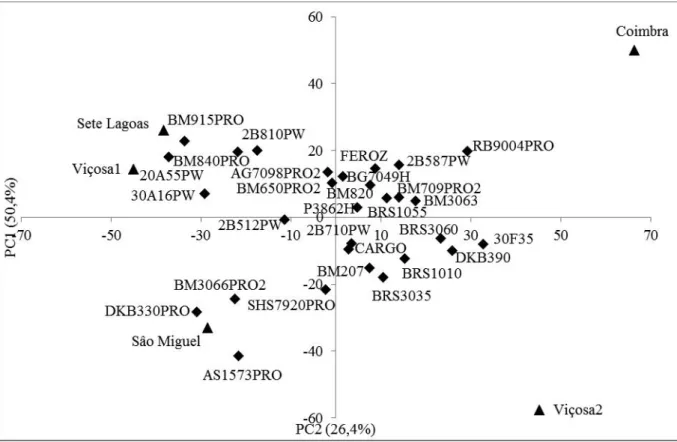
In the AMMI analysis, the first two principal components (PC1 and PC2) explained 76.8% of the variation due to the hybrid x environment interaction. According to
Silvaet al. (2011), there is a greater capture of the percentage
variation with the first few principal components, and as the number of selected axes increases, the percentage of “noise” also increases, reducing the predictive power of the analysis. There was 29% residual noise, reflecting the relevance of
the graph. The graph was therefore interpreted employing only the biplot and the AMMI2 model. Evaluating maize hybrids in different environments in the State of Minas
Gerais by AMMI analysis, Namoratoet al. (2009) also used
the AMMI2 model, as observation of the first two axes in that model ensured a better graphical display, however the model only captured 50.7% of the sum of squares of the genotype x environment interaction.
Table 3 - Estimates of the parameters of adaptability and stability according to the Eberhart and Russell method (1966), for the 29 maize hybrids evaluated for five environments in Minas Gerais, in the 2014/2015 season
ns: not significant and **, *: significantly different to 1 by t-test at 1% and 5% probability respectively.++,+: significantly different to 0 by F-test at 1%
and 5% probability respectively
Cultivar Type Mean ( 0) 1 ²d R²(%)
RB9004PRO SC 11229 1.09ns 3133101.76++ 83.89
SHS7920PRO SC 10916 0.86ns 69960.81ns 93.02
BM709PRO2 SC 10842 1.05ns 25344.87ns 95.50
30A16PW SC 10538 1.04ns 2308096.55+ 85.62
BRS1055 SC 10413 1.15ns -429872.25ns 98.03
P3862H SC 10237 1.31* -597268.58ns 98.99
AG7098PRO2 SC 10198 1.26* -677647.70ns 99.20
FEROZViptera DC 9846 0.98ns 9315.50ns 94.90
BM650PRO2 SC 9642 1.03ns -636357.08ns 98.58
BM3063 TC 9615 0.99ns 1668130.38+ 87.06
BG7049Hx TC 9613 1.14ns -383313.48ns 97.80
BM3066PRO2 SC 9570 1.22ns 3259669.73++ 86.38
DKB390 SC 9440 1.02ns 1825831.31+ 87.19
2B587PW SC 9424 0.97ns 551689.11ns 91.95
2B512PW TC 9336 0.81ns -165955.72ns 94.08
2B810PW SC 9257 1.12ns 2304586.26+ 87.41
BM840PRO SC 9170 1.12ns 1678390.30+ 89.64
30F35 SC 9089 1.01ns 4149347.19++ 78.27
20A55PW TC 8854 0.81ns 5334493.04++ 65.01
AS1573PRO MSC 8629 0.82ns 4744433.27++ 67.86
2B710PW SC 8522 0.88ns -766126.79ns 98.99
BRS3035 TC 8183 0.85ns 121582.74ns 92.58
BM820 SC 7835 1.16ns -461560.46ns 98.18
BM207 DC 7810 1.06ns 362942.76ns 94.04
BRS3060 TC 7709 0.81ns 1301865.92ns 84.23
CARGO DC 7640 0.65** -456417.02ns 94.30
BM915PRO SC 7505 0.91ns 4808234.22++ 72.19
DKB330PRO SC 7253 1.06ns 4966222.34++ 77.21
Interpretation of stability by the AMMI method was based on the distance to zero of the scores of points representing the hybrids and environments (Figure 1). A shorter distance indicates greater stability (DUARTE; VENCOVSKY, 1999). The hybrids that are positioned closer to the origin of the axes are SHS7920PRO, BM709PRO2, BRS1055, P3862H, AG7098PRO2, BM650PRO2, BG7049Hx, 2B710PW, BM820 and BM207. These hybrids contributed little to the total hybrid x environment interaction, and were considered more stable and to be of general adaptability, as they interacted less with the environments. However, the 2B710PW, BM820 and BM207 hybrids were not the most productive. Of the 29 hybrids under evaluation, 19 contributed the most to the hybrid x environment interaction, as they are the most distant from the source of the biplot and are therefore more unstable. All the environments being evaluated are distant from the origin of the axes, and contribute to the total hybrid x environment interaction. The adaptability of the hybrids in each crop environment was interpreted by observing the signs of the hybrid and environment scores. In AMMI analysis, when the vector that represents the cultivar on the Cartesian plane is close to the vector that represents a particular environment, it shows that the cultivar performs better in that environment
compared to the other cultivars (MIRANDAet al., 2009).
When the hybrids and environments are distant from the origin and close to each other, with scores of the same sign, this represents specific adaptability. In this way, the hybrids 20A55PW, BM915PRO and 30A16PW stood out in the Viçosa1 and Sete Lagoas environments. These environments were considered favourable by the Eberhart and Russell method (1966). The hybrids DKB330PRO and AS1573PRO display specific adaptability to the environment of São Miguel do Anta, considered unfavourable by the Eberhart and Russell method (1966).
In estimating individual broad-sense heritability (h2
g) by the method of mixed models, total genetic
dispersion is considered, which is relevant, since this research seeks to explore all the genetic variance between the hybrids (RESENDE; DUARTE, 2007). Estimated heritability was 0.70, considered of moderate magnitude for grain yield in maize (HALLAUER, MIRANDA FILHO; CARENA, 2010) (Table 4). The selection of maize hybrids based on predicted genotypic values is
therefore reliable (TORRESet al., 2015). The estimation
of accuracy, which measures the correlation between predicted values and actual values, was also high at 83.69%. It can therefore be inferred that the experimental precision was high (RESENDE, DUARTE, 2007), which
Figure 1 - AMMI biplot, with the first two principal components (PC1 and PC2) for grain yield (kg ha-1) evaluated in 29 commercial
agrees with the estimate of the experimental coefficient of variation (CVe = 14.49%). Results of similar magnitudes
were obtained by Mendeset al. (2012) when estimating
genetic parameters in 45 varieties of maize by the REML/ BLUP method. Those authors found high experimental precision with a CVe of 13.6% and an estimated accuracy of 97%. According to Resende (2007), experimental precision can be considered excellent in experiments with precision values greater than 90%.
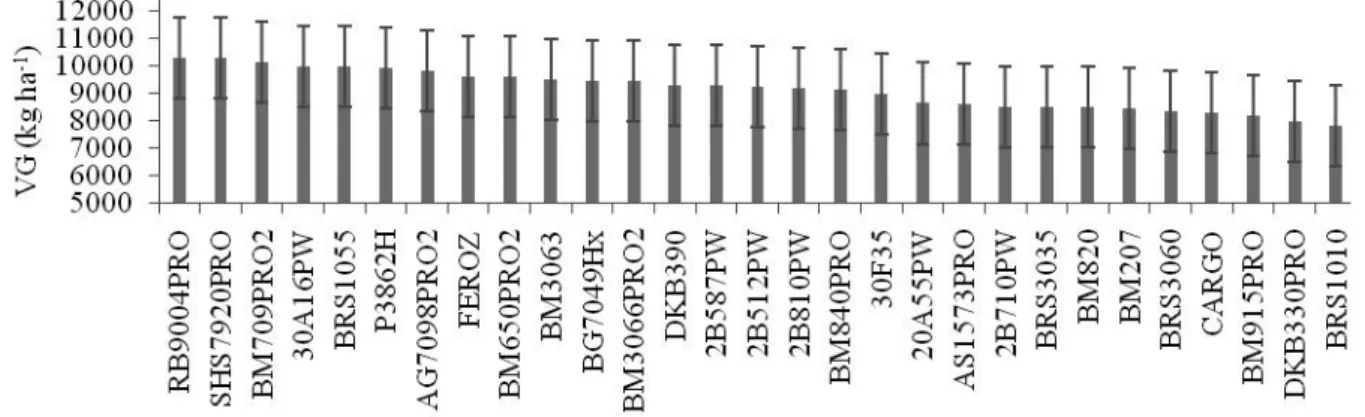
According to the confidence interval, the maize hybrids differed for grain yield, with hybrids RB9004PRO, SHS7920PRO, BM709PRO2, 30A16PW and BRS1055 displaying grain yields greater than
10,000 kg ha-1 (Figure 2). All are single hybrids and
recommended for production systems that employ high technology.
Figure 3 shows the results of the MHPRVG*GM measures of adaptability and stability, penalising the hybrids for instability through the environments and at the same time benefitting their response capacity to environmental improvement (RESENDE, 2007). Despite the significant hybrid x environment interaction, hybrids
Table 4 - Estimates of the genetic parameters for grain yield (kg ha-1) obtained with the REML/BLUP method, estimated in
29 maize hybrids in the 2014/2015 season, for five locations in Minas Gerais
of good adaptability and production stability were found. Hybrid RB9004PRO had the best performance, with a
MHPRVG*GM value of 11,078 kg ha-1, followed by
SHS7920PRO and BM709PRO2, with 11,067 and 10,821 kg ha-1 respectively.
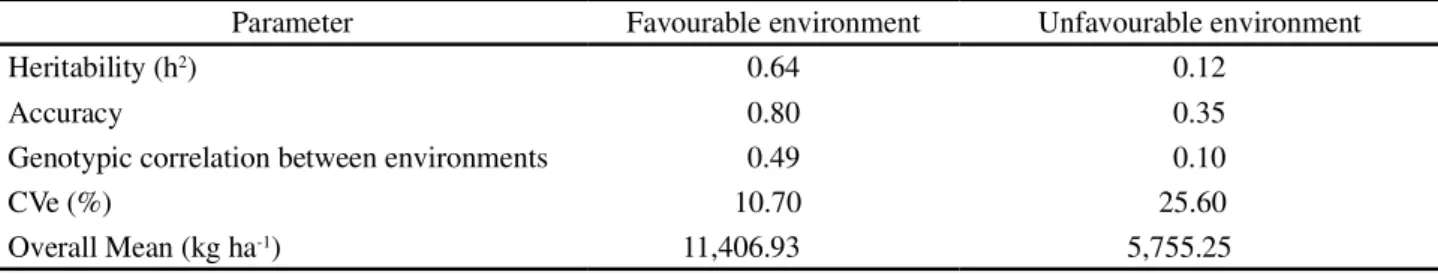
The MHPRVG method was also applied separately to the environments (Table 5). To this end, the five environments were divided into two groups, based on the average productivity of the hybrids in each location. The environments at Viçosa1, Viçosa2 and Sete Lagoas, with an average grain yield greater than the overall average
(9,146 kg ha-1), were considered favourable, and Coimbra
and São Miguel do Anta, with averages below this value, were considered unfavourable. Estimated heritability for grain yield was greater in the group of favourable environments (0.64) than in the group of unfavourable environments (0.12). This same trend was seen for estimated accuracy, 0.80 and 0.35 respectively. That is, favourable conditions provide greater experimental precision than unfavourable conditions. Average
productivity was 11,407 kg ha-1 for the favourable
environments, and 5,755 kg ha-1 for the unfavourable
environments.
The hybrids SHS7920PRO, RB9004PRO, BM709PRO2, 30A16PW, FEROZViptera, BM650PRO2, BRS1055, BM3063 and DKB390 displayed a productivity greater than the overall average in both the favourable and unfavourable environments; these were classified as having high adaptability. The hybrids 2B512PW, 2B587PW and 20A55PW were classified as having specific adaptability to unfavourable environments. The hybrids with specific adaptability to favourable environments were 2B810PW, AG7098PRO2, BG7049Hx, P3862H, BM840PRO and BM3066PRO2. The remaining hybrids did not achieve good performance in any of the environments, and were considered of minimal adaptability (Figure 4).
Figure 2 - Average genotypic values (VG) and their respective confidence intervals, for grain yield (kg ha-1) in 29 commercial maize
hybrids evaluated for five environments in Minas Gerais, in the 2014/2015 season
Parameter Estimate
Heritability (h2) 0.70
Accuracy 0.84
Genotypic correlation between environments 0.45
CVe (%) 14.49
Figure 3 - Mean values for MHPRVG*GM in 29 commercial maize hybrids evaluated for grain yield (kg ha-1) for five environments
in Minas Gerais, in the 2014/2015 season
Table 5 - Estimates of the genetic parameters for grain yield (kg ha-1) in favourable and unfavourable environments
Parameter Favourable environment Unfavourable environment
Heritability (h2) 0.64 0.12
Accuracy 0.80 0.35
Genotypic correlation between environments 0.49 0.10
CVe (%) 10.70 25.60
Overall Mean (kg ha-1) 11,406.93 5,755.25
There were similarities seen in the three methods used for indicating hybrids. Among the most productive hybrids, stable and of broad adaptability, and recommended by the Eberhart and Russell method, SHS7920PRO, BM709PRO2, BRS1055 and BM650PRO2 were also indicated by the AMMI analysis and the REM/BLUP method. For favourable environments, the Eberhart and Russell and the mixed-model REM/BLUP methods recommended the P3862H and AG7098PRO2 hybrids. According to the results, it can be seen that the use of more than one method to estimate genetic parameters is a strategy that allows for greater reliability in the interpretation of data for the subsequent recommendation of cultivars. For Cruz, Carneiro and Regazzi (2014), some methods are seen as alternatives, while others are complementary and can be used together.
CONCLUSIONS
1. The Eberhart and Russell, AMMI and mixed-model methods show similar results in classifying maize hybrids of broad adaptability;
2. There is a difference in the indication of hybrids of specific adaptability to favourable and unfavourable environments, which justifies the use of more than one method of evaluation;
3. Based on the three methods, the hybrids SHS7920PRO, BM709PRO2, BRS1055 and BM650PRO2 display general adaptability in the environments under evaluation; the hybrids P3862H and AG7098PRO2 displayed specific adaptability to favourable environments.
ACKNOWLEGMENTS
We thank the Foundation for Research Support of Minas Gerais State (Fapemig), the Brazilian Federal Agency for Support and Evaluation of Graduate Education (Capes), and the National Council for Scientific and Technological Development (CNPq) for financial support.
REFERENCES
BALESTRE, M. et al. Yield stability and adaptability of maize hybrids based on GGE biplot analysis characteristics.
Crop Breeding and Applied Biotechnology, v. 9, p. 219-228, 2009.
CARGNELUTTI FILHOet al. Associação entre métodos de adaptabilidade e estabilidade em milho.Ciência Rural, v. 39, p. 340-347, 2009.
CARDOSO, M. J.et al. Identificação de cultivares de milho com base na análise de estabilidade fenotípica no Meio-Norte brasileiro.
Revista Ciência Agronômica, v. 43, n. 2, p. 346-353, 2012. CARVALHO, E. V.et al. Adaptabilidade na produção de massa verde e grãos de genótipos de milho no Tocantins, Brasil.Revista Ciência Agronômica, v. 45, p. 856-862, 2014.
COMPANHIA NACIONAL DE ABASTECIMENTO.
Acompanhamento de safra brasileira: grãos, safra 2015/16, quarto levantamento. Brasília, 2016. Disponível em: http://www. conab.gov.br/OlalaCMS/uploads/arquivos/16_01_12_14_17_ 16_boletim_graos_janeiro_2016.pdf. Acesso em: 21 jan. 2016. CRUZ, C. C.et al.A cultura do milho. Sete Lagoas: Embrapa Milho e Sorgo, -, 2008. 517 p.
CRUZ, C. D. GENES: a software package for analysis in experimental statistics and quantitative genetics. Acta Scientiarum. Agronomy, v. 35, p. 271-276, 2013.
CRUZ, C. D.; CARNEIRO, P. C. S.; REGAZZI, A. J. Modelos biométricos aplicados ao melhoramento genético. 3. ed. Viçosa, MG: Editora UFV, 2014. 668 p.
DUARTE, J. B.; VENCOVSKY, R. Interação genótipos x ambientes: uma Introdução à análise AMMI. Ribeirão Preto: Sociedade Brasileira de Genética, 1999. 60 p.
EBERHART, S. A.; RUSSELL, W. A. Stability parameters for comparing varieties. Crop Science, v. 6, p. 36-40, 1966. FRITSCHE-NETO, R. et al. Updating the ranking of the coefficients of variation from maize experiments. Acta Scientiarum. Agronomy, v. 34, p. 99-101, 2012.
GAUCH, H. G.; ZOBEL, R. W. AMMI analysis of yield trials. In: KANG, M. S.; GAUCH, H. G. (Ed.). Genotype-by-environment proved and under what conditions this can be most environment interaction. Boca Raton, FL: CRC Press, p. 1-40. 1996.
HALDANE, J. B. S. The interaction of nature and nurture.
Annals of Eugenics, v. 13, p. 197-205, 1946.
HALLAUER, A. R.; MIRANDA FILHO, J. B.; CARENA M. J.Quantitative genetics in maize breeding. New York: Springer, 2010. 663 p.
MALDANER, L. J. et al. Exigências agroclimáticas da cultura do milho (Zea mays).Revista Brasileira de Energia Renováveis, v. 3, p. 13-23, 2014.
MENDES, F. F. et al. Adaptability and stability of maize varieties using mixed model methodology. Crop Breeding and Applied Biotechnology, v. 12, n. 2, p. 111-117, 2012. MIRANDA, G. V. et al. Multivariate analyses of genotype x environment interaction of popcorn. Pesquisa Agropecuária Brasileira, v. 44, n. 1, p. 45-50, 2009.
x environment interaction. Crop Breeding and Applied Biotechnology, v. 9, p. 299-307, 2009.
OLIVEIRA, R. B. R.; MOREIRA, R. M. P.; FERREIRA J. M. Adaptability and stability of maize landrace varieties.Semina: Ciências Agrárias, v. 34, n. 6, p. 2555-2564, 2013.
PIMENTEL-GOMES, F. Curso de estatística experimental. São Paulo: Nobel, 2000. 468 p.
R DEVELOPMENT CORE TEAM. R: a language and environment for statistical computing. Vienna, Austria: R Foundation for Statistical Computing, 2010.
RESENDE, M. D. V. O Software Selegen - REML/BLUP: sistema estatístico e seleção genética computadorizada via modelos lineares mistos. Colombo, PR: Embrapa Florestas, 2007. 359 p.
RESENDE, M. D. V.; DUARTE, J. B. Precisão e controle de qualidade em experimentos de avaliação de cultivares.Pesquisa Agropecuária Tropical, v. 37, p. 182-194, 2007.
RIOS, S. A. et al. Adaptability and stability of carotenoids in maize cultivars.Crop Breeding and Applied Biotechnology, v. 9, p. 313-319, 2009.
ROCHA, R. B. et al. Adaptabilidade e estabilidade da produção de café beneficiado em Coffea canéfora.Ciência Rural, v. 45, n. 9, p. 1531-1537, 2015.
SCAPIM, C. A.et al. Correlations between the stability and adaptability statistics of popcorn cultivars. Euphytica, v. 174, p. 209-218, 2010.
SILVA, G. O. et al. Verificação da adaptabilidade e estabilidade de populações de cenoura pelos métodos AMMI, GGE biplot e REML/BLUP. Bragantia, v. 70, n. 3, p. 494-501, 2011.
TORRES, F. E. et al. Interação genótipo x ambiente em genótipos de feijão-caupi semiprostrado via modelos mistos.