Mibefradil reduces blood glucose concentration in
db
/
db
mice
Yujie Lu,I Min Long,I Shiwen Zhou,IIZihui Xu,I* Fuquan Hu,IIIMing LiIV
IThird Military Medical University, Xinqiao Hospital, Department of Endocrinology, Chongqing, China.IIThird Military Medical University, Xinqiao Hospital, Clinical Pharmacology Institution, Chongqing, China. IIIThird Military Medical University, Xinqiao Hospital, Department of Microbiology Chongqing, China.IVTulane University, Department of Physiology, New Orleans/LA, United States.
OBJECTIVE: Numerous recent studies suggest that abnormal intracellular calcium concentration ([Ca2+] i) is a common defect in diabetic animal models and patients. Abnormal calcium handling is an important mechanism in the defective pancreatic b-cell function in type 2 diabetes. T-type Ca2+ channel antagonists lower blood
glucose in type 2 diabetes, but the mechanism remains unknown.
METHODS:We examined the effect of the Ca2+channel antagonist mibefradil on blood glucose in maledb/db
mice and phenotypically normal heterozygous mice by intraperitoneal injection.
RESULTS: Mibefradil (15 mg/kg, i.p., b.i.d.) caused a profound reduction of fasting blood glucose from 430.92¡20.46 mg/dl to 285.20¡5.74 mg/dl in three days. The hypoglycemic effect of mibefradil was reproduced by NNC 55-0396, a compound structurally similar to mibefradil but more selective for T-type Ca2+
channels, but not by the specific L-type Ca2+ channel blocker nicardipine. Mibefradil did not show such
hypoglycemic effects in heterozygous animals. In addition, triglycerides, basal insulin and food intake were significantly decreased by mibefradil treatment in thedb/dbmice but not in the controls. Western blot analysis, immunohistochemistry and immunofluorescence staining showed a significantly increased expression of T-type Ca2+channela-subunits Cav3.1 and Cav3.2 in liver and brain tissues fromdb/dbmice compared to those from
heterozygous animals.
CONCLUSIONS:Collectively, these results suggest that T-type Ca2+channels are potential therapeutic targets for
antidiabetic drugs.
KEYWORDS: Diabetes Mellitus; Hypoglycemic Effect; Insulin; Food Intake; T-type Ca2+Channel Antagonist.
Lu Y, Long M, Zhou S, Xu Z, Hu F, Li M. Mibefradil reduces blood glucose concentration indb/dbmice. Clinics. 2014;69(1):61-67. Received for publication onApril 28, 2013;First review completed onMay 15, 2013;Accepted for publication onMay 23, 2013 E-mail: [email protected]
Tel.: 86 2368755709 *corresponding author
& INTRODUCTION
The hallmark of type 2 diabetes mellitus is chronic hyperglycemia under both fasting and postprandial condi-tions. Numerous recent studies in diabetic animal models and patients suggest that abnormal intracellular calcium concentration ([Ca2+]i) is a common defect in both
insulin-dependent (type 1) and insulin-ininsulin-dependent (type 2) diabetes (1). Abnormal calcium handling is an important mechanism in the defective pancreatic b-cell function in type 2 diabetes (2). Dysregulation of [Ca2+]imay represent a
common factor underlying metabolic, cardiovascular, ocular and neural complications of diabetes mellitus (3). Clinical
administration of an L-type Ca2+antagonist has produced
no detrimental or beneficial effects on glucose tolerance (4,5). Cerebrocrast, an L- and T-type calcium channel inhibitor, decreases blood glucose and food intake and increases glucose uptake by the brain (6,7). However, the specific effects of T-type Ca2+channel antagonists on blood
glucose regulation remain unknown.
T-type Ca2+channels are different from other types of Ca2+
channels with regard to their kinetics, pharmacological properties and activation/inactivation voltage range (8,9). T-type Ca2+currents have been described in human pancreatic
islet cells (10,11). Studies on human islets have shown that a desensitization of glucose-induced insulin secretion is asso-ciated with [Ca2+]ielevation (12). T-type Ca2+current density
and the channels’ mRNA levels increase markedly in rat pancreatic islets treated with high glucose (13).
Mibefradil blocks both L-type and T-type Ca2+channels
(14). Clinically, mibefradil has significant therapeutic advan-tages in reducing blood pressure (15,16), preventing blood pressure-related arterial hypertrophy (17), lowering heart rate (18) and preventing and reducing hyperinsulinemia (19).
Copyrightß2014CLINICS– This is an Open Access article distributed under the terms of the Creative Commons Attribution Non-Commercial License (http:// creativecommons.org/licenses/by-nc/3.0/) which permits unrestricted non-commercial use, distribution, and reproduction in any medium, provided the original work is properly cited.
No potential conflict of interest was reported.
An analog of mibefradil, (1S,2S)-2-(2-(N-[(3-benzoimidazol-2-yl)propyl]-N-methylamino) ethyl)-6-fluoro 1,2,3,4-tetrahydro-1-isopropyl-2-naphtyl cyclopropanecarboxylate dihydrochloride [NNC 55-0396], is more selective for T-type Ca2+channels (20).
The molecular structure of NNC55-0396 is more similar to that of mibefradil than to that of the L-type Ca2+channel blocker
nicardipine (Figure 1). The clinical effect of NNC 55-0396 is unclear.
& MATERIALS AND METHODS
Experimental animals
Experimental (male BKS Cg-Dock 7 m+/+Lepr/J, db/db,
36–40 g) and control (male Dock7m+/+Leprdb
,db/+, hereafter
‘‘wild-type’’, 23–26 g) eight-week-old mice purchased from Jackson Laboratory (Bar Harbor, ME) were randomly divided into two main groups. The mice were further randomly separated into two sub-groups, for a total of four groups (n = 6 mice per group): the control placebo group, control drug intervention group, db/db placebo group and db/db
drug intervention group. Mice from both drug intervention
groups were injected with mibefradil (i.p., 15 mg/kg per injection, b.i.d, for all experiments; Sigma-Aldrich, St. Louis, MS) in 100ml normal saline with 0.05% DMSO. Normal saline with 0.05% DMSO was given to both placebo groups in an identical manner. During the drug intervention, fasting blood glucose (food deprivation for eight hours), blood pressure, body weight, food intake and insulin tolerance (by insulin tolerance test (ITT)) were continually measured. At the end of treatments, blood, liver and brain samples were collected.
The animal experimental protocol was approved by the Institutional Animal Care and Use Committee of the Third Military Medical University. The organs of the animals were removed for histochemical analysis after euthanasia.
Immunoassay for insulin, glycosylated hemoglobin A1c and total cholesterol measurements
Mouse cardiac blood (0.8 ml) was stored at 4
˚
C for three to four hours. After coagulation and clot retraction, samples were centrifuged at X1,000g for ten minutes, and serum was stored at 220˚
C for later use. Serum basal insulin was measured using an insulin ELISA kit from Merodia (Uppsala, Sweden); HbA1c and total cholesterol were measured by using ELISA kits from R&D Systems (Minneapolis, MN).Western blot analysis
The tissue samples (50 mg) were homogenized in lysis buffer (Thermo Fisher Scientific Inc, Waltham, MA) contain-ing a protease inhibitor cocktail (Roche, Basel, Sweden) and then centrifuged at X9,000g rpm for 15 minutes at 4
˚
C. The supernatants were denatured and loaded for electrophoresis at a volume containing 90mg total protein. After separation, the proteins were transferred to polyvinylidene fluoride (PVDF) membranes. Blotted membranes were incubated overnight with primary antibodies against ß-tubulin (Santa Cruz Biotechnology Inc, Santa Cruz, CA, 1:200),a1G (Bioss, China, 1:200) and a1H (Santa Cruz Biotechnology Inc, 1:200). The membranes were then incubated with appro-priate secondary antibodies at room temperature for 1.5 hours before detection with a chemiluminescence kit (Beyotime, BeyoECL Plus, China).Immunohistochemical analysis
The expression levels of Cav3.1 and Cav3.2 were evaluated using standard immunohistochemistry methods. Figure 1 -Chemical structure of calcium channel blockers.
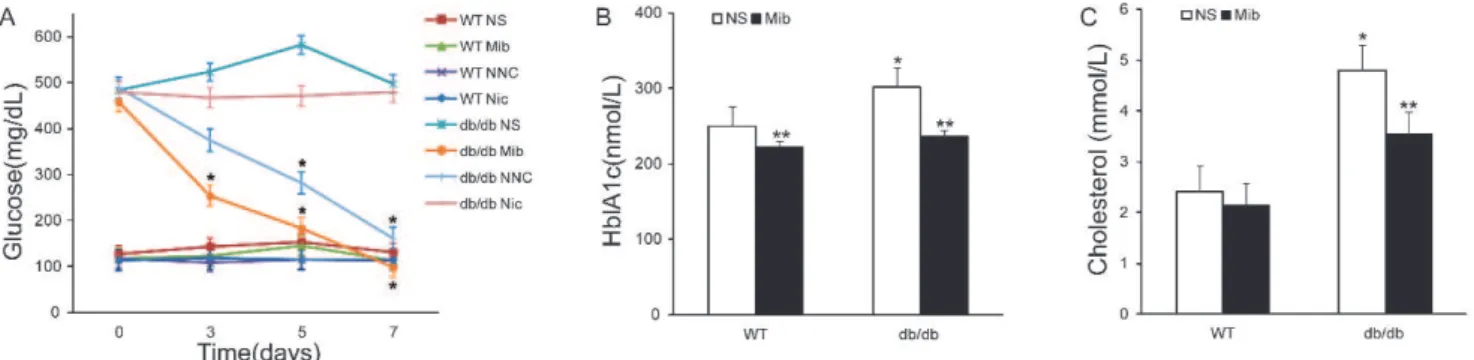
Figure 2 -The hypoglycemic and hypolipidemic effects of Ca2+channel antagonists indb/dbmice.A)Time-dependent changes in blood
glucose concentration during drug treatment. B) Serum HbA1c in mice with and without mibefradil injection. C) Serum total
cholesterol in mice with and without mibefradil injection. Abbreviations: WT, nondiabetic wild-type mice;db/db, db/dbmice; NS,
normal saline; Mib, mibefradil; NNC, NNC 55-0396; Nic, nicardipine. *p,0.05, n = 6, compared with WT NS group; **p,0.05, n = 6,
Fresh tissue samples were washed with PBS, followed by paraformaldehyde fixation (4%) and paraffin embedding. The samples were sliced into 4mm serial sections for xylene dewaxing and alcohol dehydration. After blocking nonspecific antigens with goat serum, the samples were incubated over-night at 4
˚
C with diluted primary antibodies (50ml). Then, biotin-labeled secondary antibodies were added for incubation at room temperature for one hour in the dark. The samples were then stained with DAPI for five minutes in the dark, dried and sealed with anti-fluorescence quenching mounting medium and kept at 4˚
C in the dark. Samples without primary antibodies were employed as negative controls.Statistical analysis
All data are expressed as the mean ¡ SEM. Statistical analyses were performed with Student’s t-test or ANOVA according to the specific application. P-values #0.05 were considered significant. Data were organized with Adobe Illustrator CS3 and analyzed with SPSS 17.0 (Statistical Product and Service Solutions, IBM, Chicago, USA). Statistical significance for Western blot experiments was determined by analyzing gray-level values using Quantity One software.
& RESULTS
The effects of Ca2+channel antagonists on blood glucose
were examined in db/db mice. As shown in Figure 2A,
mibefradil (15 mg/kg, b.i.d) intraperitoneal injection sig-nificantly decreased blood glucose concentration from 430.92¡20.46 mg/dl to 285.20¡5.74 mg/dl (n = 6, p,0.05) by day 3. Fasting blood glucose decreased to a level similar to that of wild-type controls at day 5. The injection of normal saline (with 0.05% DMSO vehicle) had no effect on blood glucose indb/dbmice. The application of NNC 55-0396, an antagonist that is more specific to the T-type Ca2+channel
(21) at the same dose (15 mg/kg, b.i.d), also effectively reduced blood glucose. In contrast, the L-type Ca2+channel
blocker nicardipine (12.5 mg/kg, b.i.d) had no significant effect on blood glucose when administered at a concentra-tion commonly used for in vivo study (22). These results indicate that Ca2+ channel antagonists have a profound
blood glucose-lowering effect indb/dbmice, and this effect is likely attributed to the inhibition of T-type Ca2+channels
rather than any effects on L-type Ca2+ channels. The
application of mibefradil, NNC 55-0396 or nicardipine for one week had no significant effect on fasting blood glucose in wild-type mice (Figure 2A), indicating that the effects of T-type Ca2+channel blockers are specific to thedb/dbmice.
The effects of T-type Ca2+ channel blockers on blood
glucose were also evaluated by measuring hemoglobin glycosylation in db/db and wild-type mice. Similar to the above results, mibefradil effectively reduced HbA1c in
db/db mice from 301.5¡9.50 to 236.9¡9.83 (p,0.05, n = 6; Figure 2B). Interestingly, mibefradil slightly reduced HbA1c
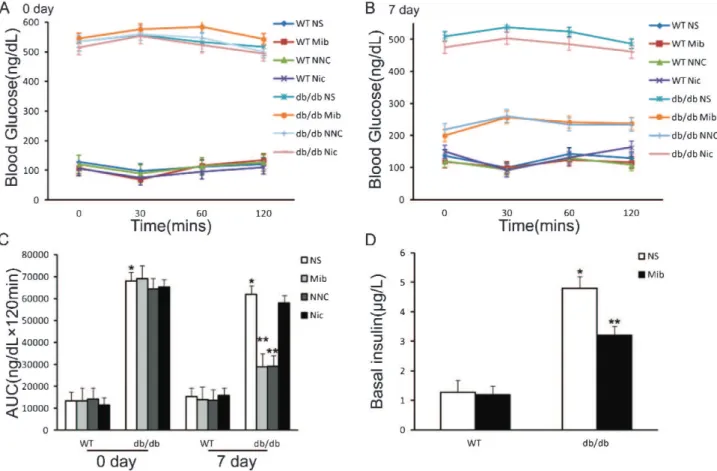
Figure 3 -Effects of mibefradil on insulin sensitivity and basal insulin release in diabetic and nondiabetic mice. A and B)Glucose
disposal measured by insulin tolerance test (ITT) before (A) and after (B) mibefradil treatment for seven days.C)Difference in the area
under the curve before and after drug injection.D)Effect of mibefradil on basal insulin in diabetic and nondiabetic mice. *p,0.05,
n = 6, compared with WT NS group; **p,0.05, n = 6, compared with NS group of the same type of mice at the same time. Statistical
in wild-type animals (from 250.0¡8.28 to 221.7¡4.50 nmol/ L,p,0.05, n = 6), which indicates a physiological role for T-type Ca2+channels in glucose regulation in normal mice.
The effect of mibefradil on blood triglycerides was evaluated in db/db mice. Figure 2C shows that after one week of mibefradil treatment, plasma cholesterol was significantly reduced (p,0.05, n = 6) in a manner similar to the reduction of blood glucose. In contrast, there was no significant change in cholesterol level between the wild-type mice with and without the treatment with mibefradil. Cholesterol was significantly different between db/db and wild-type control groups (p,0.05, n = 6).
To delineate the mechanism underlying the effects of T-type Ca2+ channel antagonists on blood glucose in db/db
mice, an ITT was performed after six hours of fasting. Mice were injected intraperitoneally with porcine insulin (Xinbai Pharmaceutical, Nanking, China) at 0.75 unit/kg of body weight. Blood glucose was measured from tail bleeds taken at the indicated times. Figures 3A and 3B show the results of ITTs before and after three days of mibefradil injection in wild-type and db/db mice. The ITT results show no significant difference in the glucose tolerance in response to insulin stimulation between the mibefradil-treated and saline-treated groups (Figures 3A, 3B, 3C). This similar
response may be attributed to the existing high level of insulin in thedb/dbmice, which may have attenuated the effects of further insulin application. In contrast, basal insulin (after food deprivation for eight hours) indb/dbmice was significantly reduced by seven days of treatment with mibefradil, from 4.80¡0.35 to 3.21¡0.12 ng/ml (p,0.05, n = 6) (Figure 3D). This finding indicates that T-type Ca2+
channel antagonists suppress insulin release from pancrea-tic b-cells of db/db mice. Therefore, T-type Ca2+ channels
may play a role in the pathogenesis of hyperinsulinemia in this type 2 diabetic model.
The maintenance of the basal glucose level is regulated by the release of glucose from the liver and the uptake of glucose into muscle, adipose and brain tissue. The profound blood glucose-lowering effect of T-type Ca2+ channel
Figure 4 -Western blot analysis of T-type Ca2+channel expression
in liver and brain tissues of diabetic and nondiabetic mice.
Increased expression ofa1G (Cav3.1) anda1H (Cav3.2) subunits
of T-type Ca2+channels (n = 3). The molecular weights of Cav3.1
and Cav3.2 are,262 kDa. *p,0.05, n = 6, compared with WT NS
group. Statistical analyses were performed with ANOVA.
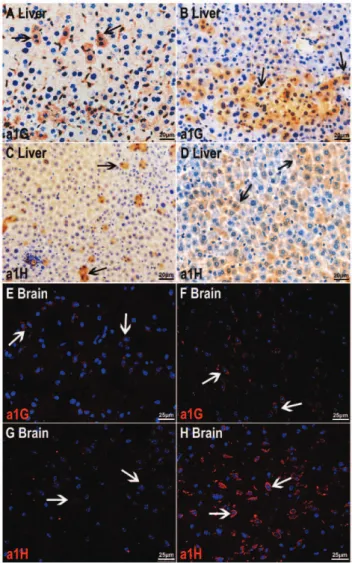
Figure 5 -Immunohistochemical and immunofluorescence
stain-ing showstain-ing an increased expression ofa1G anda1H subunits of
T-type Ca2+channels in liver and brain slide preparations.A and
C)Immunohistochemical staining for T-type Ca2+channela1G (A)
anda1H (C) subunits in liver slide preparations from non-diabetic
mice (scale bar = 20mm).B and D)Immunohistochemical staining
ofdb/dbanimal liver preparations (scale bar = 20mm).E and G)
Immunofluorescence staining showing the expression ofa1G (E)
and a1H (G) subunits of T-type Ca2+ channels in brain slide
preparations from nondiabetic mice (scale bar = 25mm).F and H)
Immunofluorescence staining of brain slide preparations from
antagonists under high insulin concentrations suggests that the target organs of mibefradil may include the liver and the brain, which is the upper-level control center for hepatic glucose production. We examined the protein levels of Cav3.1 (a1G) and Cav3.2 (a1H)a1 subunits of T-type Ca2+channels
in the liver and brain ofdb/dbmice and control wild-type mice. As shown in Figure 4, both Cav3.1 and Cav3.2 in the liver and brain were significantly higher indb/dbmice. These data may explain the difference in the blood glucose-lowering effects of mibefradil and NNC 55-0396 observed indb/dband
wild-type animals. These findings also suggest that the targets of mibefradil and NNC 55-0396 are in the liver and the brain in addition to pancreatic b-cells. Immunohisto-chemistry confirmed the results of Western blot analysis. Figure 5 shows that the expression of a1G and a1H was higher indb/dbliver (Figure 5B and 5D) and brain (Figure 5F and 5H) preparations compared to those in the wild-type animals.
Because db/db mice are characterized by continual feeding as a result of a mutation in the leptin receptor, we
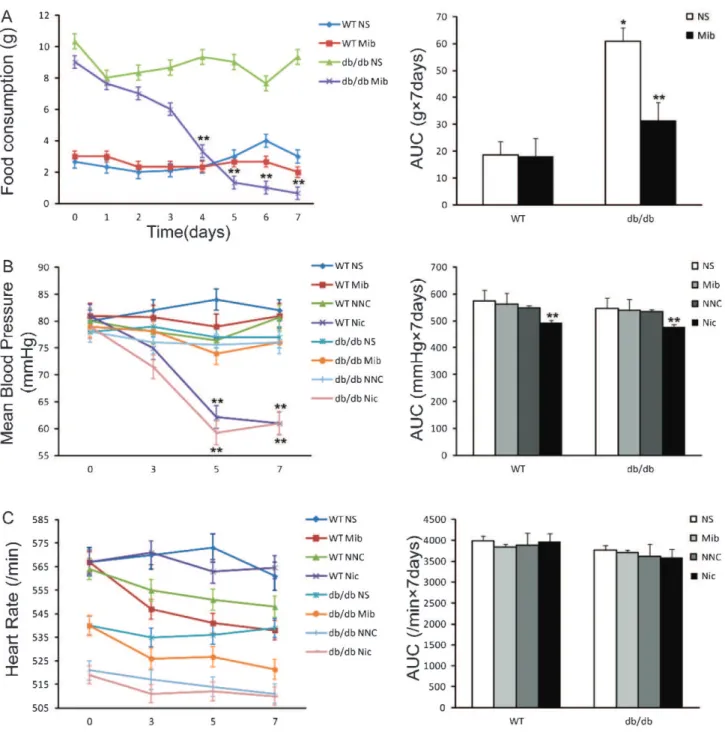
Figure 6 -Effects of mibefradil and/or nicardipine on the food consumption, mean blood pressure and heart rate ofdb/dband
nondiabetic mice.A)Effect of mibefradil injection on the food intake of diabetic and nondiabetic mice.B)Effects of mibefradil and
nicardipine on the mean blood pressure of diabetic and nondiabetic mice.C)Effects of mibefradil and nicardipine on the heart rate of
diabetic and nondiabetic mice. *p,0.05, n = 6, compared with WT NS group; **p,0.05, n = 6, compared with NS group of the same
also set up experiments to evaluate the effect of mibefradil and NNC 55-0396 on the feeding behavior of these animals. Mibefradil significantly reduced the food consumption of
db/db mice but had no significant effect on the control animals (Figure 6A). This result also suggests mibefradil has a central nervous system (CNS) target that may affect the feeding behavior of the diabetic animals (15,16).
Mibefradil also has antihypertensive effects; thus, we examined the effects of mibefradil and NNC 55-0396 on the cardiovascular functions of db/db mice. The mean blood pressure (MBP) and heart rate after drug injection in thedb/
dband wild-type mice showed no significant difference in MBP (Figure 6B) or heart rate (Figure 6C) among mibefradil-, NNC 55-0396- and vehicle-treated groups. The physiological functions of T-type Ca2+channels in cardiovascular
regula-tion indb/dbmice remain unclear.
& DISCUSSION
The db/db mouse is a well-established diabetic rodent model for studying the mechanisms of hyperglycemia, hyperinsulinemia, hyperlipidemia and related metabolic abnormalities. The present study is the first attempt to utilize this model for characterizing the role of T-type Ca2+
channels in hyperglycemiain vivo. The hallmark of diabetes mellitus is chronically high fasting blood glucose, resulting from impaired insulin sensitivity in the peripheral tissues and defective insulin production by pancreatic b-cells. Using the db/db model, we showed that T-type Ca2+
channels might be novel therapeutic targets for hyperglyce-mia and that antagonists of T-type Ca2+ channels might
lower basal glucose by reducing liver glucose output and decreasing basal insulin release or synthesis by pancreatic
b-cells (Figure 7).
Basal insulin release from pancreatic b-cells may be controlled by a different mechanism from glucose-stimu-lated insulin release. Hyperinsulinemia is commonly observed in pre-diabetic and type 2 diabetic patients. Chronic exposure to elevated insulin may result in the development of insulin resistance (23) and, in our opinion, may also lead to the attenuation of first-phase insulin release observed in type 2 diabetic patients. Therefore, the fact that T-type Ca2+ channel antagonists can reduce the
basal insulin is certainly an encouraging result because it may not have a significant impact on glucose-stimulated insulin release, which is mostly mediated by the activation of L-type Ca2+channels.
We have shown that T-type Ca2+ channel antagonists
significantly reduced basal insulin release in wild-type animals compared to untreated db/db diabetic animals, indicating that the basal release of insulin from pancreaticb -cells might involve a T-type Ca2+ channel-mediated
mechanism. However, residual basal insulin is still elevated after T-type Ca2+channel antagonist treatment, suggesting
that T-type Ca2+ channel antagonists may also suppress
glucose output from the liver during fasting.
As shown in Figure 3, the results of ITT indicated that treatment with T-type Ca2+ channel antagonists failed to
improve glucose disposal in db/db mice compared to untreated animals. We are currently unable to draw a definitive conclusion about the effects of these drugs on improving insulin sensitivity in muscle, adipose or brain tissue. It is possible that thedb/dbmouse is not a suitable model for studying the role of T-type Ca2+ channels in
insulin sensitivity because the hyperglycemia of thedb/db
mice cannot be reversed by an injection of insulin (The Jackson Laboratory, http://jaxmice.jax.org/list/ra66.html).
The overexpression of T-type Ca2+channela1G anda1H
subunits indb/dbmice compared with the wild-type animals suggests that either a genetic predisposition favors the T-type Ca2+channels or a secondary pathological regulation of these
proteins occurs in these mice. Nevertheless, the fact that T-type Ca2+ channel antagonists have an effect on glucose
regulation in wild-type animals (Figure 2B) suggests that T-type Ca2+channels may also have physiological functions in
non-diabetic animals at low expression levels.
Further investigation is required to confirm the effects of T-type Ca2+channel antagonists on metabolic regulation in
the CNS. The results of the present study show an increased expression of T-type Ca2+channela1G anda1H subunits in
the brain ofdb/dbmice, suggesting that these channels may play critical roles in the mechanisms of hyperglycemia and hyperlipidemia in these animals. We also show that T-type Ca2+channel antagonists caused a decrease in appetite in
the later phases of drug treatment, as well as a decrease in body weight (data not shown), indb/dbmice, indicating that T-type Ca2+ channels indeed play an important role in
metabolic regulation in db/db mice; nevertheless, further investigation of this subject is necessary.
& ACKNOWLEDGMENTS
This work was supported by The Natural Science Foundation of the Chongqing Science & Technology Commission (No. 2008B119) and a Clinical Research Award [2008C169] from Third Military Medical University. The authors thank Dr. Zhiming Zhu (High Blood Pressure Endocrine Division, Daping Hospital, Third Military Medical University) for kindly providing advice on mouse blood pressure and heart rate monitoring instruments and Dr. Guansong Wang (Institute of Respiratory Diseases, Xinqiao Hospital, Third Military Medical University) for generously providing the experimental conditions. The authors also thank Dr. Jonathan Pottle and Dr. Suresh C. Sikka for assistance in the preparation of this manuscript.
& AUTHOR CONTRIBUTIONS
Lu Y, Li M and Xu Z participated in the research design. Lu Y, Long M and Xu Z conducted the experiments. Lu Y, Long M, Li M, Zhou S, Hu F
Figure 7 -A diagram showing the possible targeting sites of mibefradil on the system regulating basal glucose. (+), secretion
and Xu Z contributed to the new reagents or analytic tools. Lu Y, Zhou S, Hu F, Li M and Xu Z performed the data analysis. Li M, Lu Y and Xu Z wrote the manuscript.
& REFERENCES
1. Massry SG, Smogorzewski M. Role of elevated cytosolic calcium in the pathogenesis of complications in diabetes mellitus. Miner Electrolyte Metab. 1997;23(3-6):253-60.
2. Roseman P, Braun M, Zhang Q. Regulation of calcium in pancreatica -and b-cells in health and disease. Call Calcium. 2012;51(3-4):300-8, http://dx.doi.org/10.1016/j.ceca.2011.11.006.
3. Levy J, Gavin JR 3rd, Sowers JR. Diabetes mellitus: a disease of abnormal cellular calcium metabolism? Am J Med. 1994;96(3):260-73.
4. Savage S, Miller LA, Schrier RW. The future of calcium channel blocker therapy in diabetes mellitus. J Cardiovasc Pharmacol. 1991;18 Suppl 1:S19-24. 5. Fukao K, Shimada K, Hiki M, Kiyanagi T, Hirose K, Kume A, et al. Effects of calcium channel blockers on glucose tolerance, inflammatory state, and circulating progenitor cells in non-diabetic patients with essential hypertension: a comparative study between azelnidipine and amlodipine on glucose tolerance and endothelial function - a crossover trial (AGENT). Cardiovasc Diabetol. 2011;10:79, http://dx.doi.org/10. 1186/1475-2840-10-79.
6. Briede J, Stivrin¸a M, Stoldere D, Bisenieks E, Uldrik¸is J, Poika¯ns J, et al. Effect of new and known 1,4-dihydropyridine derivatives on blood glucose levels in normal and streptozotocin-induced diabetic rats. Cell Biochem Funct. 2004;22(4):219-24, http://dx.doi.org/10.1002/cbf.1091. 7. Briede J, Stivrina M, Stoldere Dz, Vigante B, Duburs G. Effect of
cerebrocrast, a new long-acting compound on blood glucose and insulin levels in rats when administered before and after STZ-induced diabetes mellitus. Cell Biochem Funct. 2007;25(6):673-80, http://dx.doi.org/10. 1002/cbf.1372.
8. Fox AP, Nowycky MC, Tsien RW. Kinetic and pharmacological proper-ties distinguishing three types of calcium currents in chick sensory neurons. J Physiol. 1987;394:149-72.
9. Bean BP. Classes of calcium channels in vertebrate cells. Annu Rev Physiol. 1989;51:367-84, http://dx.doi.org/10.1146/annurev.ph.51.030189.002055. 10. Misler S, Barnett DW, Gillis KD, Pressel DM. Electrophysiology of
stimulus-secretion coupling in human beta-cells. Diabetes. 1992; 41(10):1221-8, http://dx.doi.org/10.2337/diab.41.10.1221.
11. Davalli AM, Biancardi E, Pollo A, Socci C, Pontiroli AE, Pozza G, et al. Dihydropyridine-sensitive and -insensitive voltage-operated calcium channels participate in the control of glucose-induced insulin release from human pancreatic beta cells. J Endocrinol. 1996;150(2):195-203, http://dx.doi.org/10.1677/joe.0.1500195.
12. Bjo¨rklund A, Lansner A, Grill VE. Glucose-induced [Ca2+]
iabnormalities in human pancreatic islets: important role of overstimulation. Diabetes. 2000;49(11):1840-8, http://dx.doi.org/10.2337/diabetes.49.11.1840. 13. Zhang M, Zhuang H, Bhattacharjee A, Li M. High glucose elevated
T-type calcium channel expression and basal [Ca2+]
iin rat islet beta cells. Biophysical J. 2000;78(suppl):69A.
14. Wu S, Zhang M, Vest PA, Bhattacharjee A, Liu L, Li M. A mibefradil metabolite is a potent intracellular blocker of L-type Ca(2+) currents in pancreatic beta-cells. J Pharmacol Exp Ther. 2000;292(3):939-43. 15. Hefti F, Clozel JP, Osterrieder W. Antihypertensive properties of the
novel calcium antagonist (1S,2S)-2-[2-[[3-(2-benzimidazolyl)propyl]-methylamino] ethyl]-6- fluoro-1,2,3,4-tetrahydro-1-isopropyl-2-naphthyl methoxyacetate dihydrochloride in rat models of hypertension. Comparison with verapamil. Arzneimittelforschung. 1990;40(4):417-21. 16. Bernink PJ, Prager G, Schelling A, Kobrin I. Antihypertensive properties
of the novel calcium antagonist mibefradil (Ro 40-5967): a new generation of calcium antagonists? Mibefradil International Study Group. Hypertension. 1996;27(3 Pt 1):426-32.
17. Li JS, Schiffrin EL. Effect of short-term treatment of SHR with the novel calcium channel antagonist mibefradil on function of small arteries. Am J Hypertens. 1997;10(1):94-100.
18. Clozel JP, Osterrieder W, Kleinbloesem CH, Welker HA, Schla¨ppi B, Tudor R, et al. Ro 40-5967: A new nondihydropyridine calcium antagonist. Cardiovasc Drug Rev. 1991;9(1):4-17, http://dx.doi.org/10. 1111/j.1527-3466.1991.tb00539.x.
19. Verma S, Bhanot S, Hicke A, McNeill JH. Chronic T-type Ca2+channel blockade with mibefradil in hyperinsulinemic, insulin-resistant and hypertensive rats. Cardiovasc Res. 1997;34(1):121-8, http://dx.doi.org/ 10.1016/S0008-6363(97)00032-1.
20. Huang L, Keyser BM, Tagmose TM, Hansen JB, Taylor JT, Zhuang H, et al. NNC 55-0396 [(1S,2S)-2-(2-(N-[(3-Benzimidazol-2-l)propyl]-Nmethylamino) ethyl)-6-fluoro-1,2,3,4-tetrahydro-1-isopropyl-2-naphtyl cyclopropanecarboxylate dihydrochloride]: A new selective inhibitor of T-type calcium channels. J Pharmacol Exp Ther. 2004;309(1):193-9, http://dx.doi.org/10.1124/jpet.103.060814.
21. Li M, Hansen JB, Huang L, Keyser BM, Taylor JT. Towards selective antagonists of T-type calcium channels: design, characterization and potential applications of NNC 55-0396. Cardiovasc Drug Rev. 2005; 23(2):173-96.
22. Hiyoshi H, Yayama K, Takano M, Okamoto H. Angiotensin type 2 receptor-mediated phosphorylation of eNOS in the aortas of mice with 2-kidney, 1-clip hypertension. Hypertension. 2005;45(5):967-73, http://dx. doi.org/10.1161/01.HYP.0000164571.77710.19.