Submitted16 November 2015
Accepted 23 February 2016
Published15 March 2016
Corresponding author
Wei Cheng Yang, [email protected]
Academic editor
Esta Sterneck
Additional Information and Declarations can be found on page 11
DOI10.7717/peerj.1810
Copyright
2016 Chen et al.
Distributed under
Creative Commons CC-BY 4.0
OPEN ACCESS
Selection of reference genes for
RT-qPCR studies in blood of beluga
whales (
Delphinapterus leucas
)
I-Hua Chen1, Jiann-Hsiung Wang1, Shih-Jen Chou1, Yeong-Huey Wu2,
Tsung-Hsien Li3, Ming-Yih Leu3,4, Wen-Been Chang3and Wei Cheng Yang1
1Department of Veterinary Medicine, National Chiayi University, Chiayi, Taiwan, ROC
2Department of Veterinary Medicine, National Pingtung University of Science and Technology, Pingtung, Taiwan, ROC
3Department of Biology, National Museum of Marine Biology and Aquarium, Pingtung, Taiwan, ROC 4Graduate Institute of Marine Biology, National Dong Hwa University, Pingtung, Taiwan, ROC
ABSTRACT
Reverse transcription quantitative PCR (RT-qPCR) is used for research in gene expression, and it is vital to choose appropriate housekeeping genes (HKGs) as reference genes to obtain correct results. The purpose of this study is to determine stably expressed HKGs in blood of beluga whales (Delphinapterus leucas) that can be the appropriate reference genes in relative quantification in gene expression research. Sixty blood samples were taken from four beluga whales. Thirteen candidate HKGs (ACTB,B2M,
GAPDH,HPRT1,LDHB,PGK1,RPL4,RPL8,RPL18,RPS9,RPS18,TFRC,YWHAZ)
were tested using RT-qPCR. The stability values of the HKGs were determined by four different algorithms. Comprehensive analysis of the results revealed that RPL4, PGK1 and ACTB are strongly recommended for use in future RT-qPCR studies in beluga blood samples. This research provides recommendation of reference gene selection, which may contribute to further mRNA relative quantification research in the peripheral blood leukocytes in captive cetaceans. The gene expression assessment of the immune components in blood have the potential to serve as an important approach to evaluating cetacean health influenced by environmental insults.
SubjectsMarine Biology, Molecular Biology
Keywords Beluga, Housekeeping, Quantitative PCR, Gene expression
INTRODUCTION
(2006)reported that, in dogs, the most stable control genes were ribosomal protein S5 in the liver, kidney, and mammary glands, beta 2-microglobulin (B2M) in the left ventricle, and ribosomal protein L8 (RPL8) in the prostate, indicating each tissue type has its specific stably-expressed HKG even within the same species. Vorachek, Bobe & Hall (2013)and Vorachek et al. (2013)reported that for neutrophils, the most stable gene was glucose-6-phosphate dehydrogenase (G6PD) in sheep, while in bovine calves, the most stable genes were phosphoglycerate kinase I (PGK1) and tyrosine 3-monooxygenase/tryptophan 5-monooxygenase activation protein zeta (YWHAZ); however,G6PDwas ranked fifth in 10 genes tested. It has been suggested that using an inappropriate reference gene could lead to incorrect normalized data, leading to misinterpretation of the results (Dheda et al., 2005). Therefore, selecting a suitable reference gene is needed when studying a new species or tissue type.
Cytokine gene expression research has been conducted in both free-ranging and human-cared cetaceans. Studying the correlation between cytokine gene expression and pollutants in free-ranging cetaceans can make these mammals useful sentinels for indicating the environmental status (Beineke et al., 2007;Buckman et al., 2011). Cytokine gene expression analysis has also been used as a diagnostic tool in analyzing immune status and stress induced by capture–release assessment in dolphins (Mancia, Warr & Chapman, 2008). Moreover, it has been used to evaluate the effectiveness of vaccine treatment and implicate the best duration for vaccination in human-cared cetaceans (Sitt et al., 2010). Most of the cetaceans in human care facilities have been trained to undergo voluntary blood collection, and the examination frequency can be increased when intensive monitoring is needed. The quantitative analysis of cytokine gene expression in cetacean blood could offer information, in addition to regular blood examination, for estimating the immune status of the animal and facilitating the medical treatment and health management. The most important first step to obtain an accurate assessment of cytokine gene expression in cetacean blood samples is determining the most stably expressed HKG as the reference gene. The purpose of this study is to select the reference gene in blood samples from beluga whales (Delphinapterus
leucas), which are one of the most commonly found cetacean species in human care. It
would provide fundamental and practical information for the quantitative analysis of cytokine gene expression and contribute to preventive medicine and early diagnosis in human-cared cetaceans.
MATERIALS AND METHODS
Sample collection and preservation
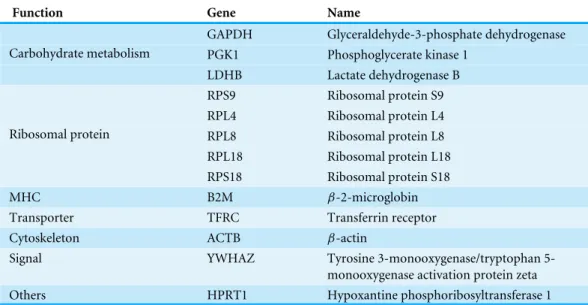
Table 1 Function, symbol and name of HKGs in this study.
Function Gene Name
GAPDH Glyceraldehyde-3-phosphate dehydrogenase PGK1 Phosphoglycerate kinase 1
Carbohydrate metabolism
LDHB Lactate dehydrogenase B RPS9 Ribosomal protein S9 RPL4 Ribosomal protein L4 RPL8 Ribosomal protein L8 RPL18 Ribosomal protein L18 Ribosomal protein
RPS18 Ribosomal protein S18
MHC B2M β-2-microglobin
Transporter TFRC Transferrin receptor
Cytoskeleton ACTB β-actin
Signal YWHAZ Tyrosine 3-monooxygenase/tryptophan
5-monooxygenase activation protein zeta Others HPRT1 Hypoxantine phosphoribosyltransferase 1
various body conditions including clinically healthy condition (30 samples from four animals), inflammation (six samples from four animals), skin lesions (nine samples from two animals), and internal diseases with various abnormalities in blood work and cytology (15 samples from three animals). Five hundred microliter EDTA-anticoagulated whole blood was fixed in 1.3 mL RNAlaterR (Ambion, Foster City, CA, USA) within 5 min after drawn. Samples were stored at 4 ◦C in the first 24 h, and then moved to −20 ◦C for
long-term storage.
RNA extraction and cDNA synthesis
Total RNA of the samples was extracted using Ribo-PureTM-Blood kit reagent (Ambion)
according to the manufacturer’s instructions. RNA ArmorTMReagent (ProTech, Pittsburgh, PA, USA) was added into RNA solution to eliminate contaminated RNase. RNA concentration was determined using QubitTMfluorometer with Quant-iTTMRNA Assay
Kit (Invitrogen, Carlsbad, CA, USA). RNA quantity of all samples was adjusted into 100 ng to keep all the samples on the same starting basis. RNA was treated with genomic DNA (gDNA) wipeout solution (Qiagenen, Valencia, CA, USA) before added into reverse transcription working solution. RNA samples after gDNA elimination were tested using qPCR directly to ensure no residue gDNA, which would interfere the analysis of mRNA expression. QuantiTectR Reverse Transcription kit (Qiagen), provided blend of oligo-dT and random primers, was used for cDNA synthesis. Complementary DNA and the remaining extracted RNA were put into−80 ◦C for long-term storage.
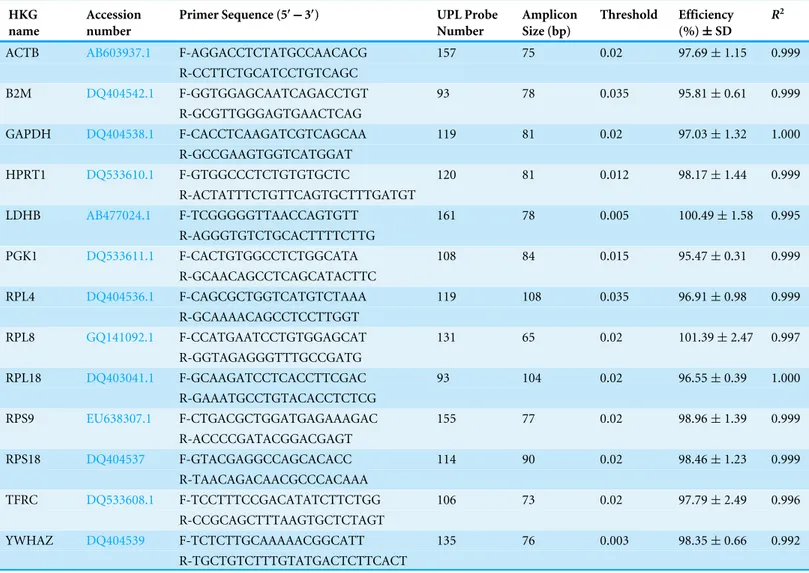
Primer and probe design
Sequences of the 13 candidate cetacean HKGs (ACTB,B2M,GAPDH,HPRT1,LDHB,
PGK1,RPL4,RPL8,RPL18,RPS9,RPS18,TFRC,YWHAZ) were obtained from bottlenose
Table 2 Name, accession number, primer sequence, probe number, amplicon size, efficiency andR2of 13 candidate HKGs.
HKG name
Accession number
Primer Sequence (5′−3′) UPL Probe Number
Amplicon Size (bp)
Threshold Efficiency (%)±SD
R2
ACTB AB603937.1 F-AGGACCTCTATGCCAACACG 157 75 0.02 97.69±1.15 0.999 R-CCTTCTGCATCCTGTCAGC
B2M DQ404542.1 F-GGTGGAGCAATCAGACCTGT 93 78 0.035 95.81±0.61 0.999 R-GCGTTGGGAGTGAACTCAG
GAPDH DQ404538.1 F-CACCTCAAGATCGTCAGCAA 119 81 0.02 97.03±1.32 1.000
R-GCCGAAGTGGTCATGGAT
HPRT1 DQ533610.1 F-GTGGCCCTCTGTGTGCTC 120 81 0.012 98.17±1.44 0.999
R-ACTATTTCTGTTCAGTGCTTTGATGT
LDHB AB477024.1 F-TCGGGGGTTAACCAGTGTT 161 78 0.005 100.49±1.58 0.995 R-AGGGTGTCTGCACTTTTCTTG
PGK1 DQ533611.1 F-CACTGTGGCCTCTGGCATA 108 84 0.015 95.47±0.31 0.999 R-GCAACAGCCTCAGCATACTTC
RPL4 DQ404536.1 F-CAGCGCTGGTCATGTCTAAA 119 108 0.035 96.91±0.98 0.999 R-GCAAAACAGCCTCCTTGGT
RPL8 GQ141092.1 F-CCATGAATCCTGTGGAGCAT 131 65 0.02 101.39±2.47 0.997 R-GGTAGAGGGTTTGCCGATG
RPL18 DQ403041.1 F-GCAAGATCCTCACCTTCGAC 93 104 0.02 96.55±0.39 1.000
R-GAAATGCCTGTACACCTCTCG
RPS9 EU638307.1 F-CTGACGCTGGATGAGAAAGAC 155 77 0.02 98.96±1.39 0.999 R-ACCCCGATACGGACGAGT
RPS18 DQ404537 F-GTACGAGGCCAGCACACC 114 90 0.02 98.46±1.23 0.999
R-TAACAGACAACGCCCACAAA
TFRC DQ533608.1 F-TCCTTTCCGACATATCTTCTGG 106 73 0.02 97.79±2.49 0.996 R-CCGCAGCTTTAAGTGCTCTAGT
YWHAZ DQ404539 F-TCTCTTGCAAAAACGGCATT 135 76 0.003 98.35±0.66 0.992
R-TGCTGTCTTTGTATGACTCTTCACT
Chapman, 2008; Martinez-Levasseur et al., 2013;Müller et al., 2013;Sitt et al., 2008;Sitt et al., 2010;Spinsanti et al., 2006;Spinsanti et al., 2008), the other 2 genes that could participate in other different cell functions were also included (Echigoya et al., 2009;Kullberg et al., 2006). Primers and corresponding UPL probes were designed and chosen using Roche UPL design software (ProbeFinder, v.2.49) based on Primer3 software (Table 2). All designed primer pairs were checked byin silicoPCR algorithm in ProbeFinder, which searches the relevant genome and transcriptome for possible mis-priming sites for either of the PCR primers. Before qPCR experiment, the specificity of primers of 13 candidate genes was confirmed using Fast-Run Hotstart PCR kit (Protech) and electrophoresis.
Quantitative PCR
UPL probe (Roche), 5µl FastStart Essential DNA Probes Master (Roche, Risch-Rotkreuz,
Switzerland) and 1µl of RNase/DNase-free sterile water (ProTech). The thermocycling
conditions were set as follows: polymerase activation at 95 ◦C for 10 min, followed by
45 cycles of denaturation at 95 ◦C for 10 s, and combined primer annealing/elongation at 60 ◦C for 30 s. All reactions including no template control (NTC) and plate control
were carried out in triplicate. The plate control is a well that carries the same reaction components on every plate, and the quantification cycle (Cq) data from the plate control wells was measuring variation. A consistent Cq value of plate control across plates was obtained allowing the data combination from multiple plates into a single study data set. Baseline value was automatically determined for all plates using Eco Software V4.0. Thresholds for each HKG were determined manually (Table 2). The Cq values in triplicate with standard deviation (SD) <0.5 were averaged as raw Cq value. The five-point (10-fold) standard curve of each probe and primer pair was generated from serial dilution of a nucleic acid template. The PCR amplification efficiency (E) andR2of each probe and primer pair were calculated from the slope of a standard curve using the following equation:
E=(10(−1/slope)−1)×100%. The average of at least threeEvalues for each HKG was used
as gene-specificEfor following relative quantity transformation. This study was conducted according to MIQE (Minimum information for publication of quantitative real-time PCR experiments) guidelines (Bustin et al., 2009).
Data analysis
Corrected Cq values (Cq corr) were transformed from raw Cq values using1Cq formula, Cq corr=Cqmin−log2E−1Cq, modified fromFu et al. (2013), where1Cq is the Cq value of
a certain sample minus the Cq value of the sample with the highest expression (lowest Cq, Cqmin) of each HKG as calibrator. Stability of all HKGs were evaluated and ranked using
algorithms geNorm (Vandesompele et al., 2002), NormFinder (Andersen, Jensen & Ørntoft, 2004), comparative 1Ct method (Silver et al., 2006) and Bestkeeper (Pfaffl et al., 2004) based on a web-based analysis tool RefFinder (http://www.leonxie.com/referencegene.php) (Xie et al., 2011). RefFinder calculated the geometric mean based on rankings obtained from each algorithm and provides the final comprehensive ranking. Thirty samples were randomly selected from the 60 samples, and the results of HKG ranking using 30 and 60 samples were analyzed comparatively.
RESULT
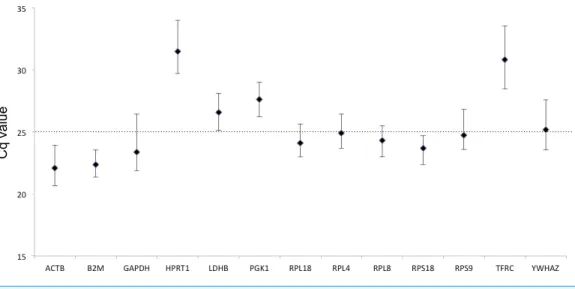
E values of the 13 candidate HKGs were between 95.47% and 101.39% that fit the strict acceptable range of 95%–105%, andR2values were 0.992–1.000 that meet the standard of >0.99 (Table 2). According to the mean Cq value of 60 tested samples, the 13 candidate genes can be divided into two groups: high expression level (Cq < 25) and low expression level (Cq > 25; Fig. 1).ACTB showed the highest expression level (Cq=22.08), while
HPRT1showed the lowest expression level (Cq=31.48). All HKGs exceptTFRCdisplayed
C
q
va
lu
e
Figure 1 Expression levels of candidate HKGs in the tested beluga blood samples (n=60).Values are given as qPCR cycle threshold numbers (Cq values). Dots represent mean Cq values and whiskers the range of Cq values in the 60 samples.
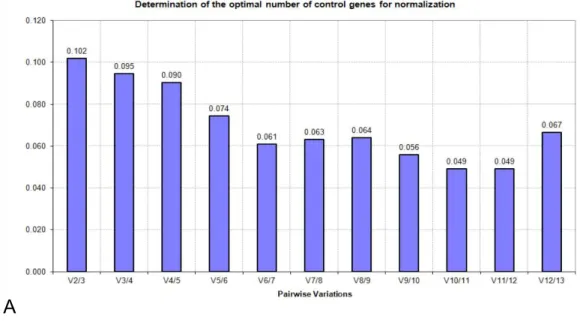
The commonly used reference gene exploring algorithm, geNorm, calculates theM
value for gene expression stability based on the geometric mean; a lowerM value signifies better stability. The gene with highestM value (the least stable gene) is excluded, and the highestM value gene among the rest of the candidates is continuously excluded to obtain a stability ranking order.M values of all the genes were below the default cut-off value (M=1.5), showing good stability for all the genes tested in both 60- and 30-sample groups (Tables 3and4). Another value, pairwise variation V, is used to determine the number of reference genes that are required for data analyses. V2/3 values in the 60 and 30 groups were 0.102 and 0.103 (Fig. 2), respectively, which were below the default cut-off value (0.15). It indicated that using two HKGs as reference genes is enough to obtain reliable normalized results in relative quantification. Based on geNorm analysis,ACTB,RPL4,PGK1, andB2M
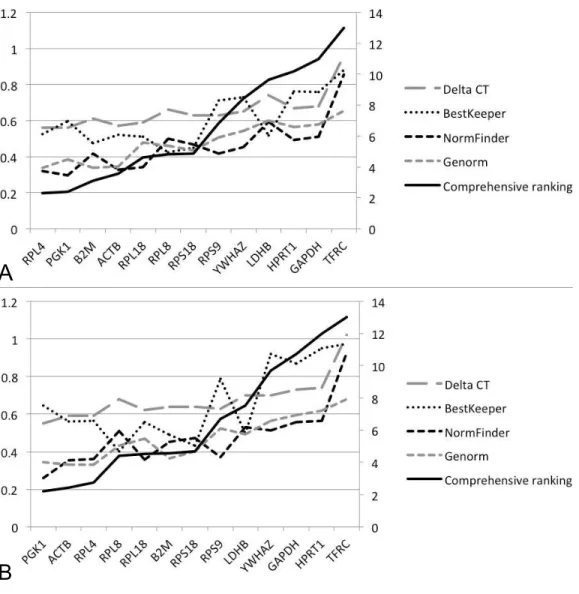
were the most stable HKGs in both the 60 and 30 groups (Fig. 3).
The NormFinder program calculates the stability value based on the analysis of gene expression data and ranks the potential reference genes. Lower values are assigned to the most stable genes. The ranking results of NormFinder were essentially identical in both the 60 and 30 groups showing thatPGK1,ACTB,RPL4, andRPL18were the most stable. The program BestKeeper estimates the expression stability by performing a pairwise correlation analysis of Cq values of each pair of candidate genes. BestKeeper analysis showed that the SDCq value of all HKGs (0.423–0.880) were <1, indicating that these genes were basically
Table 3 Results of stability among 13 candidate genes computed by four algorithms using 60 beluga blood samples.
Comprehensive ranking Delta CT BestKeeper NormFinder geNorm
HKGs Geomean of
ranking value
Rank Average of SD Rank SD Rank Stability value Rank Mvalue Rank
RPL4 2.3 1 0.562 2 0.523 7 0.319 2 0.336 1
PGK1 2.38 2 0.556 1 0.595 8 0.296 1 0.386 4
B2M 3.08 3 0.614 5 0.474 3 0.418 6 0.336 1
ACTB 3.57 4 0.569 3 0.522 6 0.326 3 0.345 3
RPL18 4.6 5 0.587 4 0.509 4 0.34 4 0.478 7
RPL8 4.82 6 0.664 9 0.423 1 0.499 10 0.46 6
RPS18 4.86 7 0.634 7 0.45 2 0.466 8 0.435 5
RPS9 6.82 8 0.629 6 0.712 9 0.416 5 0.507 8
YWHAZ 8.43 9 0.649 8 0.728 10 0.454 7 0.541 9
LDHB 9.64 10 0.74 12 0.519 5 0.594 12 0.6 12
HPRT1 10.19 11 0.674 10 0.761 12 0.493 9 0.564 10
GAPDH 11 12 0.684 11 0.759 11 0.511 11 0.58 11
TFRC 13 13 0.956 13 0.88 13 0.857 13 0.655 13
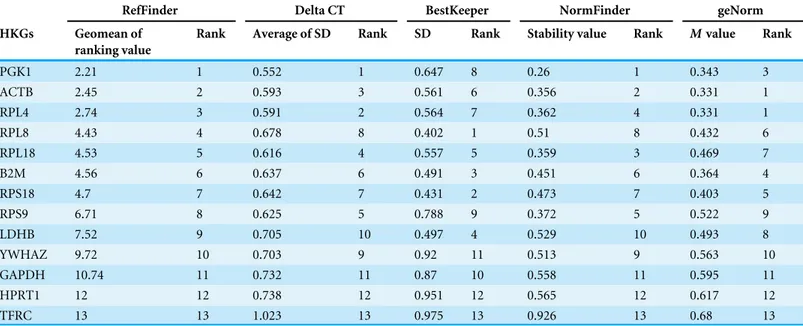
Table 4 Results of stability among 13 candidate genes computed by four algorithms using 30 beluga blood samples.
RefFinder Delta CT BestKeeper NormFinder geNorm
HKGs Geomean of
ranking value
Rank Average of SD Rank SD Rank Stability value Rank Mvalue Rank
PGK1 2.21 1 0.552 1 0.647 8 0.26 1 0.343 3
ACTB 2.45 2 0.593 3 0.561 6 0.356 2 0.331 1
RPL4 2.74 3 0.591 2 0.564 7 0.362 4 0.331 1
RPL8 4.43 4 0.678 8 0.402 1 0.51 8 0.432 6
RPL18 4.53 5 0.616 4 0.557 5 0.359 3 0.469 7
B2M 4.56 6 0.637 6 0.491 3 0.451 6 0.364 4
RPS18 4.7 7 0.642 7 0.431 2 0.473 7 0.403 5
RPS9 6.71 8 0.625 5 0.788 9 0.372 5 0.522 9
LDHB 7.52 9 0.705 10 0.497 4 0.529 10 0.493 8
YWHAZ 9.72 10 0.703 9 0.92 11 0.513 9 0.563 10
GAPDH 10.74 11 0.732 11 0.87 10 0.558 11 0.595 11
HPRT1 12 12 0.738 12 0.951 12 0.565 12 0.617 12
TFRC 13 13 1.023 13 0.975 13 0.926 13 0.68 13
stable HKGs in the 60 group wereRPL4,PGK1,B2M, andACTB, while the most stable HKGs in the 30 group werePGK1,ACTB,RPL4, andRPL8(Fig. 3).
DISCUSSION
A
B
Figure 2 Pairwise variations generated by geNorm algorithm: (A) 60 samples; (B) 30 samples.
A
B
Figure 3 Stability values and ranking orders determined by four algorisms and RefFinder: (A) 60 sam-ples; (B) 30 samples.
could be explained by the distinct principles applied by each of these algorithms. Because these algorithms can demonstrate various rankings of the tested HKGs, in this study RefFinder was used to comprehensively evaluate and rank HKGs based on the rankings from different algorithms.
The four most stable HKGs (RPL4,PGK1,B2M, andACTB) in RefFinder were also in high-ranking orders in NormFinder, geNorm, and comparative1Ct, although the ranking in BestKeeper appeared inconsistent with that in the other three algorithms. The SDCq value
recommended for use in future RT-qPCR studies using beluga blood samples. It has been proposed that the reliability of the normalization factor would increase with the number of stably expressed HKGs included in the calculations (Vandesompele et al., 2002). However, in this study the inclusion of more HKGs further reduced theV values. The V2/3 value indicated that it is not needed to include more than two genes into the normalization factor because this would not dramatically improve normalization. Furthermore, it was suggested that one could preferentially choose to use HKGs that have the same expression levels as the target gene in an experimental application to enhance the uniformity of the analysis (Spinsanti et al., 2006). According to mean Cq values,PGK1was classified in the low expression level group (mean Cq > 25) and the other two genes in the high expression level group (mean Cq < 25). Therefore, it is recommended to use RPL4andPGK1 for low-expression gene studies, such as cytokine expression studies when using beluga blood samples, andRPL4andACTBfor high-expression gene studies.
In previous studies on reference gene selection in cetaceans, 30 skin biopsy samples in striped dolphins (Stenella coeruleoalba) (Spinsanti et al., 2006), 20 skin biopsy samples from seven blue whales (Balaenoptera musculus), seven fin whales (Balaenoptera physalus), and six sperm whales (Physeter macrocephalus) (Martinez-Levasseur et al., 2013), and 75 blood samples in bottlenose dolphins (Tursiops truncatus) (Chen et al., 2015) were used. Some practical points, such as available sample sizes and costs of expression stability experiments, may have an effect on the reference gene selection experiments. There is a unique opportunity in this study to compare the HKG expression stability values of 30- and 60-sample groups. The three most stable HKGs werePGK1,ACTB, andRPL4in RefFinder when only 30 randomly selected beluga blood samples were used. The result is consistent with that using 60 samples, only differing in the ranking order of the most stable genes. These three HKGs were the most stable expression genes in geNorm, NormFinder, and comparative1Ct, and the SDCq value(0.564–0.647) showed that they were also stably
expressed. The result indicated that using only 30 beluga blood samples with various body conditions could select reliable HKGs as reference genes.Chen et al. (2015)showed similar results that using 35 bottlenose dolphin blood samples could perform reference gene selection, andPGK1,HPRT1, andRPL4are superior reference genes.PGK1andRPL4
suitable reference gene when studying beluga blood samples because in this study it was is ranked in the middle using NormFinder and comparative1Ct, and its values in geNorm and BestKeeper were below the default value, indicating basically good expression stability.
We reported the essential background information for the selection of reference genes in RT-qPCR studies of beluga blood samples. A total of 13 candidate HKGs were evaluated, and a suite of best reference genes were recommended to accurately normalize and quantify gene expression in beluga whale blood. To the best of our knowledge, this is the first study to investigate reference gene selection in beluga whales. This investigation is an important basis for future clinical immunology studies in cetaceans.
ACKNOWLEDGEMENTS
We would like to thank all veterinarians, trainers, students and assistants who participated in this project for their help. We thank two anonymous reviewers for their pertinent and helpful comments.
ADDITIONAL INFORMATION AND DECLARATIONS
Funding
The authors received no funding for this work.
Competing Interests
The authors declare there are no competing interests.
Author Contributions
• I-Hua Chen performed the experiments, analyzed the data, wrote the paper, prepared figures and/or tables, reviewed drafts of the paper.
• Jiann-Hsiung Wang and Shih-Jen Chou analyzed the data, contributed reagents/mate-rials/analysis tools, wrote the paper, reviewed drafts of the paper.
• Yeong-Huey Wu performed the experiments, analyzed the data, contributed reagents/materials/analysis tools, wrote the paper, reviewed drafts of the paper. • Tsung-Hsien Li, Ming-Yih Leu and Wen-Been Chang performed the experiments,
analyzed the data, contributed reagents/materials/analysis tools, reviewed drafts of the paper.
• Wei Cheng Yang conceived and designed the experiments, performed the experiments, analyzed the data, wrote the paper, prepared figures and/or tables, reviewed drafts of the paper.
Animal Ethics
The following information was supplied relating to ethical approvals (i.e., approving body and any reference numbers):
Council of Agriculture of Taiwan (Approval number 1020727724).
Data Availability
Supplemental Information
Supplemental information for this article can be found online athttp://dx.doi.org/10.7717/ peerj.1810#supplemental-information.
REFERENCES
Andersen CL, Jensen JL, Ørntoft TF. 2004.Normalization of real-time quantitative reverse transcription-PCR data: a model-based variance estimation approach to identify genes suited for normalization, applied to bladder and colon cancer data sets.Cancer Research64:5245–5250DOI 10.1158/0008-5472.CAN-04-0496.
Beineke A, Siebert U, Müller G, Baumgärtner W. 2007.Increased blood interleukin-10 mRNA levels in diseased free-ranging harbor porpoises (Phocoena phocoena).
Veterinary Immunology and Immunopathology115:100–106
DOI 10.1016/j.vetimm.2006.09.006.
Beineke A, Siebert U, Van Elk N, Baumgartner W. 2004.Development of a lymphocyte-transformation-assay for peripheral blood lymphocytes of the harbor porpoise and detection of cytokines using the reverse-transcription polymerase chain reaction.
Veterinary Immunology and Immunopathology98:59–68
DOI 10.1016/j.vetimm.2003.10.002.
Brinkhof B, Spee B, Rothuizen J, Penning LC. 2006.Development and evaluation of canine reference genes for accurate quantification of gene expression.Analytical
Biochemistry356:36–43DOI 10.1016/j.ab.2006.06.001.
Buckman AH, Veldhoen N, Ellis G, Ford JKB, Helbing CC, Ross PS. 2011. PCB-associated changes in mRNA expression in killer whales (Orcinus orca) from the NE Pacific Ocean.Environmental Science and Technology45:10194–10202
DOI 10.1021/es201541j.
Bustin SA, Benes V, Garson JA, Hellemans J, Huggett J, Kubista M, Mueller R, Nolan T, Pfaffl MW, Shipley GL, Vandesompele J, Wittwer CT. 2009.The MIQE guidelines: minimum information for publication of quantitative real-time PCR experiments.
Clinical Chemistry55:611–622DOI 10.1373/clinchem.2008.112797.
Chen IH, Chou LS, Chou SJ, Wang JH, Stott J, Blanchard M, Jen IF, Yang WC. 2015.
Selection of suitable reference genes for normalization of quantitative RT-PCR in peripheral blood samples of bottlenose dolphins (Tursiops truncatus).Scientific
Reports5:15425 DOI 10.1038/srep15425.
Derveaux S, Vandesompele J, Hellemans J. 2010.How to do successful gene expression analysis using real-time PCR.Methods50:227–230 DOI 10.1016/j.ymeth.2009.11.001.
Dheda K, Huggett JF, Chang JS, Kim LU, Bustin SA, Johnson MA, Rook GA, Zumla A. 2005.The implications of using an inappropriate reference gene for real-time reverse transcription PCR data normalization.Analytical Biochemistry344:141–143 DOI 10.1016/j.ab.2005.05.022.
Fu W, Xie W, Zhang Z, Wang S, Wu Q, Liu Y, Zhou X, Zhou X, Zhang Y. 2013. Explor-ing valid reference genes for quantitative real-time PCR analysis inPlutella xylostella
(Lepidoptera: Plutellidae).International Journal of Biological Sciences9:792–802 DOI 10.7150/ijbs.5862.
He JQ, Sandford AJ, Wang IM, Stepaniants S, Knight DA, Kicic A, Stick SM, Paré PD. 2008.Selection of housekeeping genes for real-time PCR in atopic human bronchial epithelial cells.The European Respiratory Journal32:755–762
DOI 10.1183/09031936.00129107.
Kullberg M, Nilsson MA, Arnason U, Harley EH, Janke A. 2006.Housekeeping genes for phylogenetic analysis of eutherian relationships.Molecular Biology and Evolution
23:1493–1503DOI 10.1093/molbev/msl027.
Mancia A, Warr GW, Chapman RW. 2008.A transcriptomic analysis of the stress induced by capture-release health assessment studies in wild dolphins (Tursiops
truncatus).Molecular Ecology17:2581–2589DOI 10.1111/j.1365-294X.2008.03784.x.
Martinez-Levasseur LM, Gendron D, Knell RJ, Acevedo-Whitehouse K. 2013.Control and target gene selection for studies on UV-induced genotoxicity in whales.BMC
Research Notes6:264DOI 10.1186/1756-0500-6-264.
Müller S, Lehnert K, Seibel H, Driver J, Ronnenberg K, Teilmann J, Van Elk C, Kristensen J, Everaarts E, Siebert U. 2013.Evaluation of immune and stress status in harbour porpoises (Phocoena phocoena): can hormones and mRNA expression levels serve as indicators to assess stress?BMC Veterinary Research9:145 DOI 10.1186/1746-6148-9-145.
Pfaffl MW. 2004. Relative quantification. In: Dorak T, ed.Real-time PCR. San Diego: International University Line, 63–82.
Pfaffl M, Tichopad A, Prgomet C, Neuvians T. 2004.Determination of stable housekeeping genes, differentially regulated target genes and sample integrity: bestKeeper—Excel-based tool using pair-wise correlations.Biotechnology Letters
26:509–515DOI 10.1023/B:BILE.0000019559.84305.47.
Pfister C, Tatabiga MS, Roser F. 2011.Selection of suitable reference genes for quantita-tive real-time polymerase chain reaction in human meningiomas and arachnoidea.
BMC Research Notes4:275–275DOI 10.1186/1756-0500-4-275.
Piek CJ, Brinkhof B, Rothuizen J, Dekker A, Penning LC. 2011.Leukocyte count affects expression of reference genes in canine whole blood samples.BMC Research Notes
4:36–36DOI 10.1186/1756-0500-4-36.
Scharlaken B, De Graaf DC, Goossens K, Peelman LJ, Jacobs FJ. 2008.Reference gene selection for insect expression studies using quantitative real-time PCR: the head of the honeybee,Apis mellifera, after a bacterial challenge.Journal of Insect Science8:33 DOI 10.1673/031.008.3301.
Silver N, Best S, Jiang J, Thein SL. 2006.Selection of housekeeping genes for gene expression studies in human reticulocytes using real-time PCR.BMC Molecular
Biology7:33–33DOI 10.1186/1471-2199-7-33.
erysipelas vaccine.Veterinary Immunology and Immunopathology137:181–189 DOI 10.1016/j.vetimm.2010.05.003.
Sitt T, Bowen L, Blanchard MT, Smith BR, Gershwin LJ, Byrne BA, Stott JL. 2008.
Quantitation of leukocyte gene expression in cetaceans.Developmental and
Com-parative Immunology 32:1253–1259DOI 10.1016/j.dci.2008.05.001.
Spinsanti G, Panti C, Bucalossi D, Marsili L, Casini S, Frati F, Fossi MC. 2008.Selection of reliable reference genes for qRT-PCR studies on cetacean fibroblast cultures exposed to OCs, PBDEs, and 17beta-estradiol.Aquatic Toxicology87:178–186 DOI 10.1016/j.aquatox.2008.01.018.
Spinsanti G, Panti C, Lazzeri E, Marsili L, Casini S, Frati F, Fossi CM. 2006.Selection of reference genes for quantitative RT-PCR studies in striped dolphin (Stenella
coeruleoalba) skin biopsies.BMC Molecular Biology 7:32–32
DOI 10.1186/1471-2199-7-32.
Vandesompele J, De Preter K, Pattyn F, Poppe B, Van Roy N, De Paepe A, Speleman F. 2002.Accurate normalization of real-time quantitative RT-PCR data by geometric averaging of multiple internal control genes.Genome Biology3:RESEARCH0034.
Vorachek W, Bobe G, Hall J. 2013.Reference gene selection for quantitative PCR studies in bovine neutrophils.Advances in Bioscience and Biotechnology 4:6–14 DOI 10.4236/abb.2013.410A3002.
Vorachek WR, Hugejiletu, Bobe G, Hall JA. 2013.Reference gene selection for quanti-tative PCR studies in sheep neutrophils.International Journal of Molecular Sciences
14:11484–11495DOI 10.3390/ijms140611484.