Unstable Expression of Commonly Used
Reference Genes in Rat Pancreatic Islets Early
after Isolation Affects Results of Gene
Expression Studies
Lucie Kosinová1,2
*, Monika Cahová3, Eva Fábryová1, Irena Týcová4, TomášKoblas1,
Ivan Leontovyč1, František Saudek1,5, Jan Kříž5*
1Laboratory of Pancreatic Islets, Center of Experimental Medicine, Institute for Clinical and Experimental Medicine, Prague, Czech Republic,2First Faculty of Medicine, Charles University in Prague, Prague, Czech Republic,3Department of Metabolism and Diabetes, Center of Experimental Medicine, Institute for Clinical and Experimental Medicine, Prague, Czech Republic,4Transplant Laboratory, Center of Experimental Medicine, Institute for Clinical and Experimental Medicine, Prague, Czech Republic,5Department of Diabetes, Center of Diabetes, Institute for Clinical and Experimental Medicine, Prague, Czech Republic
*kosl@ikem.cz(LK);jkri@ikem.cz(JK)
Abstract
The use of RT-qPCR provides a powerful tool for gene expression studies; however, the proper interpretation of the obtained data is crucially dependent on accurate normalization based on stable reference genes. Recently, strong evidence has been shown indicating that the expression of many commonly used reference genes may vary significantly due to diverse experimental conditions. The isolation of pancreatic islets is a complicated proce-dure which creates severe mechanical and metabolic stress leading possibly to cellular damage and alteration of gene expression. Despite of this, freshly isolated islets frequently serve as a control in various gene expression and intervention studies. The aim of our study was to determine expression of 16 candidate reference genes and one gene of interest (F3) in isolated rat pancreatic islets during short-term cultivation in order to find a suitable endog-enous control for gene expression studies. We compared the expression stability of the most commonly used reference genes and evaluated the reliability of relative and absolute quantification using RT-qPCR during 0–120 hrs after isolation. In freshly isolated islets, the expression of all tested genes was markedly depressed and it increased several times throughout the first 48 hrs of cultivation. We observed significant variability among samples at 0 and 24 hrs but substantial stabilization from 48 hrs onwards. During the first 48 hrs, rela-tive quantification failed to reflect the real changes in respecrela-tive mRNA concentrations while in the interval 48–120 hrs, the relative expression generally paralleled the results determined by absolute quantification. Thus, our data call into question the suitability of rela-tive quantification for gene expression analysis in pancreatic islets during the first 48 hrs of cultivation, as the results may be significantly affected by unstable expression of reference genes. However, this method could provide reliable information from 48 hrs onwards. OPEN ACCESS
Citation:Kosinová L, Cahová M, Fábryová E, Týcová I, Koblas T, LeontovyčI, et al. (2016) Unstable Expression of Commonly Used Reference Genes in Rat Pancreatic Islets Early after Isolation Affects Results of Gene Expression Studies. PLoS ONE 11(4): e0152664. doi:10.1371/journal. pone.0152664
Editor:Amar Abderrahmani, Communauté d'Universités et dÉtablissements Lille Nord de France, FRANCE
Received:November 8, 2015
Accepted:March 17, 2016
Published:April 1, 2016
Copyright:© 2016 Kosinová et al. This is an open access article distributed under the terms of the
Creative Commons Attribution License, which permits unrestricted use, distribution, and reproduction in any medium, provided the original author and source are credited.
Data Availability Statement:All relevant data are within the paper and its Supporting Information files.
Introduction
Pancreatic islet transplantation into the portal vein of diabetic recipients represents a promis-ing therapeutic alternative for the treatment of insulin-dependent diabetes mellitus since its re-launch by the Edmonton group in the year 2000 [1]. Despite the method has been considerably improved, its overall efficiency still needs to be enhanced. One of the possible approaches is to support islet viability during the isolation procedure and over subsequent steps by short-term silencing of specific genes, i.e. genes involved in apoptotic pathways, in coagulation, etc. This process requires manipulation andin vitrocultivation of isolated islets for several hours or days, whereby the precise quantification of target gene expression during all phases of islet iso-lation, preservation, and transplantation is the ultimate condition of success.
Quantitative real-time reverse transcription polymerase chain reaction (RT-qPCR) is a well-established method for quantifying mRNA in biological samples. Its benefits include high sen-sitivity, a large dynamic range, and the potential for high-throughput and accurate expression profiling of selected genes. Despite being a powerful technique, RT-qPCR is an indirect method prone to errors that are easily introduced through a number of steps during the experiment (sample handling, amount of starting material, RNA extraction, nucleic acid quality, enzymatic efficiencies, primer quality and characteristics), thereby increasing the risk of misinterpreting results [2,3]. Therefore, reliable normalization is required for the accurate determination of gene expression level with minimal experimental error. The most common method for nor-malizing cellular mRNA data is the use of reference genes (RGs) as internal controls; however, it is essential that the expression of selected gene(s) is stable and not affected by the experimen-tal conditions [2–5]. Furthermore, an adequate control sample is necessary to estimate any changes or shifts in gene expression related to experimental interventions.
Isolation of pancreatic islets from exocrine tissue is complicated procedure which is critical for the survival of endocrine cells. Nevertheless, this process also exerts severe mechanical and metabolic stress on the islets and can lead to cellular damage and alteration of gene expression. In line with this, Marselli et al. [6] report in their study that immediately after isolation, 4560 genes were up-regulated and 1226 genes down-regulated in isolated islets compared with data obtained by microdissection from intact pancreatic tissue. Negi et al. [7] report that in freshly isolated islets, genes involved in mRNA catabolism are highly (21.9-fold) up-regulated, while genes associated with transcription are down-regulated (2.5-fold). Despite of this, both freshly isolated rodent and human islets frequently serve as controls in various gene expression and intervention studies, irrespective of the possible changes in gene expression due to the isolation stress [8–11].
Some conventional RGs, such as 18S rRNA, GAPDH, andβ-actin, are classically considered as constitutively expressed in different tissues and often automatically used as normalizers because of their robust expression. However, there is a growing body of evidence showing that expression levels of these“classic”RGs can vary extensively due to diverse experimental condi-tions [3–5], thus making their routine use as internal controls inadequate for precise quantita-tive normalization because of the large measurement error [3–5,12,13], particularly in
pancreatic islets [11,14]. Thus, appropriate validation step is a crucial requirement for avoiding misinterpretations of study findings, since the RGs selection appears to be highly specific for a particular experimental model [2].
To our best knowledge, no complex comparison study of frequently used RGs is available for islet grafts as well as evaluation of RG expression stability in the early period after isolation. Hence, we determined gene expression of the 16 most commonly used RGs (18S rRNA, Actb, Arbp, B2m, Gapdh, Gusb, Hmbs, Hprt, Pgk1, Ppia, Ppib, Rplp2, Tbp, Tfrc, Ubc, and Ywhaz) [15,16] and one gene of interest (tissue factor, F3) in freshly isolated rat pancreatic islets and
Experimental Medicine–IKEM, IN 00023001),http://
www.mzcr.cz/. The funders had no role in study design, data collection and analysis, decision to publish, or preparation of the manuscript.
after 24, 48, 72, 96 and 120 hrs of cultivation, in order to compare gene expression stability and to identify reliable RGs suitable for gene expression quantification.
Methods
Isolation and cultivation of rat pancreatic islets
All experiments were performed on Brown Norway rats (male, ~300 g) purchased from Charles River Laboratories, Germany, and were approved by The Animal Care Committee of the Institute for Clinical and Experimental Medicine and Ministry of Health of Czech Republic (Permit Number: 34/2012; 83/2013). Animals were held according to the European Conven-tion on Animal Care in convenConven-tional breeding facility with 12/12 hrs light/dark cycle and free access to food pellets and water. A total of 38 rats were used in this study. Pancreatic islets were isolated using collagenase digestion followed by separation in a discontinuous density gradient, as previously described [17]. Briefly, pancreata of deeply anesthetized rats (Narketan/Dexdo-mitor 4:1, 0.065 ml/100 g b. wt.) were cannulated through the bile duct and filled with 15 ml of collagenase solution (Sevapharma, 1 mg/ml). After excision of pancreas, animals were sacri-ficed by exsanguinations. Excised pancreata were incubated for 18 min at 37°C with moderate shaking. Collagenase digestion was stopped by several cold Hank’s Balanced Salt Solution (sup-plemented with 1% FBS) washing steps and the tissue suspension was filtered through a 500μm mesh. Pancreatic islets were separated using Ficoll (Sigma Aldrich) discontinuous
den-sity gradient (1.108 g/ml, 1.096 g/ml, 1.069 g/ml, 1.037 g/ml) yielding in 600–700 purified islets per rat. Isolated islets were harvested immediately after isolation or cultivated in CMRL-based culture medium supplemented with 10% FBS, 10 mM HEPES, 2 mM Glutamax, 100 U/ml Pen-icillin, and 100μg/ml Streptomycin. Islets were harvested after 24, 48, 72, 96 and 120 hrs of
cul-tivation and also in the period 0–24 hrs every 3 hrs. Samples of hand-picked islets free of exocrine tissue were frozen in liquid nitrogen and stored at -80°C until the RNA isolation. Pooled samples including islets of all sizes were used, i.e. islets with more than 150 um in diam-eter were not excluded from the study. The representative sample of isolated islets is shown on
S1 Fig. Viability of isolated pancreatic islets was assessed using propidium iodide/acridine orange staining and ranged from 85 to 95% throughout the whole experiment. The insulin con-tent in different time points of cultivation was proved by dithizone staining.
Glucose-stimulated insulin secretion (GSIS) test
The ability of stimulated insulin secretion of freshly isolated islets and after 6, 24, 48, 72, 96 and 120 hrs of cultivation was determined using glucose-stimulated insulin secretion test. Prior the assay, islets (20 islets per well) were placed on polyester membranes with 8μm
pores (Transwell cell culture inserts, Corning) in six well plate with culture media. The GSIS assay medium consisted of Krebs-Ringer bicarbonate buffers equilibrated with 5% CO2at
37°C, and supplemented with either 3 mM (low) or 22 mM (high) glucose. All incubations were carried on at 37°C and 5% CO2, in the volume of 4 ml. Islets were equilibrated for 15
RNA isolation and reverse transcription
RNA was isolated using RNeasy Plus Mini Kit (Qiagen) including a column for elimination of genomic DNA. RNA concentration was determined using Qubit RNA HS Assay Kit (Life Technologies). RNA purity was assessed using NanoDrop 2000 UV-Vis Spectrophotometer as the 260 nm/280 nm absorbance ratio. In order to prove the RNA quality, the RNA Integrity Number (RIN) was measured in a separate experiment using Agilent RNA 600 Nano Kit (Agi-lent Technologies). Based on electrophoretic separation, this method provides sizing, quantifi-cation and quality control of RNA. Also, the average RNA yield for one islet was calculated in different time points of cultivation. The fixed amount of RNA (250 ng) was reversely tran-scribed to cDNA with High-Capacity RNA-to-cDNA Kit (Life Technologies) according to manufacturer´s instructions and stored at -20°C until the gene expression analysis.
RT-qPCR
In the first experiment, the expression of 16 candidate RGs (18S rRNA, Actb, Arbp, B2m, Gapdh, Gusb, Hmbs, Hprt, Pgk1, Ppia, Ppib, Rplp2, Tbp, Tfrc, Ubc, Ywhaz) normalized to the same RNA input was determined using TaqMan1Rat Endogenous Control Array 384-well micro fluidic cards on AbiPrism 7900 (Life Technologies). Full names, IDs, function and loca-tion of all genes can be found inS1 Table. In the second experiment, absolute quantification of Gapdh, Ppia, and F3 was performed. Specific primers for these genes (F3:50-GATAAAGACAG TGACCAGGAACA-30,50-CTAACCACAAGAGCCCAGAA-30; Gapdh:50-GTAACCAGGCGTC
CGATAC-30,50-TCTCTGCTCCTCCCTGTTC-30; Ppia50-CCATTATGGCGTGTGAAGTC-30,
50-GCAGACAAAGTTCCAAAGACAG-30) (IDT) were used to amplify the defined segment of the respective mRNA. Amplified segments were separated on 2% agarose gel and purified with QIAquick Gel Extraction Kit (Qiagen). DNA concentration was determined using Qubit DNA Assay Kit (Life Technologies). Purified fragments were used to construct the calibration curves. As a template for segment amplification, total RNA isolated from islets after 72 hrs of cultiva-tion was used. Absolute quantificacultiva-tion of F3, Gapdh and Ppia gene expression was performed on ViiA™7 Real-Time PCR System (Applied Biosystems) using PrimeTime1qPCR probe-based gene expression assays (IDT).
Data analysis and statistics
Gene expression data were analyzed using RQ Manager and ViiA™software. Absolute cDNA quantity was calculated from the appropriate calibration curve. The stability of individual RGs was evaluated using GeNorm software, a Microsoft Excel program available athttps://genorm. cmgg.be/. Friedman’s Two Way ANOVA and multiple comparison method were used to ana-lyze the differences between gene expression at different time points (0, 24, 48, 72, 96 and 120 hrs) of cultivation. Differences were considered statistically significant at the level of p<0.05.
Results
Analysis of RNA quality
quantification of individual electropherogram band densities is shown inS2 Fig. The 28S:18S rRNA ratio, another parameter reflecting RNA integrity, increased from 1.0 at time 0 hrs to 1.9 at 96 hrs and stabilized at 1.8 at 120 hrs of cultivation. We found the highest RNA yield per islet immediately after isolation (T = 0 hrs) followed by significant drop during next 24 hrs and con-sequent elevation up to 72 hrs of cultivation (Fig 1B).
Metabolic characterization of islets
The metabolic state of isolated islets in various time points of cultivation was evaluated accord-ing to their capacity to respond to glucose stimulationin vitro(Fig 2) and by the verification of insulin presence by dithizone staining (Fig 3). The ability of the isolated islets to increase insu-lin secretion after glucose challenge did not significantly change throughout the 120 hrs culti-vation period. The stimulatory index (ratio of insulin secretion in basal and stimulated conditions) was highest at 6 hrs (16±2.5) and 24 hrs after isolation (19±5.3). Nevertheless,
Fig 1. RNA integrity and quantity.A: Electropherograms of RNA isolated from islets at different time of cultivation. RIN = RNA integrity number. B: RNA quantity per one islet and 28S:18S rRNA ratio in the same RNA samples.
from the absolute values (Fig 2) it is clear, that this value reflects rather low basal than elevated glucose-stimulated insulin secretion. Since 48 hrs of cultivation onwards the stimulation index was quite stable (6.1±2.0). The well-preserved metabolic flexibility of cultivated islets is demon-strated by their ability to decrease insulin secretion when transferred back to low glucose
Fig 2. Effect of the length of cultivation on glucose-stimulated insulin secretion (GSIS) of pancreatic isletsin vitro.Glucose-stimulated insulin secretion was tested at three subsequent concentrations of glucose (3 mM, 22 mM, and 3 mM again). Data are given as a mean±SD, n = 3.
doi:10.1371/journal.pone.0152664.g002
Fig 3. Dithizone staining of islets cultivated for different time periods.Magnification 15×.
medium. During the cultivation, we did not observe any attenuation of dithizone staining intensity what confirmed that insulin production was not compromised.
Expression profiling of candidate reference genes
The first requirement for RG is its stable expression. To examine the impact of the isolation procedure and subsequent cultivation on the candidate RGs, their expression was measured in freshly isolated islets (0 hrs) or islets cultivatedin vitrofor 24, 48, 72, 96 and 120 hrs. As shown inFig 4, none of the genes tested in our study met the stability requirements over the whole tivation period. In all cases, the specific mRNA level increased rapidly in the first 48 hrs of cul-tivation whereat it stabilized. During first 72 hrs of culcul-tivation, it increased 15 times on average (from 5.8-fold for 18S rRNA to 43.1-fold for Pgk1) while about 90% of the increase occurred during the first 48 hrs of cultivation. In contrast, from 72 to 120 hrs of cultivation, the specific mRNA level remained relatively stable with fold change of about 1.5 on average. The only sig-nificant changes in the interval 48–120 hrs were found in the expression of 18S rRNA and Arbp gene. Furthermore, variability which was very high among samples at 0 and 24 hrs decreased significantly after 48 hrs of cultivation.
In order to learn more about the course of events during the early phase of cultivation (0–24 hrs), we determined the RGs’expression every 3 hrs (Fig 5). For all genes, the expression pat-tern shared some common features. In general, the highest expression rate was observed at 3 hrs after isolation. Then the expression rate decreased and was relatively stable between 6 and 15 hrs after isolation. The time interval from 18 to 24 hrs was characterized by significant vari-ability both among genes and individual time points.
The changing expression of RGs throughout the cultivation period may not necessarily dis-qualify them as normalizers for relative quantification at specific time point of cultivation, pro-vided thatΔCt(GOI-RG)is nearly constant for one time point and one particular gene of interest
(GOI)/RG combination. In order to test this presumption, we calculatedΔCt(GOI-RG)for
differ-ent time points of cultivation for all candidate RGs and F3 (GOI) mRNA (Fig 6). At the time after isolation and after the first 24 hrs of cultivation,ΔCt(GOI-RG)was highly variable and the
coefficient of variation (CV) oscillated in hundreds of percent for all genes. In contrast, from 48 hrs onwards, expression of both GOI and RGs stabilized andΔCt(GOI-RG)remained constant
with CV not exceeding units of percent. Taken together, these data indicate that gene expres-sion is significantly disturbed by the isolation procedure, at least at transcription level, and its stabilization occurs only after 48 hrs of cultivation.
Stability of reference genes with respect to individual stages of
pancreatic islets cultivation
Fig 4. Expression of candidate reference genes during cultivation.Ct of individual candidate genes are shown as medians (lines), 25th percentile to the 75th percentile (boxes) and as ranges (whiskers) immediately after isolation and at 24, 48, 72, 96 and 120 hrs of cultivation. Data are based on at least 6 independent experiments. Statistical significance of the differences in Ct values was evaluated using Freidman’s Two Way ANOVA and multiple comparison method;*p<0.05 48 vs. 0 hrs;#p<0.05 72 vs. 0 hrs;†p<0.05 96 vs. 0 hrs;‡p<0.05 120 vs. 0 hrs;ap<0.05 96 vs. 48 hrs;bp<0.05 120 vs. 48 hrs.
Fig 5. Expression of candidate reference genes during the first 24 hours of cultivation.Ct of individual genes are shown as mean±S.D., n = 6. Data are based on two independent experiments.
Another approach has been published by Gorzelniak et al. [19]. According to their guide-line, the expression of proper RG should not differ by more than half of the cycle (ΔCt0.5) between control and experimental samples. Employing this criterion, we evaluated the suitabil-ity of all 16 candidate RGs. In order to make the statistical evaluation possible, we converted
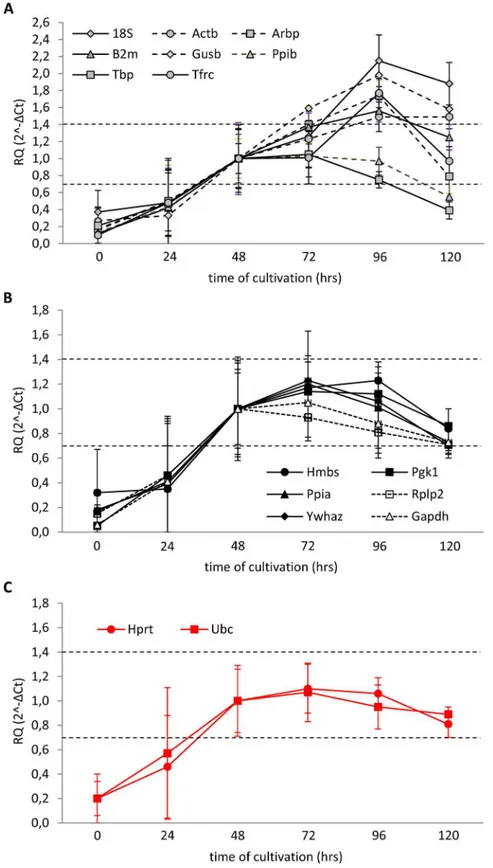
ΔCt data to“fold changes”using the 2-ΔCtmethod. In this case,ΔCt of +0.5 and -0.5 are equiva-lent to 0.7 and 1.4-fold changes in relative gene expression, respectively [20]. Because gene expression in our experiment seemed to stabilize at 48 hrs, we chose average expression of the respective candidate RGs at 48 hrs as a calibrator. None of the tested genes met the ±0.5ΔCt rule in freshly isolated islets or at 24 hrs after isolation (Fig 8A, 8B and 8C). When considering only the period from 48 to 120 hrs of cultivation, eight of the genes (18S, Actb, Arbp, B2m, Gusb, Ppib, Tbp, Tfrc) (Fig 8A) were out of the limit in at least one of cultivation times evalu-ated. The average expression of six genes (Gapdh, Hmbs, Pgk1, Ppia, Rplp2, Ywhaz) met the ±0.5ΔCt rule during the interval 48–120 hrs but due to the variance their expression in some individual samples exceeded 0.7 or 1.4-fold change borders (Fig 8B). The only two genes that absolutely complied with the ±0.5ΔCt rule were Hprt and Ubc (Fig 8C).
Comparison of relative vs. absolute quantification of gene expression in
isolated pancreatic islets
In order to test the plausibility of relative quantification of gene expression at different time points during pancreatic islet cultivation, we employed the 2-ΔΔCtmethod when the expression
at 48 hrs was set as calibrator and calculated the expression of three genes appointed as“GOIs” using three RG combination: 1) most stable pair identified by GeNorm at 24 hrs; 2) most stable pair identified by GeNorm over the whole cultivation period (0–120 hrs) and 3) RG pair identi-fied by the ±0.5ΔCt rule. We compared these results with data obtained by the absolute quanti-fication method which determined the respective mRNA concentration using a calibration curve constructed for the specific transcript (Fig 9A, 9B and 9C). We chose the following genes of interest: Gapdh, one of the most widely used RGs; Ppia, identified as one of the most stable genes in our experimental setting; and F3 (tissue factor), which is referred to increase its expression during thein vitrocultivation [21].
Fig 6. Coefficient of variation (%)ΔCt(GOI-RG)at different time points of cultivation.Data are based on at least 6 independent experiments.
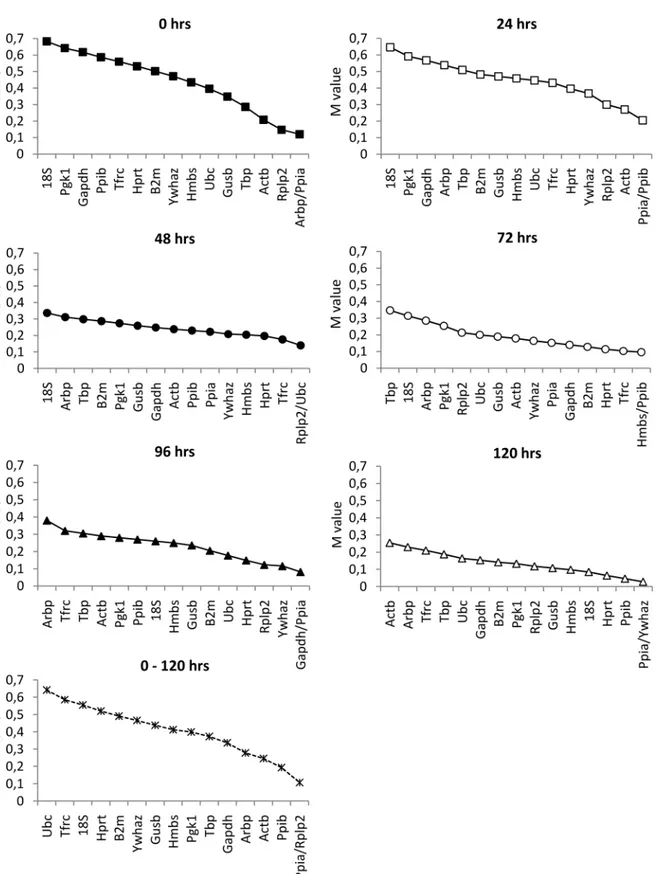
Fig 7. Expression stability values of candidate RGs at different phases of cultivation determined by GeNorm.TheMvalue represents an average stability measure of each possible combination of a particular RG with all other genes in the multiplex. The lower theMvalue of a given gene, the more consistent its expression relative to other genes in the multiplex.
Fig 8. Expression stability of candidate RGs at different phases of cultivation evaluated according to the±0.5ΔCt rule.Data are expressed as means±SD, n = 6. Dashed lines indicate the interval of
0.7-1.4-fold change compared with the expression at 48 hrs.
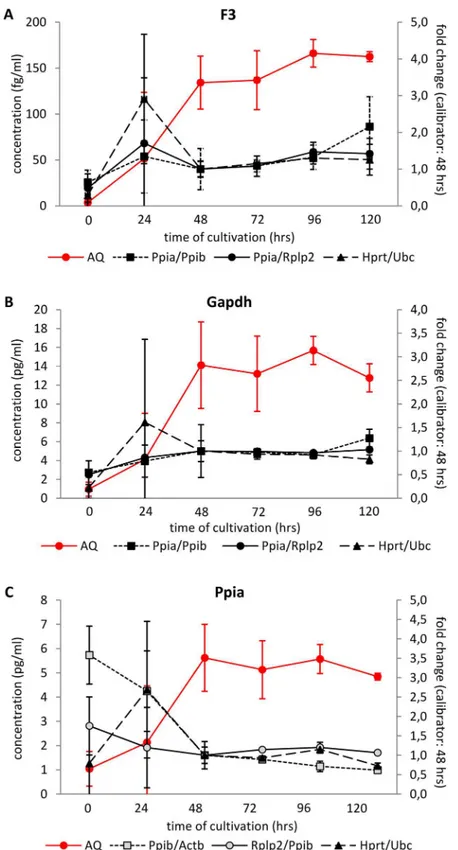
Fig 9. Relative and absolute quantification of F3, Gapdh and Ppia in isolated pancreatic islets during in vitrocultivation.Relative quantification was calculated using the 2-ΔΔCtmethod related to time 48 hrs;
absolute expression was determined using a calibration curve constructed for each specific transcript. RG pairs were chosen either by GeNorm, calculated for expression at 24 hrs only (Ppia/Ppib), or for the whole interval 0–120 hrs (Rplp2/Ppia) or by the±0.5ΔCt rule (Hprt/Ubc). When Ppia was evaluated as GOI, we used the next most stable reference gene identified by GeNorm (24 hrs: Ppib/Actb; 0–120 hrs: Rplp2/Ppib).
According to the absolute quantification method, we observed a similar pattern of expres-sion for all three GOIs—their expression was very low at the time of isolation and then increased up to 48 hrs of cultivation after which it remained relatively stable. In contrast to this, the results of relative quantification failed to reflect the changes in respective mRNA con-centrations determined using the absolute quantification method during the first 48 hrs for all three GOIs irrespective to the RG pair chosen. In the interval 48–120 hrs, the expression of GOIs determined by relative expression generally paralleled their expression assessed by abso-lute quantification. Both methods identified enormous variance at 24 hrs of cultivation.
These data confirm our presumption that due to the unstable expression of most of the genes during the initial phase ofin vitrocultivation, relative quantification of mRNA expres-sion is not a suitable method as it does not reflect the real mRNA concentrations during the first 48 hrs of cultivation.
Discussion
Our study focused on the identification and validation of a suitable set of RGs for use in gene expression normalization during short-term cultivation of isolated rat pancreatic islets. We found that none of the 16 candidate RGs met the stability criteria (ΔCt±0.5) throughout the whole 120 hrs cultivation period. Our main findings can be summarized as follows: first, imme-diately after isolation, the specific mRNAs content was many times lower in comparison with all subsequent phases of cultivation and RNA exhibited considerable degradation; second, dur-ing the recovery phase which lasted for subsequent 48 hrs, transcription of all tested genes increased but it was extremely variable among samples which were supposed to be homoge-nous; third, from 48 hrs of cultivation onwards, RNA integrity increased and expression levels of all tested genes stabilized with minimal variability among samples; finally, none of the candi-date RGs met the acceptable fluctuation criteria (ΔCt±0.5) during the first 48 hrs of cultiva-tion. Taken together, our data suggest that normalization during the first stages of pancreatic islet cultivation is problematic and raise questions as to the suitability of gene expression stud-ies and particularly of the relative quantification method under these conditions.
RT-qPCR is a widely-used method for quantitative determination of gene expression in bio-logical samples; however, it is also quite prone to a number of imprecision and technical errors. These problems could be overcome by normalization, i.e. including an invariant endogenous control in the assay to correct both sample-to-sample variations in RT-qPCR efficiency and errors in sample quantification. However, it is essential that expression of the selected endoge-nous control (i.e. RG) is stable and not affected by the experimental conditions used in the study under investigation [1,4].
In our experiment, we found that immediately after pancreatic islet isolation, expression of all tested candidate RGs was significantly down-regulated when compared to that at 48 hrs of cultivation (5- to 40-fold, 13,5-fold in average). This is probably due to the ischemic, mechani-cal, osmotic, and oxidative stress to which pancreatic islets are exposed during the isolation procedure [22]. As previously published, during the process of isolation, islet cells undergo pro-found changes in structure and function resulting in beta-cell apoptosis [23], whether as a con-sequence of hypoxia, disruption of the native islet cell microenvironment or lack of growth factors [23–27]. Furthermore, the isolation procedure potently recruits some of stress signaling pathways; however, culturing of islets for 48 hrs after isolation allows for activated pathways to return to background levels [28].
(Fig 1AandS2 Fig), RNA obtained from freshly isolated islets and from islets cultivated for 24 hrs exhibits partial fragmentation (RIN 6.5±0.26 and 7.4±0.12, respectively) while the RNA from islets cultivated for 48 hrs or more is nearly intact (RIN9.4). 28S:18S rRNA ratio, another parameter reflecting the degree of RNA degradation, was low in freshly isolated islets (1.0) but then rose up and got stabilized (1.9 and 1.8) after 96 and 120 hrs of cultivation, respec-tively. Finally, the amount of RNA obtained from one islet was highest in freshly isolated islets, then it dropped rapidly, reached the minimal value after 24 hrs and then increased slowly again (Fig 1B). All these observations could be explained by launching of degradation processes through the stress to which islets are exposed during the isolation procedure [28]. These mech-anisms probably lead to general destruction of RNA resulting in rapid decrease in RNA content during the first 24 hrs after isolation. In tissue culture, as the degradation and stress signaling pathways are not stimulated anymore [28], the RNA content start to rise and the islet condition improves. After 48 hrs of cultivation, there is no evidence of RNA degradation (Fig 1). Never-theless, the initial RNA content per one islet is not reached again, probably due to natural cell death, eventually also due to central necrosis of some islets during cultivation. For these rea-sons, along with the time of cultivation, the number of islet cells naturally decreases which means that the RNA content per one islet drops as well. Interestingly, the main metabolic func-tion of the islets, the ability to respond to glucose stimulafunc-tion by the increased insulin secrefunc-tion, was not compromised at any time point of cultivation. The intactness and the presence of insu-lin in the islets throughout the cultivation were evidenced by dithizone staining. Taken together, our data indicate that isolation stress affects particularly the RNA stability and/or synthesis while the main metabolic characteristics are unaffected.
According to our observations, during the first 48 hrs of cultivation, significant fluctuations in gene expression occurred, while from 48 hrs onwards, substantial stabilization took place. Particularly, 24 hrs after islet isolation, gene expression of all tested genes was extremely vari-able among the samples which were supposed to be homogenous. Also in the time period 0–24 hrs, the expression of all genes varied significantly both among times and genes. In contrast, after 48 hrs of cultivation, Ct values stabilized with minimal variability among samples, for most of the genes. This observation questions the biological relevance of gene expression stud-ies during the early phase (0–48 hrs) of islet cultivationin vitro.
Several approaches have been developed for selection of a suitable internal control. The “empirical”approach is based on selecting genes with robust expression, i.e. Gapdh, B2m, or 18S rRNA, which have been successfully used in non- or semiquantitative methods, such as Northern blot where qualitative changes are measured [29]. Even though there is a wealth of evidence indicating that these genes are significantly affected by different conditions [2,7–
12,30], they are still frequently used in gene expression studies carried out on isolated pancre-atic islets [12,31]. In our experiment, some of these genes (e.g. 18S rRNA) were found to be quite unstable (Figs4,7and8).
Another approach is based on the precise evaluation of RG stability under particular experi-mental conditions. According to Gorzelniak [19], differences inΔCTbetween“experimental”
and“control”sample for particular RG<0.5 are caused by technical variance of the method
and are likely to be reflected by the gene of interest and RG in the same manner. In contrast,
ΔCTvalues>1.0 reflect changes in gene expression levels and indicate that candidate RG
down from 72 hrs onwards, the variability of expression among samples in one group decreased significantly (Figs4and6).
The GeNorm method [18] was developed for determination of gene expression stability on the basis of non-normalized expression levels. The GeNorm algorithm allows gene-stability measureMto be calculated as the average pairwise variation (V) between the particular gene and all other candidate RGs. In contradiction to our findings, all calculatedMvalues provided by GeNorm lay well below the arbitrarily suggested cut-off value (M= 1.5; with a lower value indicating increased gene stability), which means that all combinations of two tested genes should be stable enough to be used as internal controls. Nevertheless, as shown in Figs4and8, expression of all candidate RGs significantly increased during the first 48 hrs of cultivation. This discrepancy could be explained by the mechanism used for GeNorm calculation, which evaluates the stability of each combination of two genes remaining in a multiplex after one-by-one exclusion according to a descendingMvalue until only two genes with the most stable expression ratio remain. Due to the GeNorm’s pairwise comparison these cannot be further differentiated. Because the expression of all genes during the 48 hrs after isolation followed a similar pattern, the ratio between every two compared genes appeared to be stable. This may also explain why there was no need to include more than two RGs according to GeNorm’s pair-wise variation analysis, since the calculatedVvalue fell well below the recommended cut-off value of 0.15 (data not shown).
Finally, the limited suitability of relative quantification in isolated pancreatic islets during the first 48 hrs of cultivation is illustrated if we compare the results of relative and absolute quantification of the three genes: F3, Gapdh, and Ppia (Fig 9). F3 gene encodes the protein of tissue factor which plays a key role in tissue engraftment when performing pancreatic islet transplantation. Tissue factor triggers the Instant Blood Mediated Inflammatory Reaction (known as IBMIR) immediately after pancreatic islet infusion into the portal vein blood, thus influencing the ratio of destroyed/engrafted islets. The increasing expression of F3 gene during tissue culture preservation of islets before transplantation was repeatedly reported. Gapdh gene was chosen as one of the most "popular" housekeeping genes used as normalizers in gene expression analysis. Ppia gene was selected as it seems to be one of the most stable genes in our experimental setting (Fig 7). Absolute quantification showed a similar expression pattern for all three genes. The gene copy number per sample was very low immediately after isolation, then increased over the next 48 hrs and remained relatively stable between 48 hrs and 120 hrs. In contrast to this, the results of relative quantification failed to reflect the changes in respective mRNA concentrations determined using the absolute quantification method during the first 48 hrs for all three GOIs irrespective to the RG pair chosen. In the interval 48–120 hrs, the expres-sion of GOIs determined by relative quantification generally paralleled the expresexpres-sion assessed by absolute quantification. Better results were obtained when using RG pairs identified accord-ing to their expression duraccord-ing the whole cultivation period both by GeNorm or ±0.5ΔCt rule than by RG pair chosen according to the expression at one particular time point, i.e. at 24 hrs.
isolated pancreatic islets. Our findings highlight the importance of RG validation step for every particular experimental setting.
Supporting Information
S1 Fig. Representative samples of dithizone stained islets at 0, 24, and 48 hrs after isolation.
Magnification 15×. (PDF)
S2 Fig. Electropherograms of RNA samples isolated from islets at different time points of cultivation.
(PDF)
S1 Table. Official symbol, ID, full name, function and location of 16 candidate reference genes and the F3 gene.Available athttp://www.ncbi.nlm.nih.gov/gene/.
(PDF)
Author Contributions
Conceived and designed the experiments: LK MC JK. Performed the experiments: LK EF IL TK. Analyzed the data: LK MC IT. Contributed reagents/materials/analysis tools: LK JK FS. Wrote the paper: LK MC JK FS.
References
1. Shapiro J, Lakey JRT, Ryan EA, Korbutt GS, Toth E, Warnock GL, et al. Islet Transplantation in Seven Patients with Type 1 Diabetes Mellitus Using a Glucocorticoid-Free Immunosuppressive Regimen. N Engl J Med. 2000; 343: 230–238. PMID:10911004
2. Dheda K, Huggett JF, Bustin SA, Johnson MA, Rook G, Zumla A. Validation of housekeeping genes for normalizing RNA expression in real-time PCR. BioTechniques. 2004; 37: 112–119. PMID:15283208 3. Dheda K, Huggett JF, Chang JS, Kima LU, Bustin SA, Johnson MA, et al. The implications of using an
inappropriate reference gene for real-time reverse transcription PCR data normalization. Anal Biochem. 2005; 344: 141–143. PMID:16054107
4. Karge WH, Schaefer EJ, Ordovas JM. Quantification of mRNA by polymerase chain reaction (PCR) using an internal standard and a nonradioactive detection method. Methods Mol Biol. 1998; 110: 43– 61. PMID:9918038
5. Thellin O, Zorzi W, Lakaye B, De Borman B, Coumans B, Hennen G, et al. Housekeeping genes as internal standards: use and limits. J Biotechnol. 1999; 75(2–3): 291–5. PMID:10617337
6. Marselli L, Thorne J, Ahn Y, Omer A, Sgroi DC, Libermann T, et al. Gene Expression of Purifiedβ-Cell Tissue Obtained from Human Pancreas with Laser Capture Microdissection. J Clin Endocrinol Metab. 2008; 93(3): 1046–1053. PMID:18073315
7. Negi S, Jetha A, Aikin R, Hasilo C, Sladek R, Paraskevas S. Analysis of Beta-Cell Gene Expression Reveals Inflammatory Signaling and Evidence of Dedifferentiation following Human Islet Isolation and Culture. PLoS One. 2012; 7(1): e30415. doi:10.1371/journal.pone.0030415PMID:22299040 8. Quan W, Hur KY, Lim Y, Oh SH, Lee JC, Kim KH, et al. Autophagy deficiency in beta cells leads to
com-promised unfolded protein response and progression from obesity to diabetes in mice. Diabetologia. 2012; 55: 392–403. doi:10.1007/s00125-011-2350-yPMID:22075916
9. Tang C, Koulajian K, Schuiki I, Zhang L, Desai T, Ivovic A, et al. Glucose-induced beta cell dysfunction in vivo in rats: link between oxidative stress and endoplasmic reticulum stress. Diabetologia. 2012; 55 (5): 1366–79. doi:10.1007/s00125-012-2474-8PMID:22396011
10. Planas R, Carrillo J, Sanchez A, Ruiz de Villa MC, Nuñez F, Verdaguer J, et al. Gene expression pro-files for the human pancreas and purified islets in Type 1 diabetes: new findings at clinical onset and in long-standing diabetes. Clin Exp Immunol. 2010; 159(1): 23–44. doi:10.1111/j.1365-2249.2009. 04053.xPMID:19912253
12. Bas A, Forsberg G, Hammarström S, Hammarström ML. Utility of the Housekeeping Genes 18S rRNA,
β-Actin and Glyceraldehyde-3-Phosphate-Dehydrogenase for Normalization in Real-Time Quantitative Reverse Transcriptase-Polymerase Chain Reaction Analysis of Gene Expression in Human T Lympho-cytes. Scand J Immunol. 2004; 59(6): 566–573 PMID:15182252
13. Tricarico C, Pinzani P, Bianchi S, Paglierani M, Distante V, Pazzagli M, et al. Quantitative real-time reverse transcription polymerase chain reaction: normalization to rRNA or single housekeeping genes is inappropriate for human tissue biopsies. Anal. Biochem. 2002; 309: 293–300. PMID:12413463 14. Vasir B, Aiello LP, Yoon KH, Quickel RR, Bonner-Weir S, Weir GC. Hypoxia induces vascular
endothe-lial growth factor gene and protein expression in cultured rat islet cells. Diabetes. 1998; 47(12): 1894– 903. PMID:9836521
15. Zhan C, Zhang Y, Ma J, Wang L, Jiang W, Shi Y, Wang Q. Identification of reference genes for qRT-PCR in human lung squamous-cell carcinoma by RNA-Seq. Acta Biochim Biophys Sin (Shanghai). 2014; 46(4): 330–7.
16. Turabelidze A, Guo S, DiPietro LA. Importance of housekeeping gene selection for accurate reverse transcription-quantitative polymerase chain reaction in a wound healing model. Wound Repair Regen. 2010; 18(5): 460–6. doi:10.1111/j.1524-475X.2010.00611.xPMID:20731795
17. Kriz J, Jirak D, White D, Foster P. Magnetic resonance imaging of pancreatic islets transplanted into the right liver lobes of diabetic mice. Transplant Proc. 2008; 40(2): 444–8. doi:10.1016/j.transproceed. 2008.02.018PMID:18374096
18. Vandesompele J, De Preter K, Pattyn F, Poppe B, Van Roy N, De Paepe A, et al. Accurate normaliza-tion of real-time quantitative RT-PCR data by geometric averaging of multiple internal control genes. Genome Biol. 2002; 3(7): RESEARCH0034. PMID:12184808
19. Gorzelniak K, Janke J, Engeli S, Sharma AM. Validation of endogenous controls for gene expression studies in human adipocytes and preadipocytes. Horm Metab Res. 2001; 33(10): 625–7. PMID: 11607884
20. Ferguson BS, Nam H, Hopkins RG, Morrison RF. Impact of reference gene selection for target gene normalization on experimental outcome using real-time qRT-PCR in adipocytes. PLoS One. 2010; 5 (12): e15208. doi:10.1371/journal.pone.0015208PMID:21179435
21. Marzoratia S, Antoniolia B, Nanoa R, Maffib P, Piemontic L, Giliolad C, et al. Culture Medium Modulates Proinflammatory Conditions of Human Pancreatic Islets Before Transplantation. Am J Transplant. 2006; 6: 2791–2795 PMID:16939517
22. Ihm SH, Matsumoto I, Zhang HJ, Ansite JD, Hering BJ. Effect of short-term culture on functional and stress-related parameters in isolated human islets. Transpl Int. 2009; 22(2): 207–16. doi:10.1111/j. 1432-2277.2008.00769.xPMID:18954375
23. Rosenberg L, Wang R, Paraskevas S, Maysinger D. Structural and functional changes resulting from islet isolation lead to islet cell death. Surgery. 1999; 126(2): 393–8. PMID:10455912
24. Emamaullee JA, Shapiro AM. Factors influencing the loss of beta-cell mass in islet transplantation. Cell Transplant. 2007; 16(1): 1–8. PMID:17436849
25. Ilieva A, Yuan S, Wang RN, Agapitos D, Hill DJ, Rosenberg L. Pancreatic islet cell survival following islet isolation: the role of cellular interactions in the pancreas. J Endocrinol. 1999; 161(3): 357–64. PMID:10333538
26. Wang RN, Rosenberg L. Maintenance of beta-cell function and survival following islet isolation requires re-establishment of the islet-matrix relationship. J Endocrinol. 1999; 163(2): 181–90. PMID:10556766 27. Pileggi A, Ricordi C, Alessiani M, Inverardi L. Factors influencing Islet of Langerhans graft function and
monitoring. Clin Chim Acta. 2001; 310(1): 3–16. PMID:11485749
28. Abdelli S, Ansite J, Roduit R, Borsello T, Matsumoto I, Sawada T, Allaman-Pillet N, et al. Intracellular stress signaling pathways activated during human islet preparation and following acute cytokine expo-sure. Diabetes. 2004; 53(11): 2815–23. PMID:15504961
29. Huggett J, Dheda K, Bustin S, Zumla A. Real-time RT-PCR normalisation; strategies and consider-ations. Genes Immun. 2005; 6(4): 279–84. PMID:15815687
30. Arsenijevic T, Grégoire F, Delforge V, Delporte C, Perret J. Murine 3T3-L1 adipocyte cell differentiation model: validated reference genes for qPCR gene expression analysis. PLoS One. 2012; 7(5): e37517. doi:10.1371/journal.pone.0037517PMID:22629413