Temperature modifications in
shantytown environments and
thermal discomfort
ABSTRACT
OBJECTIVE: To study aspects of the microclimate in a shantytown (favela), in order to understand the influence of the land occupation pattern on its climatic parameters.
METHODS: The study was carried out in a shantytown located in the southwestern
region of the city of São Paulo, Brazil, between February 19 and July 31, 2003, i.e. covering the whole autumn and parts of the summer and winter. The air temperatures were measured every hour on a microclimate scale, at four points within this densely populated shantytown and, as a control, on a tree-lined street nearby.
RESULTS: In the summer, the average hourly temperatures in the shantytown were
between 18.5°C and 29.5°C but, away from it, they were 2°C to 3°C lower at the hottest times of the day. In the autumn, the temperatures ranged from 15.5°C to 25.5°C and in the winter, 13.5°C to 25.5°C. The chilliest time in the shantytown was before dawn in the autumn and at 7 a.m. in the winter. The temperature variation was greater inside the shantytown than outside of it. The temperatures were within the comfort range for around 50% of the time. Temperatures below the lower limit (18°C) were more frequent than those above the upper limit (24°C). Temperatures above the upper limit were more frequent in the shantytown than outside of it.
CONCLUSIONS: The land occupation is a temperature differentiation factor. In the
shantytown, the temperatures were higher during the daytime (by up to 3°C) and lower at nighttime (by 1°C on average). The shantytown environment accentuated the temperature extremes, while the temperatures in the control street were milder.
KEYWORDS: Microclimate. Temperature. Poverty areas. Housing.
Edelci Nunes da Silva
Helena Ribeiro
Departamento de Saúde Ambiental. Faculdade de Saúde Pública. Universidade de São Paulo. São Paulo, SP, Brasil
Correspondence:
Edelci Nunes da Silva
Estrada Municipal do Espigão, 176 06710-500 Cotia, SP, Brasil E-mail: [email protected]
INTRODUCTION
São Paulo is one of the biggest cities in the world, with many problems relating to the absence of housing poli-cies. Shantytown areas have been growing in number and extent since 1970. During the 1990s, while the population of the municipality grew by 0.9% per year, the population in the shantytowns grew by 3.84% per year, to reach 8.5% of the city’s population in 2000.*
Today, the shantytowns predominantly consist of houses built using concrete and bricks, with concrete roof slabs or asbestos roofing. The installation of infrastructure (asphalt, water and electricity) and the masonry con-struction of the houses themselves have not been re-flected in widespread improvements in the livability conditions. Moreover, the absence of vegetation, high density and impermeabilization of the construction lots – with irregular and very narrow streets – expose the resident population to risks that are not always visible.
The volume of buildings in cities is capable of modi-fying the original characteristics of the climate. Fur-thermore, tons of pollutants are released into the at-mosphere every day, thereby modifying the climatic attributes and contributing towards increasing the sur-face temperatures, since these pollutants make it diffi-cult for the heat energy to escape from the system. These modifications are called the “urban climate”.
The urban climate has been widely studied in coun-tries located in middle latitudes, starting in 1950. In Brazil, it started to be important from around 1970, due to the environmental problems resulting from accelerated urbanization.
Although climate modification in cities occurs on a local scale, i.e. throughout the city, it is the differentia-tion within the urban environments (on a microclimate scale) that create favorable or unfavorable conditions for the inhabitants’ climatic comfort.
Lacaz4 (1972) emphasized that medical
biome-teorology should be studied in tropical areas. This author defined urban biometeorology as the study of “the influence that microclimates in buildings or cit-ies have on health, and the effect that architectural design and urban planning have on these micro-climates”. Other Brazilian authors who have studied the urban climate and its effects on health have also pointed out the same need.5,6,11
Jendritzky et al3 (1994) considered that the
biocli-matic parameters within spaces modified by man, such as within streets, blocks and parks, were of im-portance. The human body has a constant relation-ship with the atmospheric environment, which presents widely varying thermal and hygrometric conditions, and it puts a thermal regulation system into action to maintain its internal temperature be-tween 36.5°C and 37.5°C. That is, there are reduc-tions in gains or increases in losses of heat by means of certain control mechanisms.1,3,7
Among the low-income population, the economic conditions often do not allow the use of air condi-tioning, fans and heaters for regulating unfavorable internal microclimatic conditions. Moreover, the con-structions are precarious, using materials and tech-niques that make it difficult to achieve thermal insu-lation,** thus leaving this population more vulner-able to extremes in the climatic conditions.
The present study had the objective of studying the characteristics of the microclimate in a shantytown environment. In addition, it had the objectives of evaluation the influence of the land occupation pat-tern on the microclimatic parameters and indicating possible risks to the health and wellbeing of people living there, in order to provide backing for public policies for improvements in shantytown areas.
METHODS
This study was conducted in Paraisópolis, a shanty-town (favela) in the southwestern part of the city of São Paulo. This shantytown occupies 85 hectares in the Vila Andrade area of Morumbi, one of the richest districts of the city, where signs of spatial and social segregation can nevertheless be found. It is inhab-ited mainly by migrants from other Brazilian states, especially from Northeastern Brazil, and 52.4% of the families live on incomes of less than three mini-mum (monthly) wages and 24% on incomes of less than one minimum wage.***
The constructions have increased and taken over free spaces that previously were vegetated or unoccupied because they were less suitable for occupation. In 1986, there were around 5,000 homes, and in 2000, 11,823 homes.****
The population density in the shantytown is 520
inhab-*Instituto Brasileiro de Geografia e Estatística - IBGE. Censo Demográfico, 2000. Available from http://www.ibge.gov.br [accessed in 2003 Oct 28]
**Thermal insulation is the capacity for reducing the transfer of heat between two environments.
***Instituto Diadema de Estudos Municipais. Censo de morbidade do Hospital Israelita Albert Einstein. Paraisópolis; 1997.
itants/hectare.3 However, in 2002, higher densities were
found:* in 46.14% of the area, the density was more than 600 inhabitants/hectare and, in a few parts, it was more than 1,000 inhabitants/hectare. The contrasts are clear when these are compared with the densities for the Vila Andrade area (72.2 inhabitants/hectare) and for the whole Morumbi district (30 inhabitants/hectare).
After obtaining cartographic information from aerial photographs and field visits, a homogeneous topo-graphic area at the bottom of a valley was defined, in order to eliminate factors such as the exposure of the slopes and altitude. With regard to the land occupa-tion pattern, an area characteristic of the shantytown was selected, with predominance of one and two-sto-rey houses that were very densely packed together, with narrow alleys giving access to houses inside the block, and absence of vegetation.
Following the delimitation of the area, four stations were set up, consisting of digital temperature record-ers manufactured by Onset (Stowaway XT102 model) inside ventilated mini-shelters at a height of two me-ters above the ground, in the locations described in Table 1. These mini-shelters were almost lightproof, with walls that provided thermal insulation. The in-ternal volume was small and the air was continually drawn through, which eliminated direct interference from variations in wind strength and direction on the performance of the instruments.
This investigation of the microclimate** was guided by the theoretical proposals from Monteiro6 (2003),
and it took into consideration a rhythmic approach and the urban climate system (UCS).
The data collection instruments were distributed around environments within the shantytown and took into account the width of the streets and alleys. Through this, it was sought to find out whether the spatial ar-rangement and density*** of the houses constituted factors for transforming the thermal conditions on a microclimatic scale. As a control, measuring
instru-ments were also set up in a standard street in a non-shantytown environment (in the Morumbi district).
The temperature and relative air humidity recordings were programmed to be made every hour, in accord-ance with the pattern for conventional meteorologi-cal stations. The measurements were made from Feb-ruary 18, 2003 to July 31, 2003, thus covering a pe-riod of five months and 10 days that encompassed the autumn and parts of the summer and winter.
Comparisons with the local scale were made using data from: a) the experimental station of the Climatology and Biogeography Laboratory (CBL) of the Universidade de São Paulo (USP), located on the uni-versity campus in the western zone of the city of São Paulo; and b) the meteorological station of the Depart-ment of Atmospheric Sciences, Instituto de Astronomia e Geofísica (IAG), USP, located in the Fontes do Ipiranga state park, in the southern zone of the city of São Paulo.
First of all, the data were organized into a single data-base and inconsistent recordings were eliminated. Then, by using an electronic spreadsheet, the hourly mean temperatures and temperature ranges were cal-culated for all the stations, in order to analyze the distribution of the temperatures over the course of the day, and these were plotted on graphs.
The hourly mean temperature data were grouped by period: summer (February 18 to March 31); autumn (April 1 to May 31) and winter (June 1 to July 31).
To evaluate the possible impact of the temperatures, thermal comfort ranges that had been established in three different studies were utilized.10,12,13 The World
Health Organization and United Nations
Environmen-tal Program (WHO/UNEP,13 1990) defined the
com-fort range as between 18°C and 24°C, within which there would not be any risk to the health of healthy individuals, under appropriate clothing, insulation, humidity, radiant temperature, wind and psychologi-cal conditions. Weihe12 (1986) defined the range of
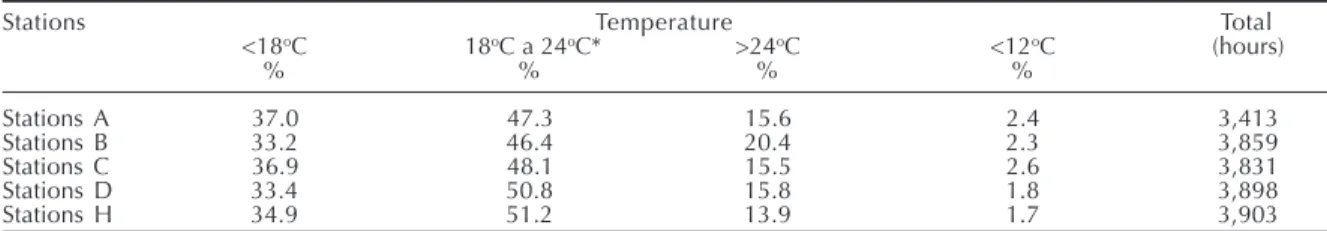
Table 1 - Frequency of hourly temperatures according to comfort range,* at the stations in the Paraisópolis shantytown (A-D) and Morumbi (station H). São Paulo, Brazil, February to July 2003.
Stations Temperature Total
<18oC 18oC a 24oC* >24oC <12oC (hours)
% % % %
Stations A 37.0 47.3 15.6 2.4 3,413
Stations B 33.2 46.4 20.4 2.3 3,859
Stations C 36.9 48.1 15.5 2.6 3,831
Stations D 33.4 50.8 15.8 1.8 3,898
Stations H 34.9 51.2 13.9 1.7 3,903
*Comfort range proposed by the World Health Organization and United Nations Environmental Program (WHO/UNEP)13
*Secretaria Municipal de Habitação e Desenvolvimento Urbano; Diagonal Urbana. Diagnóstico socioeconômico e urbanístico ambiental das comunidades de Paraisópolis, Jardim Colombo e Porto Seguro. São Paulo; 2002. [CD-ROM]
**The microclimate is the state of the atmosphere around a point.13
acceptable thermal neutrality, without any impact on health, as temperatures of between 17°C and 31°C. According to Sorre10 (1984), the range of comfort was
between 16°C and 23°C and, through repetition and accumulation, instantaneous effects that separately were not harmful could become intolerable. Self-regu-lation systems are brought into action when the tem-peratures are less than 16°C (cold zone) and
more than 23°C (hot zone).
RESULTS
Only the data relating to air temperatures are presented. The data on relative humidity served only as a basis for the analysis and discussion of the results from the tempera-ture recordings.
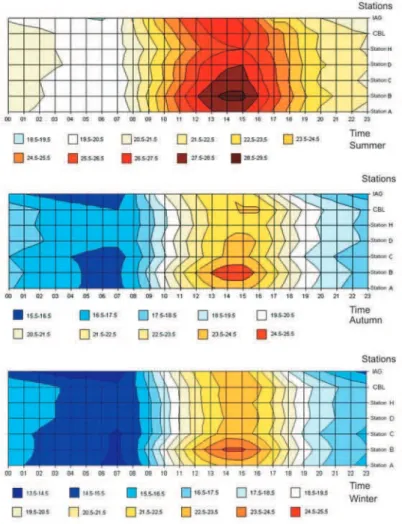
In the summer, the hourly mean temperatures were between 18.5°C and 29.5°C. As shown in Figure 1, station B presented higher mean temperatures than did the other stations in the shantytown, and station H (outside the
shantytown) presented the lowest mean temperatures.
Even after the cooling down that took place after 4:00 p.m., higher tempera-tures were maintained at stations B and D than at the others, until 8:00 p.m., thus indicating heat storage. There was attenuation of the temperatures by be-tween 2°C and 3°C at the hottest times of the day at station H, in relation to the stations in the shantytown.
In the autumn, the mean temperatures were between 15.5°C and 25.5°C. The process of cooling of the air started at 4:00 p.m., at all the stations. There was greater cooling down at the stations in the shantytown during the small hours (before dawn), in relation to Morumbi and USP.
In the winter, the hourly mean tempera-tures were between 13.5°C and 25.5°C. The lowest temperatures occurred at sta-tions A, B and C (between 13.5°C and 14.5°C), at 7:00 a.m.
The daily temperature range is pre-sented in Figure 2. Stations B and C presented the greatest amplitudes (Rua Rudolf Lotze and Córrego do Brejo, re-spectively) and station H had the small-est range.
Tables 1 and 2 show the impact of the temperatures on the shantytown according to the control range definitions adopted.
According to the criterion from WHO/UNEP,13 the
tem-Figure 2 - Daily temperature ranges (°C) in the Paraisópolis shantytown (stations A, B, C and D) and Morumbi (station H). São Paulo, February to July 2003.
peratures were within this comfort range for around 50% of the hours observed in Paraisópolis. Observations of temperatures below the minimum limit (18°C) were more frequent than observations above the maximum limit (24°C). Stations A and C presented temperatures below 18°C more often than did stations B and D. Tempera-tures above the limit of 24°C occurred most frequently at station B and least frequently at station H.
There is evidence that air temperatures of less than 12°C are a risk factor for elderly people, people with illnesses and handicaps and children of preschool age. Such temperatures were not observed for more than 2.5% of the total number of hours observed. Nonetheless, the greatest frequencies occurred at sta-tions A, B and C, while stasta-tions D and H presented the least frequencies.
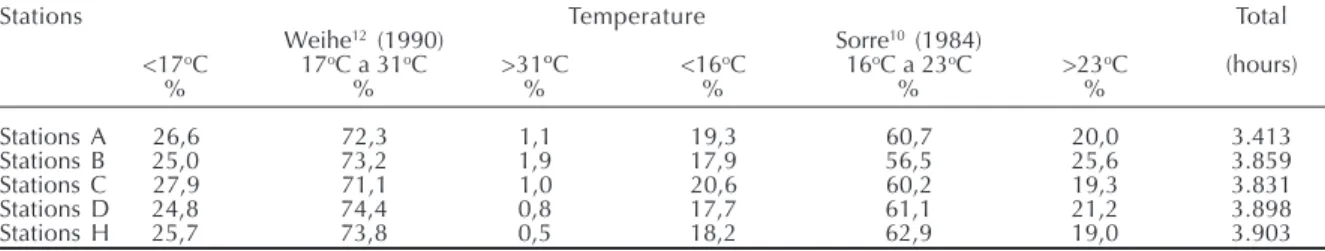
Temperatures within the range of acceptable neutral-ity12 occurred at more than 70% of the hours. Outside
of this range, the greatest percentage was related to temperatures of less than 17°C. Stations A and C had the greatest percentages of hours with temperatures of less than 17°C, and stations B, D and H had per-centages similar to each other. The greatest percent-ages of hours with temperatures of more than 31°C were at stations A, B and C.
The temperatures were within the comfort range de-fined by Sorre10 (16°C to 23°C) for approximately
60% of the hours. In this case, the pattern differed from the preceding ones. The percentages of hours with temperatures of more than the maximum limit (23°C) were greater than those with temperatures of less than the minimum limit (16°C), except at station C. The percentages of hours with temperatures con-sidered to be in the hot zone and cold zone at stations A, C and H were very close to each other, while at stations B and D there were greater percentages of hours with temperatures of more than 23°C. At sta-tion C, the frequencies of hours with temperatures of less than 16°C were greater.
DISCUSSION
The time period for the sampling covered the autumn
and parts of the summer and winter. Thus, this could constitute a limitation on the study, since the major-ity of the data corresponded to an intermediate sea-son, with thermal oscillations.
The land occupation pattern and street layout in the shantytown formed differentiating factors regarding the thermal characteristics. At stations A, B and C, the thermal contrasts were more accentuated, with greater daytime heating and greater nighttime cooling, es-pecially during the colder seasons. At the most en-closed space (station D), there was attenuation of the highest and lowest temperatures in relation to the microenvironments of the shantytown and in relation to the CBL.
The thermal conditions at station H were milder. It is believed that the width of the street, the spacing be-tween the houses and the presence of trees and gar-dens contributed towards attenuating both the high-est and the lowhigh-est temperatures.
The data obtained confirm the statement by Oke8
(1981) that it is not possible to establish a climatic behavioral pattern inside urban canyons. This is be-cause several factors interfere in their microclimates: the orientation of the streets, which implies differ-ences in the angle of incidence of the sunlight; the characteristics of the construction materials; and the street geometry, i.e. the width/height ratios. These relationships will define greater or lesser capacity for solar energy to penetrate into the canyon. In a narrow street, all the radiation that enters the atmospheric environment is absorbed because of the multiplicity of reflections, independent of the orientation of the street. In these streets, the heat is absorbed princi-pally by the walls of the buildings.
Station B was installed in one of the principal streets of the shantytown. This street is wide, which allows sunlight to penetrate to ground level, thus contribut-ing towards heatcontribut-ing up the air. However, the land use pattern, i.e. the high density of occupation by people living there, the lack of trees, the paving of the street and the intense traffic of vehicles may increase the heating effect. This station presented the highest daily
Table 2 - Frequency of hourly temperatures according to comfort ranges proposed by Weihe12 and Sorre,10 at the stations in the Paraisópolis shantytown (A-D) and Morumbi (station H). São Paulo, Brazil, February to July 2003.
Stations Temperature Total
Weihe12 (1990) Sorre10 (1984)
<17oC 17oC a 31oC >31ºC <16oC 16oC a 23oC >23oC (hours)
% % % % % %
Stations A 26,6 72,3 1,1 19,3 60,7 20,0 3.413
Stations B 25,0 73,2 1,9 17,9 56,5 25,6 3.859
Stations C 27,9 71,1 1,0 20,6 60,2 19,3 3.831
Stations D 24,8 74,4 0,8 17,7 61,1 21,2 3.898
and hourly mean and maximum temperatures over a large proportion of the period monitored. The sea-sonal analysis of the hourly mean temperatures iden-tified greater cooling down in the autumn and winter, during the small hours (before dawn).
Station C was located at the Córrego do Brejo, which is a stream in a gully. At this location, the houses are made of wood and are on top of the stream, on stilts. However, the view of the sky is less than in the prin-cipal street because of the narrowness of the stream (1.2 m) and the density and height of the houses. Thus, less sunlight penetrated than at the principal street, and therefore this location presented lower daily and hourly mean temperatures than did sta-tion B, for most of the period. The daily temperature range presented large oscillations, over almost the entire period, thus indicating large daily tempera-ture contrasts. In the autumn and winter, station C also presented maximum cooling down at between 5:00 a.m. and 7:00 a.m. This microspace also pre-sented high relative air humidity because of its lo-cation on top of the stream, the presence of water and sewage pipes above ground level, the presence of frequent leaks from taps and tanks and the fact that the area was used for drying clothes. The mate-rial utilized for constructing these houses (wood) also contributed towards water retention.
Station A was installed at Travessa Nossa Senhora Aparecida, which is a side street, corresponded to an intermediate situation. The limited width of the street (4m) and the great density and height of the houses reduced the view of the sky and restricted the entry of sunlight to ground level. The highest temperatures were milder than those at station B, although the ac-centuated thermal contrasts were also observed, as seen in the temperature ranges and the greater cool-ing down observed in the autumn and winter.
Station D was installed in Viela do Mota, which is a very narrow alleyway (1.2 m). The density of the con-structions and the heights of the houses (some with two storeys advancing over the alley) make this envi-ronment an almost closed corridor. The temperatures were lower than at the other stations in the shantytown, because of the smaller entry of sunlight down to ground level. On the other hand, at this station the hourly mean temperatures remained high for longer times. There was no great cooling down at the start of the morning, thus indicating the storage of heat within this microenvironment and therefore less heating up and cooling down than seen at the other stations in the shantytown. It can be considered that the activi-ties inside the houses must be reflected in the exter-nal spaces. The high density of the houses and the
precarious insulation of the constructions, for exam-ple, allow easy transmission of heat produced inside, to the exterior.
The greater cooling down at stations A, B and C (be-tween 5:00 a.m. and 7:00 a.m.), in the autumn and winter, must be related to the pattern of land use and the positioning of the stations at the bottoms of val-leys. Cold air from the higher areas drains to the lower areas, thus forming small temperature inversions. This greater cooling did not occur at station D, even though it was also located at the bottom of a valley. In this case, the topographic influence may have been neutralized by the street layout and the pattern of high density.
Station H (control area) was in Rua Silveira Sampaio, a tree-lined street with a width of 12 m, spaces be-tween the houses, gardens around the houses and sidewalks. The data from this location indicated that there was greater thermal comfort. The hourly mean temperatures were up to 3°C lower than in the shantytown, during the daytime (Figure 1). In the autumn and winter, the attenuation was up to 2°C during the daytime, thus confirming that high tem-peratures become milder in urban areas with the pres-ence of trees. However, there was also less cooling down at this station than seen in the shantytown, and this may be related to the land use pattern, the greater presence of vegetation and the higher topographic position (15 meters above the stations in the shantytown). Moreover, the colder air may have drained to the bottom of the valley.
The present study has shown that the temperatures are not distributed homogeneously in the shantytown, and that the street layout, housing density and type of con-struction material are differentiating factors for the microclimate attributes. The shantytown was shown to be an environment in which the temperatures were sometimes higher and sometimes lower than at other stations in the city and in the adjacent street. In other words, the temperature extremes were accentuated.
The study conf irms the hypothesis of Tarifa & Armani11 (2001) that shantytowns are environments
in which extremes of heating up and cooling down occur. It also corroborates those authors’ affirmation that shantytowns present mean temperatures that are 2°C to 3°C higher than in the whole Morumbi dis-trict. This difference could be observed at the time of greatest heating of the air (between 1:00 p.m. and 4:00 p.m.), in the hourly means. At other times of the day, there was non-uniform heat storage.
pertaining to the health of the people living in Paraisópolis can be posed. Are these temperature dif-ferences significant with regard to causing thermal discomfort? Do they constitute risk factors for the health of this population?
To verify the possible impacts on health, it would be necessary to undertake new studies in order to under-stand the population’s capacity for resilience to the rigors and variations in temperatures. There are few Brazilian references regarding thermal comfort indi-ces applied in Brazil, and those that exist are more concerned with architecture than with public health.*
The atmospheric temperature has a preponderant role in the conditions for human comfort and health.3,7,10
The sensation of thermal comfort is obtained when the heat exchanges between the individual and the environment occur without great effort. The main variables regarding human thermal comfort are the air temperature, solar radiation, air movement and humidity, although other variables also exist, such as level of acclimatization, psychological state, cloth-ing and others. Severe conditions of cold or heat may cause health problems or even lead to death. Never-theless, the ways in which components of the atmos-pheric environment act on the organism are still little understood. Studies on human comfort for establish-ing indicators have been conducted, particularly in northern hemisphere countries, and these relate to indoor environments in temperate climates.
According to WHO/UNEP13 (1990), there is a
pre-vailing idea that the conditions for thermal comfort depend on the external climate at each location and the cultural and technological adaptation of the na-tive people, rather than the idea that there is a univer-sal thermal comfort zone.
Nevertheless, studies have shown that the agreeable temperature in indoor environments in the summer for people who are native to cold climates is lower than the agreeable temperature for people from hot climates. It is considered that 19°C is an agreeable temperature in indoor environments for people who are native to cold climates and 29.8°C for people from hot climates.13 From this observation, it can be
inferred that people coming from hot climates gener-ally tolerate high temperatures better.
Sobral9 (1996) studied the effects of heat islands and
their correlation with cardiovascular and respiratory diseases. In that study, heat was not identified as an
etiological factor for mortality, mainly because the lowest number of deaths in the central region of São Paulo occurred in the summer. This author raised the hypothesis that the acclimatization to higher tempera-tures in São Paulo may be due to the fact that large numbers of migrants came from the states in North-eastern Brazil. It was considered that this poorer popu-lation would be even more vulnerable to temperature oscillations because of their precarious housing.
Gouveia et al2 (2003) indicated that heat and cold
were related to increased mortality due to cardiovas-cular and respiratory diseases and others. However, they found a higher proportion of deaths at lower temperatures, particularly among children and old people, in the city of São Paulo.
Thus, for the population of Paraisópolis, lower peratures would be more intolerable than higher tem-peratures, since the majority of the residents came from hotter regions and would be adapted to the high temperatures.
With regard to the causes of illnesses in Paraisópolis, a comparison of hospitalizations in 2001 according to the Brazilian national health system (SUS - Sistema Único de Saúde) showed that the hospitalization rate was 6.3% higher in the shantytown (419/10,000) than in the whole municipality of (394/10,000). The three most frequent causes of hospitalizations were the same for both of these areas, but the other frequent causes followed different patterns. For example, in the shantytown there are more hospitalizations due to bronchopneumonia in young infants, asthmatic crises and bronchiolitis, which are diseases related to atmospheric factors.**
In addition to the aggravating factors from the at-mosphere, there are the characteristics of shantytown housing: precarious construction, poor ventilation and lack of thermal insulation. These contribute towards worse microclimatic conditions inside such housing. A study from another coun-try12 showed that, during heatwaves, the death rate
was higher in poorer districts, among those who were living in precarious housing conditions with-out air conditioning systems.
In the municipality of São Paulo, there are around one million people living in shantytowns, with large numbers of children, who are more vulnerable to the effects of atmospheric degradation. On the other hand, there are urban development programs underway in
*Funari FL. O Índice de sensação térmica humana em função dos tipos de tempo na Região Metropolitana de São Paulo [tese de doutorado]. São Paulo: Departamento de Geografia. Universidade de São Paulo; 2006.
*Secretaria Municipal do Verde e Meio Ambiente - SVMA. Atlas ambiental do Município de São Paulo - o verde, o território, o ser humano: diagnóstico e bases para definição de políticas públicas para as áreas verdes no Município de São Paulo. São Paulo; 2004.
REFERENCES
1. Frota AF, Schiffer SR. Manual de conforto térmico. 5a ed. São Paulo: Studio Nobel; 2001.
2. Gouveia N, Hajat S, Armstrong B. Socioeconomic differentials in the temperature-mortality relationship in São Paulo, Brazil. Int J Epidemiol. 2003;32:390-7. 3. Jendritzky G, Grätz A, Schultz E, Endlicher W. Urban
bioclimatology. In: World Meteorological
Organization. Report of the Technical Conference on Tropical Urban Climates; 1993 Mar 28 - Apr 2; Bangladesh. Geneva; 1994. p. 245-64. [WCASP-30, WMO/TD, 647]
4. Lacaz CS. Meteorologia médica. In: Lacaz CS, Baruzzi RG, Siqueira Júnior W. Introdução à geogra-fia médica do Brasil. São Paulo: Edgard Blücher/ Edusp; 1972. p. 39-84.
5. Monteiro CAF. Adentrar a cidade para tomar-lhe a temperatura. Geosul. 1990;5:61-79.
6. Monteiro CAF. Teoria e clima urbano. In: Monteiro CAF, Mendonça F, organizadores. Clima Urbano. São Paulo: Contexto; 2003. p. 9-67.
7. Moran EF. Adaptabilidade humana. São Paulo: Edusp; 1994.
8. Oke TR. Boundary layer climates. London: Methuen; 1981.
9. Sobral HR. Heat island in São Paulo, Brazil: effects on health. Crit Public Health. 2005;15:147-56.
10. Sorre M. A adaptação ao meio climático e biossocial: geografia psicológica. In: Megale JF, organizador. Max Sorre: geografia. São Paulo: Ática; 1984. p. 29-86.
11. Tarifa JR, Armani G. Os climas urbanos. In: Tarifa JR, Azevedo TR, organizadores. Os climas na cidade de São Paulo: teoria e prática. São Paulo: FFLCH/USP; 2001. p. 47-70.
12. Weihe WH. La esperanza de vida en los climas tropicales en función de la urbanización. In: Organizacion Meteorologica Mundial. Conferencia tecnica sobre climatologia urbana y sus aplicaciones con especial referencia a las zonas tropicales in México. Geneva; 1986. p. 1-26.
13. World Health Organization - WHO; United Nations Environment Programme - UNEP. Indoor
environment: health aspects of air quality, thermal environment, light and noise. Geneva; 1990. [WHO/ EHE/RUD/90.2]
Based on a master’s dissertation presented to the Department of Environmental Health, Faculdade de Saúde Pública da Universidade de São Paulo, in 2004.
shantytowns that may take sustenance from the re-sults of the present study. The planning of free spaces containing vegetation and the adaptation of the cir-culation system inside the shantytown may improve the comfort conditions.
It is emphasized that the present study was carried out in a sector of the city of São Paulo that, consid-ered on a mesoscale, has better atmospheric environ-mental quality.11,* It is possible that, in districts where
the atmosphere is more degraded, the thermal impact in shantytown environments will be more acute. As well as social inequality and urban segregation, the
population in shantytowns suffers environmental in-equality, which implies simultaneous exposure to several forms of inequality.