Hydrolyzed collagen (gelatin) decreases
food efficiency and the bioavailability
of high-quality protein in rats
Colágeno hidrolisado (gelatina) reduz a
eficiência alimentar e a biodisponibilidade
de proteína de alta qualidade em ratos
Cláudia Cantelli Daud BORDIN1 Maria Margareth Veloso NAVES1
A B S T R A C T
Objective
Although deficient in all indispensable amino acids, gelatin is used in protein-restricted diets. Food efficiency and protein quality of casein and gelatin mixtures in low protein diets in Wistar rats were investigated.
Methods
The rats were treated with protein-restricted diets (10.0 and 12.5%) containing casein (control diets), casein with gelatin mixtures (4:1 of protein content), and gelatin as sources of protein. The food conversion ratio, protein efficiency ratio, relative and corrected protein efficiency ratio, true protein digestibility, and hepatic parameters were estimated.
Results
After 28 days of the experiment, food efficiency of 10.0% casein/gelatin diet decreased when compared to that of 10.0% casein diet, and the protein efficiency ratio of the casein/gelatin mixtures (10.0%=2.41 and 12.5%=2.03) were lower than those of the casein (10.0%=2.90 and 12.5%=2.32). After 42 days of the experiment, the weight of the liver of the animals treated with 10.0 and 12.5% casein/gelatin diets, and the liver protein retention of the 12.5% casein/gelatin diet group of animals were lower than those of the control group.
Conclusion
Gelatin decreases food efficiency and high-quality protein bioavailability in protein-restricted diets.
Keywords: Amino acids. Biological availability. Caseins. Gelatin. Proteins. Rats.
1Universidade Federal de Goiás, Faculdade de Nutrição, Programa de Pós-Graduação em Nutrição e Saúde. R. 227, Qd. 68,
R E S U M O
Objetivo
A gelatina é deficiente em todos os aminoácidos indispensáveis, mas é usada em dietas com restrição de proteína. A eficiência alimentar e a qualidade da proteína de misturas de caseína com gelatina em dietas com baixo teor de proteína foram investigadas em ratos Wistar.
Métodos
Ratos foram tratados com dietas restritas em proteína (10,0 e 12,5%), contendo, como fonte de proteína: caseína (dieta controle), misturas de caseína com gelatina (4:1 do teor de proteína) e gelatina. Foram estimados os seguintes índices: taxa de conversão alimentar, quociente de eficiência proteica, quociente de eficiência proteica relativo e corrigido, digestibilidade verdadeira da proteína e parâmetros hepáticos.
Resultados
Após 28 dias de experimento, a eficiência alimentar da dieta caseína:gelatina a 10,0% diminuiu em comparação com a dieta de caseína a 10,0%, e o quociente de eficiência proteica das misturas caseína: gelatina (10,0%=2,41 e 12,5%=2,03) foi menor do que aqueles da caseína (10,0%=2,90 e 12,5%=2,32). Após 42 dias de experimento, o peso do fígado dos animais tratados com mistura caseína:gelatina a 10,0 e 12,5% e a retenção proteica no fígado dos animais do grupo caseína: gelatina a 12,5% diminuíram em comparação ao grupo-controle.
Conclusão
Gelatina reduz a eficiência alimentar e a biodisponibilidade de proteína de alta qualidade em dietas restritas em proteínas.
Palavras-chave: Aminoácidos. Disponibilidade biológica. Caseínas. Gelatina. Proteínas. Ratos.
I N T R O D U C T I O N
Gelatin is a soluble mixture of polypeptides
produced by the partial hydrolysis of collagen1.
Collagen is an insoluble protein of animal origin that holds organs and tissues together and gives strength to tendons, among other biological
functions2,3. In nutritional terms, gelatin is an
incomplete protein because its amino acid profile is quite atypical and deficient in all of the indispensable (essential) amino acids recommended by the Food and Nutrition Board of the Institute of Medicine (IOM) of the National
Academy of Sciences4. It is known that gelatin
contains no tryptophan5,6.
Gelatin and collagen hydrolysate have been shown to improve skin hydration, transepidermal water loss, elasticity, and skin
barrier dysfunction7,8. Furthermore, they have
been used to promote weight loss because studies have shown that gelatin can inhibit appetite and
promote satiety9,10. However, the use of gelatin
in a protein-restricted diets (like those before and after gastrointestinal tract surgery, chronic renal
insufficiency treatment diets, and those aimed to
promote weight loss11,12) could be a potential
nutritional risk. Insufficient protein intake (in terms of both quantity and quality) inhibits endogenous metabolism of proteins, prolongs the inflammatory phase of the healing process, decreases fibroblast proliferation, angiogenesis and collagen synthesis, and impairs tissue repair12. Therefore, the use of
gelatin in a protein-deficient diet could slow patient recovery.
Considering the uses of gelatin in protein-restricted diets, this study investigated food efficiency and protein quality of casein (a complete protein) and gelatin mixtures in low protein diets administered to Wistar rats.
M E T H O D S
The biological assay was carried out with 36 weanling male Wistar rats (21-23 days old), which were randomically distributed in six groups with six animals each, and average body weight
ranging from 51.8 to 54.6 g per group. The rats
environmental conditions (12-h light/dark cycle, relative humidity between 40-70%, temperature
between 20-23°C)13. The rats were fed diets
formulated according to the American Institute
of Nutrition (AIN-93G)14 (Table 1), containing
different sources of protein and reduced protein contents, as follows: C10 - 10.0% protein (casein);
C8G2 - 10.0% protein (8.0% casein and 2.0%
gelatin); C12.5 - 12.5% protein (casein); C10G2.5 - 12.5% protein (10.0% casein and 2.5% gelatin); G10 - 10.0% protein (gelatin), and protein-free diet. In the C8G2
and C10G2.5 diets, 20.0% of casein protein was
replaced with gelatin protein (4:1 of protein content) to simulate the proportion of gelatin in a protein-restricted diet, besides the protein
complementation (C8G2) and supplementation
(C10G2.5) when compared to the C10 diet (control). The protein content in the diets ranged from
approximately 0.0% (protein free) to 10.0% (C10,
C8G2 and G10) and 12.5% (C12.5 and C10G2.5), and all protein diets had similar energy values, which were estimated using the conversion factors of 4, 4, and 9 kcal/g for protein, carbohydrates and
lipids, respectively15 (Table 1). Food and water
(filtered) were provided to the animals ad libitum
for 45 days, comprising 3 days of acclimatization and the following experimental periods: 2 weeks
for the protein-free and G10 groups and 4 weeks
for the C10, C8G2, C12.5 and C10G2.5 groups. The
treatment of the protein-free and G10 groups was
maintained for two weeks only to avoid animal suffering since they showed severe weight loss. In order to evaluate the influence of complementation and supplementation combining casein and gelatin on the growth of the animals and the liver protein retention, the treatment of the C10, C8G2, and C10G2.5 groups were maintained for 2 more weeks (total: 6 weeks). Food intake was monitored daily, and the acceptance of each diet was assessed comparing the amount of food
consumed versus the amount of food offered. The
animals were weighed three times a week. For the analysis of protein content, the animal feces were collected over 7 days during the second (for
the protein-free and G10 groups) or the fourth
week (for other groups) of the experiment. The
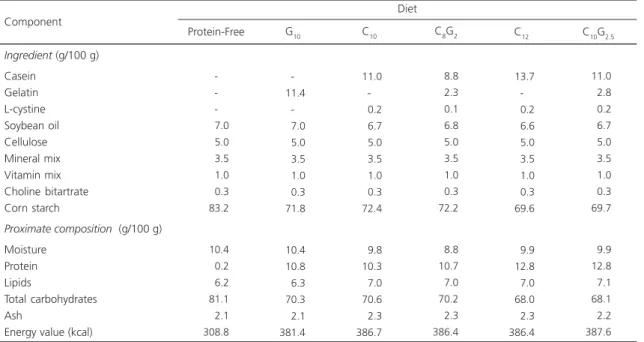
Table 1. Ingredients and proximate composition of experimental diets with different contents and sources of protein.
Ingredient (g/100 g)
Casein Gelatin L-cystine Soybean oil Cellulose Mineral mix Vitamin mix Choline bitartrate Corn starch
Proximate composition (g/100 g)
Moisture Protein Lipids
Total carbohydrates Ash
Energy value (kcal)
-007.0 005.0 003.5 001.0 000.3 083.2 010.4 000.2 006.2 081.1 002.1 308.8 -011.4 -007.0 005.0 003.5 001.0 000.3 071.8 010.4 010.8 006.3 070.3 002.1 381.4 011.0 -000.2 006.7 005.0 003.5 001.0 000.3 072.4 009.8 010.3 007.0 070.6 002.3 386.7 Component
Protein-Free G10 C10 C8G2
008.8 002.3 000.1 006.8 005.0 003.5 001.0 000.3 072.2 008.8 010.7 007.0 070.2 002.3 386.4 011.0 002.8 000.2 006.7 005.0 003.5 001.0 000.3 069.7 009.9 012.8 007.1 068.1 002.2 387.6 C10G2.5
013.7 -000.2 006.6 005.0 003.5 001.0 000.3 069.6 009.9 012.8 007.0 068.0 002.3 386.4 C12
Note: PF: Protein-Free, G10: 10.0% protein (gelatin), C10: 10.0% protein (casein), C8G2: 10.0% protein (8.0% casein and 2% gelatin), C12.5: 12.5% protein (casein), and C10G2.5: 12.5% protein (10.0% casein and 2.5% gelatin). Formulation according to AIN-93G14.
Casein: 91.1% ±0.29 of protein and 2.9% ±0.21 of lipids, gelatin: 88.0% ±0.63 of protein and 0.1% ±0.01 of lipids. L-cystine: 0.3 g for each 20 g of casein. Values are means of three replicates, with the exception of total carbohydrates, estimated by difference.
liver of C10, C8G2 and C10G2.5 groups was removed at the end of the sixth week. The experiment was carried out in accordance with the principles and procedures stated in the guide for the care and
use of laboratory animals13, and it was approved
by the Ethics Committee in Research of the
Universidade Federal de Goiás (Protocol no 381/10).
The gelatin and casein amino acid contents were determined after hydrolysis of the protein in an acid solution using an amino acid analyzer (Nicolas V, Ribeirão Preto [SP], Brasil) and colorimetric
post-column detection with ninhydrin16. The
amino acid profile of a powdered, unflavored gelatin (a common brand sold in Brazilian markets) was also analyzed to ensure that the gelatin used in the experimental diets was similar to gelatin used for human consumption. The indispensable Amino Acid Score (AAS) was estimated using the amino acid analysis results, which were compared
to the requirement pattern for indispensable
amino acids proposed by the IOM4, as follows:
AAS=[(mg of amino acids in 1 g of protein test/ mg of amino acids in standard) × 100].
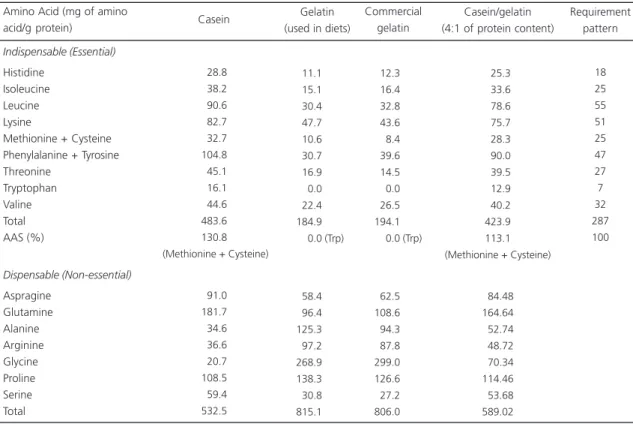
The amino acid profiles of the gelatin used in the experimental diets and the commercial gelatin (for human consumption) were similar, which allows extrapolation of this study results to the gelatin commonly used for human consumption. There is no tryptophan in gelatin, and according to the requirement pattern, gelatin is also deficient in other indispensable amino acids4. The casein/gelatin mixture (4:1 of protein
content) meets the patterns of amino acid requirements (Table 2).
The Nitrogen (N) content of casein, gelatin, experimental diets, and rats’ feces and liver were analyzed by the micro-Kjeldahl method using the factors 6.38 for casein, 5.55 for gelatin, and 6.25
Table 2. Amino acid composition of casein, gelatin, and Amino Acid Score (AAS) according to the Food and Nutrition Board/Institute of Medicine requirement pattern.
Indispensable (Essential)
Histidine Isoleucine Leucine Lysine
Methionine + Cysteine Phenylalanine + Tyrosine Threonine Tryptophan Valine Total AAS (%) Dispensable (Non-essential) Aspragine Glutamine Alanine Arginine Glycine Proline Serine Total 028.8 038.2 090.6 082.7 032.7 104.8 045.1 016.1 044.6 483.6 130.8 (Methionine + Cysteine)
091.0 181.7 034.6 036.6 020.7 108.5 059.4 532.5 011.1 015.1 030.4 047.7 010.6 030.7 016.9 000.0 022.4 184.9
000.0 (Trp)
058.4 096.4 125.3 097.2 268.9 138.3 030.8 815.1 012.3 016.4 032.8 043.6 008.4 039.6 014.5 000.0 026.5 194.1
0 0.0 (Trp)
062.5 108.6 094.3 087.8 299.0 126.6 027.2 806.0 Amino Acid (mg of amino
acid/g protein) Casein
Gelatin (used in diets)
Commercial gelatin 025.3 033.6 078.6 075.7 028.3 090.0 039.5 012.9 040.2 423.9 113.1 (Methionine + Cysteine)
084.48 164.64 052.74 048.72 070.34 114.46 053.68 589.02 Casein/gelatin (4:1 of protein content)
18 25 55 51 25 47 27 7 32 287 100 Requirement pattern
for feces and liver for converting nitrogen to crude protein17. Lipid content of the diets and livers was
analyzed according to the method described by Bligh & Dyer18. Moisture and ash were analyzed
using the methods defined by the Association of
Official Analytical Chemists17, and the total
carbohydrate content of the diets (including fiber) was calculated by subtracting the weight of total fat, crude protein, moisture, and ash from the total weight of the food.
Food and protein efficiency evaluation
The biological availability of the diets was evaluated using the following parameters:
animals’ growth and weight gain curve; Food
Conversion Ratio (FCR), which represents the
efficiency of food intake in promoting weight
gain; Protein Efficiency Ratio (PER), which is based on body weight gain compared to protein intake over a period of four weeks; Relative Protein
Efficiency Ratio (RPER); Corrected PER, which is
estimated by the PER of the protein test adjusted for the value of 2.5 (standard value for casein PER, estimated in diets with 10% protein); and true protein digestibility, assessed as the difference between nitrogen intake and nitrogen absorbed (fecal nitrogen input) and was expressed as a
percentage19,20. The hepatic profile of the C
10,
C8G2 and C10G2.5 groups was evaluated by the liver weight (g), relative liver weight (g per 100 g of body weight), and protein and fat contents.
The results of the chemical and biological assays were expressed as mean and standard deviation, and the data were submitted to the Analysis of Variance (Anova) and Tukey’s test, with
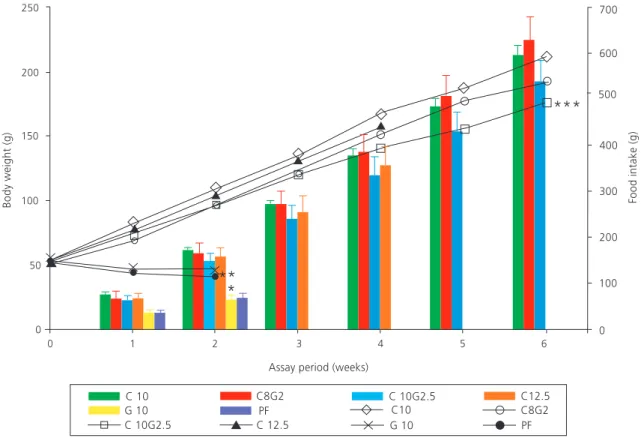
Figure 1. Body weight (lines) and food intake (bars) of rats treated with different diets over 6 weeks of experiment.
Note: C10 - 10.0% protein (casein), C8G2 - 10.0% protein (8.0% casein and 2.0% gelatin), C10G2.5 - 12.5% protein (10.0% casein and 2.5% gelatin), C12.5 - 12.5% protein (casein), G10 - 10.0% protein (gelatin), and Protein-Free (PF). After 2 weeks of experiment:
*Significant differences in
food intake between G10 and PF groups compared to the other groups;
**Significant differences in body weight between G
10 and PF groups compared to the other groups. After 6 weeks of the experiment: ***Significant difference in body weight between C
significance level set at p<0.05 using the Statistica Software Stat Soft Inc., 7th version (Tulsa, Oklahoma,
United States, 2004).
R E S U L T S
The animals of the C10, C8G2, C10G2.5, and C12.5 groups had similar body weight at the fourth week of experiment (p>0.05), and the C10G2.5
group had lower body weight gain than C10 group
at the sixth week (p<0.05) (Figure 1). The G10 and protein-free groups showed similar weight loss
(p>0.05) and low diet acceptance (G10=42.4%
±6.4 and protein-free=48.2% ±6.7) during the feeding period when compared to the other groups after two weeks of experiment
(C10=85.6% ±5.5, C8G2=82.5% ±11.8,
C10G2.5=81.9% ±11.2 and C12.5=73.4% ±9.6).
Although weight gain and food intake of the protein diets were similar after four weeks of
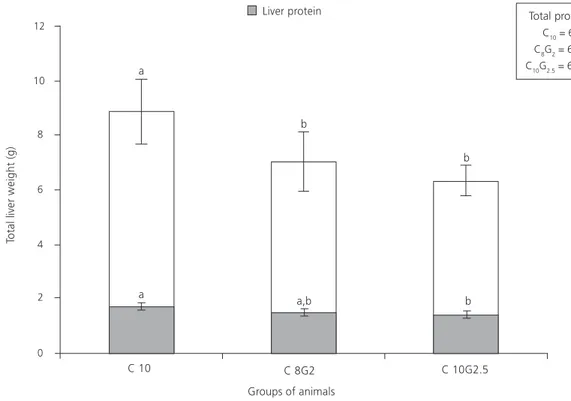
Figure 2. Total liver weight (g) and liver protein (g) of rats treated with different diets for 6 weeks.
Note: C10 - 10.0% protein (casein), C8G2 - 10.0% protein (8.0% casein and 2.0% gelatin), and C10G2.5 - 12.5% protein (10.0% casein and 2.5% gelatin).a,bSame lowercase letters above (liver weight) and inside (liver protein) bars and, above, total protein intake indicate no significant difference
(p>0.05).
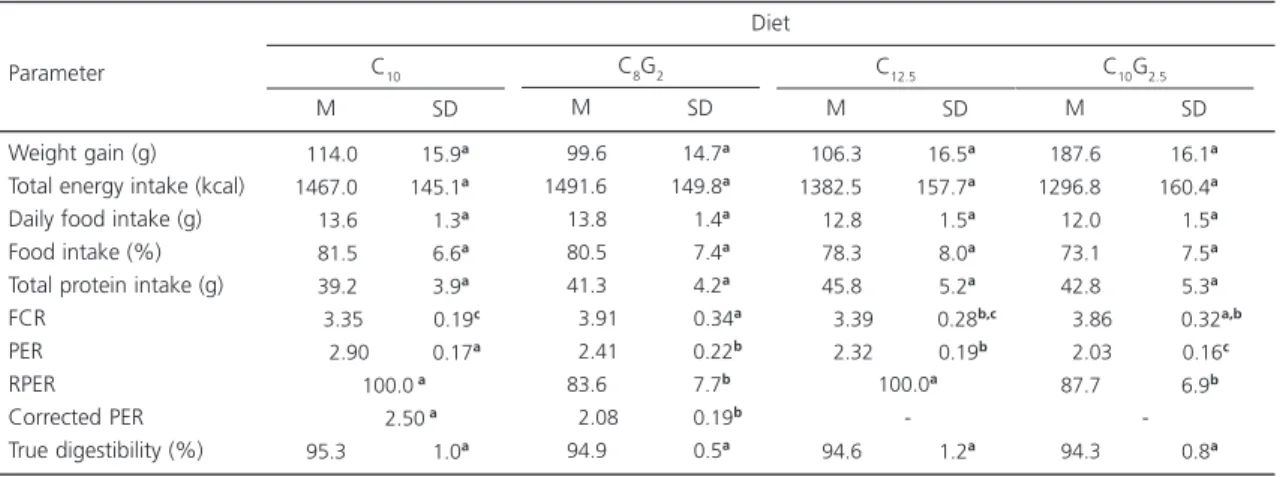
experiment (Figure 1), the FCR of the experimental groups were higher than that of the 10% protein control group in the protein complementation (C8G2 versusC10) and supplementation (C10G2.5
versus C10) diets (Table 3). After six weeks of experiment, the weight gain was similar in the
protein complementation (C8G2=141.6 g ±22.0)
diet, but in the protein supplementation diet was lower in the experimental group (C10G2.5=122.4 g
±15.5) than in the control group (C10=157.5 g
±19.8) (p<0.05).
The protein efficiency ratio of the diets
with the casein/gelatin mixtures was lower than those of their respective controls (C8G2 versus C10 and C10G2.5 versus C12.5), as well as in the protein
supplementation diet (C10G2.5)compared to the
C10 diet. The corrected PER of the C8G2 diet was approximately 2.0 when adjusted to the standard value of casein PER. The True Protein Digestibility of the diets was approximately 95% (Table 3).
Total protein intake (g): C10 = 61.7 + 5.5
a0
C8G2 = 67.9 + 5.3
a0
C10G2.5 = 69.0 + 5.93
The liver weight (g) and the relative liver
weight of the casein/gelatin groups (C8G2=3.8%
±0.2, C10G2.5=3.6% ±0.4) were lower than those
of the control group (C10=4.2% ±0.4); the liver
protein (g) of the C10G2.5 group was lower than
that of the C10 group (p<0.05), and there were no differences in the protein intake between the three groups of animals (Figure 2). The total liver fat was similar in all of the three groups (p>0.05), as follows: C10=0.28 g ±0.07; C8G2=0.28 g ±0.06, and C10G2.5=0.22 g ±0.02.
D I S C U S S I O N
Gelatin has lower contents of all the indispensable amino acids than those considered
necessary for human health4; its AAS is zero. On
the other hand, some dispensable amino acids (alanine, arginine, glycine, and proline) are present in gelatin in excessive amounts when compared
to other proteins of animal origin19-21, such as
casein (Table 2). This atypical and imbalanced amino acid profile in relation to human protein requirements suggests that gelatin should not be consumed by humans as a primary source of protein4,5.
The animals fed only gelatin as protein source lost body weight in a similar way to those
Table 3. Weight gain, food and protein intake, and protein utilization in rats after four weeks of experiment.
Weight gain (g) Total energy intake (kcal) Daily food intake (g) Food intake (%) Total protein intake (g) FCR
PER RPER Corrected PER True digestibility (%)
Note: C10: 10.0% protein (casein), C8G2: 10.0% protein (8.0% casein and 2.0% gelatin), C12.5: 12.5% protein (casein) and C10G2.5: 12.5% protein (10% casein and 2.5% gelatin). Different lowercase letters within a row indicate significant differences (p<0.05). Food intake=[(diet offered - diet rejected)/ diet offered) x 100].
FCR: Food Conversion Ratio, PER: Protein Efficiency Ratio, RPER: Relative PER; M: Mean; SD: Standard Deviation. Parameter 0114.0 1467.0 0013.6 0081.5 0039.2 0003.35 00002.90 0 00 95.3
015.9a0
145.1a0
001.3a0
006.6a0
003.9a0
000.19c
000.17a
001.0a0
M SD
100.0a
00 2.50a
C10
Diet
0099.60
1491.60 0013.80 0080.50 0041.30 0003.91
00002.410 0083.60 0002.08
0094.90
0014.7a0
149.8a
0001.4a0
0007.4a0
0004.2a0
0000.34a
0000.22b
0007.7b0
0000.19b
0000.5a0
M SD
C8G2
0106.30
1382.50 0012.80 0078.30 0045.80 0003.39
0002.32
0094.60
016.5aa0
157.7aa0 001.5a0a 008.0a0a 005.2aa0 000.28b,c
000.19ba
001.2a0a
M SD
C12.5
100.0a
-0187.60
1296.80 0012.00 0073.10 0042.80 0003.86
0002.03
087.7
0094.30
016.1a0
160.4a0
001.5a0
007.5a0
005.3a0
0000.32a,b
000.16c
006.9b0
000.8a0
M SD
C10G2.5
-fed the protein-free diet, as reported in other
studies22,23. This result can be explained by the
low protein quality of gelatin since its deficiency in indispensable amino acids inhibits endogenous protein synthesis. Furthermore, there is evidence in the literature that rats reject diets deficient in indispensable amino acids. As a result, the food intake of the animals is lower than their energy
requirements24. This was confirmed in the present
study as the G10 group rejected more than half
(57.6%) of the diet offered. The low energy intake along with the deficiency in indispensable amino acids accelerated the protein malnutrition of the animals25.
The similar food and energy intake resulted in no differences in the weight gain between the casein and casein/gelatin groups during the four weeks of experiment. Therefore, the different protein sources did not influence the weight gain in the different groups of animals. In addition, the similar energy intake between the treatments did not interfere with the bioavailability of protein sources, as recommended for in vivo protein quality evaluation19,25.
Food conversion ratio of the experimental
groups was higher than that of the control group,
versus C10) and supplementation (C10G2.5 versus
C10) with gelatin. Therefore, food efficiency was
lower when gelatin was present in the diet, making it necessary a higher intake of the casein/ gelatin diet than the control diet (10% protein) in order to reach similar weight gain.
The high quality of casein was reduced when it was complemented with gelatin at the two protein levels evaluated (C8G2 versus C10 and C10G2.5 versus C12.5), as well as when it was supplemented with gelatin (C10G2.5 versus C10). PER is a more sensitive method to evaluate protein quality since it uses growing animals, which have a higher protein requirement than adult animals. Furthermore, the PER index takes longer to complete than other methods, such as Net Protein
Ratio (NPR) (28 days versus 10-14 days, respectively). For these reasons, the PER is sensitive to small differences in protein quality19,25,26.
The reference protein efficiency ratio of
casein is 2.518,25, based on the Association of
Official Analytical Chemists (AOAC) official
method17, which does not include supplementation
with sulfur-containing amino acids. However, when the AIN-93G diet at 10% protein is used, the PER value of casein is higher than 2.5, as found in the present study, because the AIN diet is supplemented with L-cystine in order to correct the casein’s deficiency in sulfur-containing amino acids12. The corrected PER (adjusted to 2.5) of the
C8G2 diet was lower than that of casein (p<0.05) and close to 2.0, which is the minimum requirement for a good quality protein25.
The high protein digestibility of the diets (approximately 95%) indicates that gelatin did not influence casein digestibility. The absorption of the amino acids in gelatin is facilitated since it is a partially-hydrolyzed protein derived from collagen, and its digestibility is comparable to that of casein3,21. Therefore, it can be concluded that
protein digestibility did not influence the decrease in protein efficiency in the casein/gelatin mixture.
After six weeks of experiment, the total protein intake of the groups was similar, but in
the protein supplementation diet (C10G2.5), the
hepatic protein was lower than that of control
group. This fact suggests that the additional gelatin decreases the protein retention in the liver, i.e., the protein bioavailability.
Considering that the casein/gelatin mixture (4:1 of protein content) has sufficient indispensable amino acid content, as well as high digestibility, this mixture could be expected to have protein quality close to that of casein. However, this study showed that gelatin negatively influenced the protein quality of the casein/gelatin mixture. One possible explanation for this result could be the high contents of some dispensable amino acids in gelatin, such as glycine. During the protein absorption by the amino acid transport system, glycine (like other amino acids) has affinity for more than one carrier in the intestinal brush border. Therefore, molecules with a similar chemical structure
compete for the same carrier26. As a result, the
absorption of some indispensable amino acids can be impaired due to the excess of dispensable amino acids, which reduces the bioavailability of
indispensable amino acid27,28. Thus, further
investigations are needed on the reduction in protein bioavailability by gelatin when it is mixed with a high-quality protein, for example, performing a fecal amino acid profile analysis. We also suggest further investigation on the influence of gelatin on malnutrition recovery in different protein mixtures since it can be used to induce experimental malnutrition29.
C O N C L U S I O N
Gelatin interferes with protein efficiency of high-quality protein. This influence depends on the gelatin concentration in the mixtures and the amount of protein in the diet. When there is low protein intake, gelatin decreases food efficiency and the bioavailability of high-quality protein.
A C K N O W L E D G E M E N T S
The authors are grateful for the financial support provided by the Conselho Nacional de Desenvolvimento Científico e Tecnológico (research scholarship) and to the Professors Alceu Afonso Jordão Júnior and Daniela Canuto Fernandes for theoretical support.
C O N T R I B U T O R S
CCD BORDIN was responsible for data collection, literature review, and manuscript writing. MMV NAVES was responsible for the research design (idea and planning), participated in data analysis and synthesis, and contributed to the drafting and critical revision of the manuscript.
R E F E R E N C E S
1. Prestes RC, Golunski SM, Toniazzo G, Kempka AP, Luccio MD. Caracterização da fibra de colágeno, gelatina e colágeno hidrolisado. Rev Bras Prod Agroind. 2013; 15(4):375-82.
2. Poppe J. Gelatin. In: Imeson A. Thickening and gelling agents for food. 2nd ed. London: Blackie
Academic and Professional; 1997. p.144-68. 3. Djagny KB, Wang Z, Xu S. Gelatin: A valuable
protein for food and pharmaceutical industries: Review. Crit Rev Food Sci Nutr. 2001; 41(6):481-92. http://dx.doi.org/10.1080/20014091091904 4. Institute of Medicine. Protein and amino acids. In:
Dietary references intakes for energy, carbohydrate, fiber, fat, fatty acids, cholesterol, protein, and amino acids. Washington (DC): The National Academies; 2005. p.589-768.
5. Moskowitz RW. Role of collagen hydrolysate in bone and joint disease. Semin Arthritis Rheum. 2000; 30(2):87-99. http://dx.doi.org/10.1053/sarh. 2000.9622
6. Ten Have GA, Engelen MP, Soeters PB, Deutz NE. Absence of post-prandial gut anabolism after intake of a low quality protein meal.Clin Nutr. 2012; 31(2):273-82. http://dx.doi.org/10.1016/j.clnu. 2011.09.008
7. Proksch E, Segger D, Degwert J,Schunck M, Zaque V, Oesser S. Oral supplementation of specific collagen peptides has beneficial effects on human skin physiology: A doubleblind, placebo-controlled study. Skin Pharmacol Physiol. 2014; 27(1):47-55. http://dx.doi.org/10.1159/000351376
8. Shimizu J, Asami N, Kataoka A, Sugihara F, Inoue N, Kimira Y, et al. Oral collagen-derived dipeptides, prolyl-hydroxyproline and hydroxyprolyl-glycine, ameliorate skin barrier dysfunction and alter gene expression profiles in the skin. Biochem Biophys Res Commun. 2015; 456(2):626-30. http://dx.doi. org/10.1016/j.bbrc.2014.12.006
9. Hochstenbach-Waelen A, Westerterp-Plantenga MS, Veldhorst MA, Westerterp KR. Single-Protein casein and gelatin diets affect energy expenditure similarly but substrate balance and appetite differently in adults. J Nutr. 2009; 139(12):2285-92. http://dx.doi.org/10.3945/jn.109.110403 10. Veldhorst MA, Nieuwenhuizen AG,
Hochstenbach-Waelen A, Westerterp KR, Engelen MP, Brummer RJ, et al. A breakfast with alpha-lactalbumin, gelatin, or gelatin + TRP lowers energy intake at lunch compared with a breakfast with casein, soy, whey, or whey-GMP. Clin Nutr. 2009; 28(2):147-55. http://dx.doi.org/10.1016/j.clnu.2008.12.003 11. Brylinsky C. Overview of nutrition diagnosis and
intervention. In: Mahan LK, Escott-Stump S, Raymond JL. Krause’s food, nutrition and diet therapy. 13th
ed. Philadelphia: WB Saunders Company; 2011. p.253-73.
12. Mackay D, Miller AL. Nutritional support for wound healing. Altern Med Rev. 2003; 8(4):359-77. 13. National Research Council. Guide for the care and
use of laboratory animals. 8th ed. Washington (DC):
National Academy Press; 2011.
14. Reeves PG, Nielsen FH, Fahey Jr. GC. AIN-93 purified diets for laboratory rodents: Final report of the American Institute of Nutrition ad hoc Writing Committee on the Reformulation of the AIN-76A rodent diet. J Nutr. 1993; 123(11):1939-51. 15. Merril AL, Watt BK. Energy value of foods: Basis and
17. Association of Official Analytical Chemists International. Official methods of analysis. 19th ed.
Arlington: AOAC; 2012.
18. Bligh EG, Dyer WJ. A rapid method of total lipid extraction and purification. Can J Biochem Physiol. 1959; 37(8):911-7. http://dx.doi.org/10.1139/o59-0 99
19. Pellett PL, Young VR. Nutritional evaluation of protein foods. Tokyo: The United Nations University; 1980.
20. Food and Agriculture Organization. Protein and amino acid requirements in human nutrition. Geneva: WHO; 2007. Technical Report Series, nº 935. 21. Rutherfurd SM, Montoya CA, Moughan PJ. Effect
of oxidation of dietary proteins with performic acid on true ileal amino acid digestibility as determined in the growing rat. J Agric Food Chem. 2014; 62(3):699-707. http://dx.doi.org/10.1021/jf403 146u
22. Castro IA, Tirapegui J, Silva RS. Protein mixtures and their nutritional properties optimized by response surface methodology. Nutr Res. 2000; 20(9):1341-53. http://dx.doi.org/10.1016/s0271-5 317(00)00209-8
23. Naves MMV, Ferreira CC, Freitas CS, Silva MS. Ava-liação da qualidade proteica de dois suplementos
alimentares em ratos Wistar. Aliment Nutr. 2006; 17(1):35-42.
24. Gietzen DW, Hao S, Anthony TG. Mechanisms of food intake repression in indispensable amino acid deficiency. Annu Rev Nutr. 2007; 27(1):63-78. doi: 10.1146/annurev.nutr.27.061406.093726 25. Friedman M. Nutritional value of proteins from
different food sources: A review. J Agric Food Chem. 1996; 44(1):6-29. http://dx.doi.org/10.1021/jf9 400167
26. Brody T. Protein. In: Brody T. Nutritional biochemistry. 2th ed. San Diego: Academic Press; 1998.
27. Matthews DM, Adibi SA. Peptide absorption. Gastroenterology. 1976; 71(1):151-61.
28. Silk DB, Grimble GK, Rees RG. Protein digestion and amino acid and peptide absorption. Proc Nutr Soc. 1985; 44(1):63-72.
29. Leite SN, Andrade TAM, Frade MAC, Jordão Júnior AA, Masson DS. Modelos experimentais de desnu-trição e sua influência no trofismo cutâneo. An Bras Dermatol. 2011; 86(4):681-8.