Ana Maria Conceição FerreiraI Salvador Massano CardosoII
I Departamento de Saúde Ambiental. Escola Superior de Tecnologia da Saúde de Coimbra. Coimbra, Portugal
II Instituto de Higiene e Medicina Social. Faculdade de Medicina. Universidade de Coimbra. Coimbra, Portugal
Correspondence:
Ana Maria da Conceição Ferreira Rua 5 de Outubro, São Martinho do Bispo 3000 Coimbra, Portugal
E-mail: [email protected] Received: 3/4/2013
Approved: 3/28/2013
Article available from: www.scielo.br/rsp
Exploratory study of air
quality in elementary schools,
Coimbra, Portugal
ABSTRACT
OBJECTIVE: To analyze the air quality in elementary schools and their structural and functional conditions.
METHODS: Air quality in 51 elementary schools (81 classrooms) in the city of Coimbra, Portugal, both inside and outside of the rooms was evaluated during the four seasons, from 2010 to 2011. Temperature (T°), relative humidity (Hr), concentrations of carbon monoxide (CO), carbon dioxide (CO2), ozone (O3), nitrogen dioxide (NO2), sulfur dioxide (SO2), compounds were evaluated, as were volatile organics (VOC), formaldehyde and particulate matter (PM10), from November 2010 to February 2011 (autumn/winter) and March 2011 to June 2011 (spring/summer). A grid characterizing the structural and functional conditions of the schools was created. The statistical Student t test for paired samples and the Wilcoxon t test were applied.
RESULTS: In 47 schools, the average CO2 concentrations were above the maximum reference concentration (984 ppm) mentioned in Portuguese legislation. The maximum concentration values found inside the rooms were critical, especially in the fall/winter (5,320 ppm). In some schools the average concentrations of VOC and PM10 within the maximum concentration exceeded the reference legislated. The values (risk) of CO, formaldehyde, NO2, SO2 and O3 detected were not relevant.
CONCLUSIONS: There was a higher concentration of pollutants inside the rooms compared with outside. Inadequate ventilation is associated with high CO2 concentration in the classroom.
The current and growing pattern of consumption has consequences for the environment which are,
inevi-tably, relected in human health. Air quality has implica
-tion for our well-being, it inluences our future and can
affect it. Interior air quality (IAQ) is one of the main environmental risks for public health and is especially
signiicant for vulnerable groups, such as children.a
The level of pollution in the air inside buildings is often
much worse than that outside and may reach igures from two to ive times, and occasionally up to one
hundred times, higher than the levels of pollution in the exterior. Levels of contamination of interior air become more relevant when we consider that individuals gener-ally spend around 80.0% to 90.0% of their time inside of buildings. Due to the complex and diverse func-tions carried out within schools, air quality becomes of great importance because of the adverse effects it can have on the occupants’ health, concentration and performance.8,9,13
The effects of air pollution on children has been increasingb due to their entering school at ever earlier
ages and spending more and more time there. One of the consequences of this is the increase in respiratory problems, namely the increase in prevalence of allergic rhinitis, bronchitis and asthma.6 Air quality in schools
is of great importance, as the children spend at least 1/3 of their time inside these buildings, i.e., around seven hours or more a day at school.2,11,c Poor IAQ can
affect performance, effort, comfort and productivity.3,5
The conditions inside the school buildings may affect the incidence of respiratory symptoms.7,9,15 There are
various studies on the quality of air quality inside schools.2,4,11,12,a However, there are few studies involving
this area in Portugal.
The aim of this study was to analyze air quality in elemen-tary schools and their structural and functional conditions.
METHODS
This was an exploratory study of IAQ, measuring temperature, relative air humidity and concentrations of carbon monoxide (CO), carbon dioxide (CO2), ozone (O3), nitrogen dioxide (NO2), sulphur dioxide (SO2), volatile organic compounds (VOC), formaldehyde
and articulate matter with a diameter between 2.5 μm INTRODUCTION
(PM2.5) and 10 μm (PM10), in autumn/winter and spring/ summer, in 51 elementary schools and 81 classrooms, Coimbra, Portugal, 2011. Coimbra is a municipality with around 143,052 inhabitants, subdivided into 31 prefectures, of which 15 are predominantly urban areas (PUA), 14 are moderately urban area (MUA) and two areas are predominantly rural (PRA).d Coimbra
was selected as it is one of the largest cities in central region and one of the most important in Portugal, due to its infrastructure, organization and companies, its historical importance and privileged geographical
posi-tion in the center of the country. This is the irst study
evaluating IAQ in schools in Coimbra. Elementary schools within the 31 prefectures of Concelho de Coimbra were assessed.
In total, 45 public and six private schools were analyzed, covering 81 classrooms (with a mean of 18 pupils), totaling 1019 children. These schools were selected based on comparative analysis of the 81 public and private schools (230 classrooms) in
Concelho de Coimbra.
It was decided to use a non-probabilistic convenience sample. The inclusion criteria were: one school per prefecture and, for the others, the above mentioned comparison criteria were used in the schools whose governors gave permission to participate in the study. If the parents/guardians did not give consent, this was an exclusion criteria.
It was not possible to evaluate biological parameters (due to lack of resources). Chemical and physical parameters inside and outside of 51 schools were evaluated. These evaluations were conducted in the autumn/winter (November 2010 to February 2011) and in spring/summer (March to June 2011).
A preliminary visit was made to educational establish-ments to assess overall conditions of facilities, type of activities taking place there, type of ventilation system and number of occupants and to identify potential sources of interior and exterior pollution. The sampling stations in the classrooms were decided, considering their layout, the location of doors and windows and the existence of sources of interior and exterior pollution. Quantifying the environmental parameters was based on recommendations described in the NT-SCE-02e and a Borrego C, Neuparth N, Carvalho AC, Carvalho A, Miranda AI, Costa AM, et al. A saúde e o ar que respiramos - um caso de estudo em Portugal. Lisboa: Fundação Calouste Gulbenkian; 2008.
b Khan I, Freitas MC, Dionisio I, Pacheco AMG. Indoor habits of children aged 5 to years learning at the public basic schools of Lisbon city, Portugal. Proceedings of the Ninth REHVA World Congress Clima - Well Being Indoors, Helsinki; 2007.
c Unites States Environmental Protection Agency (US). Managing Asthma in the School Environment – Indoor air quality tools for schools. Washington (DC); 2010 [cited 2012 Jul 20]. Available from: http://www.epa.gov/iaq/schools
d Portugal. Deliberação nº 2717/2009 de 6 de agosto. 8ª Deliberação da Secção Permanente de Coordenação Estatística. Revisão da tipologia de áreas urbanas. Diario Republica. 28 set 2009.
in the Portuguese Environmental Agency technical guide to air quality in interior spaces.f
The reference maximum concentrations (RMC) estab-lished in annex VII of Ordinance no. 79/2006, 4th April,g
on IAQ and in ordinance no. 80/2006, 4th April,h on
parameters of air temperature and relative humidity and international recommendations on Indoor Air Quality Association (IAQA)i and the American Society
of Heating, Refrigeration and Air – Conditioning Engineers, 2001 Standard 62.1.j
The Portuguese legislation does not set a limit for as PM2.5, SO2 or NO2 inside buildings. There are standards setting limits for exposure to NO2 in the workplace. The average values recorded in the analytical measurements of outdoor air were taken as a reference point. IAQ was measured during school hours, two hours after lessons started. The equipment was located at around pupils’ head height when seated. The sample was taken at a height of 1 m, at least 3 m from the walls, in representative measuring areas, so as to guarantee there was appropriate distance from the pupils them-selves, to ensure there was no interference in reading the instruments.
The measurements were taken according to the method established in the Technical Note NT-SCE-02, of the
National Certiication System, Portugal, 2009, between
10:30 a.m. and 5:30 p.m., over a 30 minute period, sampling each particulate every 30 seconds, volatile organic compoundsª every 15 seconds and the others every minute, for one week.k The measurements of
environmental air quality took place during break time, at the same height at which the IAQ measurements were taken, but at least 1m from the school’s exterior walls.k Speciic portable equipment (Table 1), calibrated before
each sampling period, was used to obtain real time readings, using the reset function whenever necessary, with a comparative base of results found in cases of measurements with exchanged sensors. Variations in temperature and air pressure were considered when converting the readings.
The data were analyzed using SPSS (Statistical Package for the Social Sciences), version 19.0. The data were subject to descriptive and inferential analysis. The
f Agência Portuguesa do Ambiente. Qualidade do ar em espaços interiores – um guia técnico. Lisboa; 2010 [cited 2010 Sep 27]. Available from: http://www.apambiente.pt/serviços/LaboratórioReferenvia/Documents/Manual%20QAI%20APA%20Maio%202010.
g Portugal. Decreto-Lei nº 79/2006 de 4 de Abril. Estabelece o Regulamento dos Sistemas Energéticos de Climatização em edifícios/RSECE.
Diario Republica. 4 abr 2006:2416-68.
h Portugal. Decreto-Lei nº 80/2006 de 4 de Abril. Estabelece a Norma Técnica NTSCE02-Metodologia para Auditorias periódicas de qualidade do ar interior em edifícios existentes no âmbito do RSECE. Diario Republica. 4 abr 2006.
i Indoor Air Quality Association. Quick Reference Guide to IAQA 01-2000. Recommended Guidelines for Indoor Environments. Washington (DC); 2000 [cited 2010 Sep 28]. Available from: http://americanhomeinspect.net/reference.html
j American National Standards Institute. American Society of Heating, Refrigerating and Air Conditioning Engineers. Standard 62.1 Ventilation for Acceptable Indoor Air Quality. Atlanta; 2004.
k Carvalho R, Coelho D, Ferreira C, Nunes T. A monitorização da Qualidade do Ar Interior (QAI) em Portugal - estudo comparativo de metodologias de amostragem e medição de QAI. Aveiro: Universidade de Aveiro; 2009.
mean, standard deviation and range of variation were calculated, with the minimum and maximum values in order to discover the quantitative variables. In some situations, after checking for normality (Kolmogorov-Smirnov and Shapiro-Wilk tests), parametric tests to evaluate differences between mean values were used. When the evaluation of asymmetry was not called into question, parametric measurements were applied. When they were very asymmetrical (> or < 1.96), non-para-metric statistical models were applied.
The Student’s-t test for paired samples and the Wilcoxon t test were used.
Statistical interpretation was conducted based on a 0.05
level of signiicance, with 95% conidence interval.
This study was approved by the Science Committee of the Faculty of Medicine, Universidade de Coimbra
(approved December 2010). All of those responsible in the schools signed consent forms.
RESULTS
The majority of the schools had central heating (86.3%), but not had air conditioning. None of the schools had any sort of ventilation system, and ventilation was achieved by opening doors and windows. Most of the classrooms (88.3%) were equipped with a blackboard
and chalk and had a wooden loor (80.4%). The mean
volume of the classrooms was 150 m3.
The environmental parameter with the most signiicant
results and high potential risk was that of CO2. Mean concentrations of CO2 inside the classrooms were above RMC (984 ppm), reaching 1,942 ppm. The maximum values found inside the classrooms placed the children’s health at risk, reaching 5,320 ppm in one school. CO2 concentrations inside the classrooms in autumn/winter were higher than the values in spring/summer. In two schools, the mean concentration of VOC exceeded RMC in both seasons. The RMC for particu-lates with a diameter of 10 μm (PM10) was exceeded in classrooms in four schools.
O3 concentrations were below RMC values. Those for
CO were signiicantly below the RMC (10.7 ppm). No
relevant values were found for NO2 or SO2.
Mean air temperature in autumn/winter were below the reference value (20ºC). The majority of schools
had insuficient heating, due to the age and size of
the buildings and the conditions of their insulation. The values for air temperature inside the schools, in spring/summer, were above the reference value (25ºC) due to the external temperature and the classrooms not having any air conditioning system. The values for rela-tive humidity were within the upper and lower limits in spring/summer and in autumn/winter (30.0% and 70.0%), except in seven schools, which had relative humidity above 70.0% in autumn/winter.
The atmospheric pollutants CO, CO2, O3 and formal-dehyde underwent marked changes between the two
seasons assessed. Signiicant alterations were also noted
between the seasons for certain atmospheric pollutants and particulates in classrooms of pupils in the fourth
year. Signiicant variations were also noted between
the two seasons when the classrooms used by pupils
in the irst and fourth years together (all in the same
classroom) (Table 2).
CO, CO2, PM2,5, PM10 and formaldehyde were those
which underwent signiicant changes in the mean in
the exterior areas of the different schools.
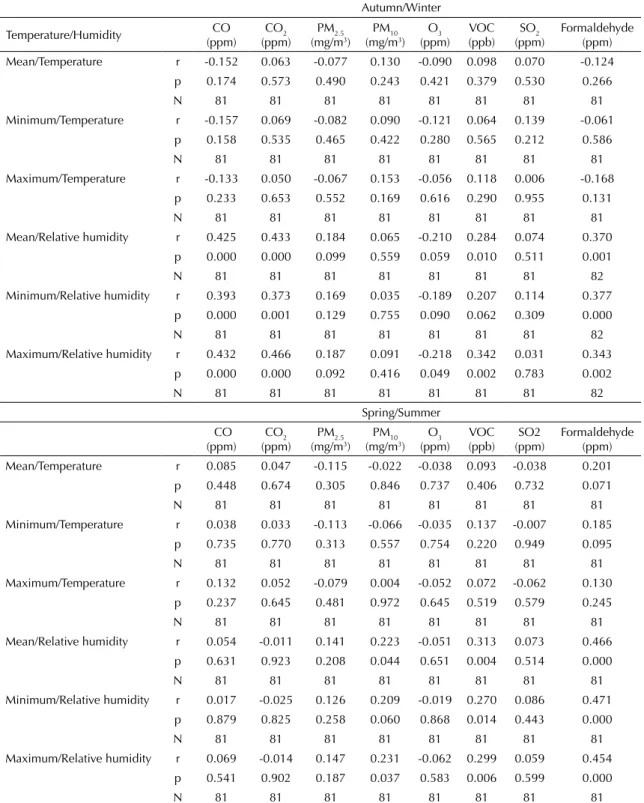
A pattern of correlation was observed between the mean relative humidity in autumn/winter and CO, CO2, VOC and formaldehyde (Table 3), as well as patterns of variation between relative humidity and PM10, VOC and formaldehyde in spring/summer.
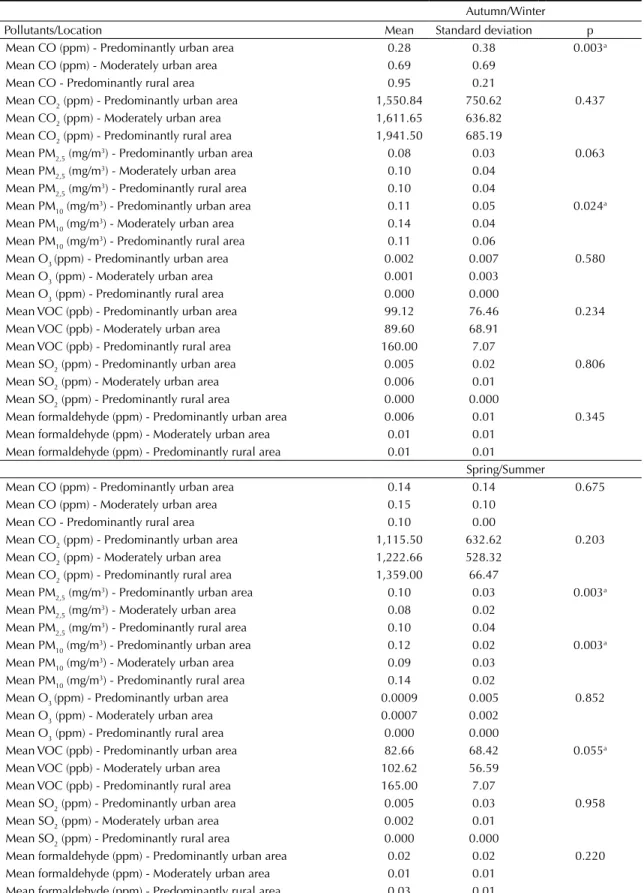
When the Kruskal Wallis test was used to compare distribution of environmental parameters by geograph-ical area, it was noted that there were statistgeograph-ically
signiicant differences (p < 0.05) in concentrations of
CO inside the classrooms in autumn/winter. On average, schools located in predominantly rural areas had higher values than those in moderately or predominantly urban areas. PM10 showed higher mean values in schools located in moderately urban areas (p < 0.05). Although
Table 1. Parameters evaluated, equipment and monitoring methods used,a Coimbra, Portugal, 2011.
Environmental parameter Equipment Monitoring method I.M.b
Method/Reference principlec
Method/Equivalent principled Evaluation of air velocity DELTA OHM -
HD32.1 Evaluation of relative
humidity
TSI 9555-P Electrochemical sensor Evaluation of the air
temperature
TSI 9555-P Electrochemical sensor Evaluation of CO2
concentrations
TSI 9555-P NDIR sensor NDIR Electrochemical method; Infra Red Evaluation of CO
concentrations
TSI 9555-P NDIR sensor NDIR Electrochemical method; Infra Red Evaluation of O3
concentrations
AEROQUAL 500 series
Electrochemical sensor
Ultra Violet Absorption Electrochemical method
Evaluation of VOC concentrations
PHOTOVAC 220ppb Pro
Photoionization detector
Collection and analysis by ISO 16000 – 2007
chromatography
PID Photo-Ionization Detector; PAS-Sensor photo Acoustic Evaluation of NO2 and SO2 QRAE Plus
PGM-2000/2020
Evaluation of the concentration of airborne particles
TSI DUSTTRACK Laser particle quantifier
Gravimetric method with selective PM10
sampling head
Optical dispersion (UV, Laser); Beta Radiation
Absorption
Evaluation of formaldehyde
PPM formaldmeter Electrochemical sensor
Collection and analysis by ISO 16000-2:2006
chromatography
Electrochemical method; Photometry method NDIR: Non dispersive infra red
a This table took into consideration annex III of NT_SCE_02 consisting of monitoring methods b Internal Method according to NT_SCE_02 (Principle Reference principle or equivalent principle).
c Method/Reference Principle. Method established by national, EU or international legislation (e.g., ISO) for measuring a specific pollutant of ambient air. The CEN (EN-ISO) methods are considered reference methods.
the differences are not statistically signiicant, schools
located in predominantly rural areas had higher CO2 and VOC values. Concentrations of PM2.5 and form-aldehyde were similar, and higher, in schools located in predominantly rural or moderately urban areas. The highest O3 values were in schools located in predomi-nantly urban areas, and those for SO2 in moderately urban areas (Table 4).
There were statistically significant differences in the mean concentrations of PM2.5, PM10 and VOC I spring/summer. Concentrations of VOC and PM10 were higher in schools located in predominantly rural areas. Mean concentrations of PM2.5 were similar, and high, in schools located in predominantly rural and predominantly urban areas. O3 values were highest in schools located in predominantly urban areas, as were SO2 values. Formaldehyde and CO2 had higher mean concentrations in schools located in predominantly rural areas. Schools in moderately urban areas had the highest mean values for CO.
DISCUSSION
The most signiicant results of this study are those
referring to CO2 concentrations, which were above the legislated maximum in most of the schools (92.0%). As the only source of this contamination in the classrooms was the occupants’ metabolism, the level was used as an indicator of the degree of vitiation in the indoor environment, providing an indication of IAQ.
The results found for autumn/winter show higher levels of CO2 than in spring/summer. The classrooms in which doors and windows are habitually open during lessons had better values and had lower number of students (< 10). CO2 is the main indicator of air renewal inside classrooms which exceed the reference value (984 ppm). The volume of the classrooms, associated with the number of occupants, means that it is not possible for the airing during break times to lower CO2 levels to an acceptable value. Some classrooms have the windows open during the lessons. However, this practice is not always possible, given noise levels outside, or when weather conditions, e.g., cold or rain,
Table 2. Distribution ofvalues of mean concentrations of pollutants according to location evaluated. Coimbra, Portugal, 2011.
Environmental parameter
Location
Classrooms Outside
1st grade (n = 35) 4th grade (n = 34) 1st and 4th grade
together (n = 12) (n = 51)
Mean sd Mean sd Mean sd Mean sd
CO (ppm) - autumn/winter 0.44b 0.627 0.39b 0.445 0.45a 0.433 0.33a 0.329 CO (ppm) - spring/summer 0.15 0.107 0.15 0.159 0.12 0.075 0.21 0.194 CO2 (ppm) - autumn/winter 1,575.17b 791.251 1,632.64a 707.493 1,414.64b 422.946 425.16c 33.779 CO2 (ppm) - spring/summer 1,080.94 642.457 1,282.23 602.939 976.18 281.810 402.71 27.091 PM2,5 (mg/m3) - autumn/winter 0.09 0.039 0.08a 0.031 0.08 0.034 0.07b 0.028
PM2,5 (mg/m3) - spring/summer 0.09 0.026 0.10 0.025 0.07 0.023 0.09 0.028 PM10 (mg/m3) - autumn/winter 0.13 0.054 0.11 0.040 0.11 0.035 0.08c 0.033 PM10 (mg/m3) - spring/summer 0.11 0.026 0.11 0.025 0.10 0.024 0.12 0.059 O3 (ppm) - autumn/winter 0.00a 0.005 0.00 0.008 0.00 0.000 1.29 8.956
O3 (ppm) - spring/summer 0.00 0.001 0.00 0.007 0.00 0.004 0.03 0.024 VOC (ppb) - autumn/winter 97.85 74.382 96.41 73.818 102.23 78.143 31.28 73.567 VOC (ppb) - spring/summer 89.44 68.258 92.46 65.567 87.82 63.043 45.27 50.046 SO2 (ppm) - autumn/winter 0.01 0.022 0.00 0.014 0.00 0.000 0.00 0.010 SO2 (ppm) - spring/summer 0.01 0.037 0.00 0.000 0.00 0.000 0.00 0.014
Formaldehyde (ppm) - autumn/ winter
0.01a 0.016 0.01a 0.009 0.01a 0.008 0.00c 0.003
Formaldehyde (ppm) - spring/ summer
0.02 0.019 0.02 0.014 0.02 0.014 0.01 0.008
O3: Ozone; Tº: Temperature; Rh: Relative humidity; NO2: Nitrogen dioxide; SO2: Sulfur dioxide; VOC: Volatile organic compounds; PM10: particulates with diameter < 10 ug; PM2.5: particulates with diameter < 2.5 ug;
The NO2 parameter was not shown as there was no significant quantity in any of the locations evaluated Student t-test for paired samples; Wilcoxon t testa p < 0.05
make it impossible. Airing during the night would be good practice (except in cold periods), but the schools reported that this was not possible for motives of secu-rity. Recent studies, including some in Portugal,3,13 have
indicated the existence of high levels of CO2 in schools,
due to high density of occupation and insuficient venti -lation.1,10 High levels of CO
2 were associated with high
levels of other pollutants.12
Table 3. Variation of air pollutants as a function of temperature and relative humidity in autumn/winter and spring/summer. Coimbra, Portugal, 2011.
Autumn/Winter
Temperature/Humidity CO (ppm)
CO2 (ppm)
PM2.5 (mg/m3)
PM10 (mg/m3)
O3 (ppm)
VOC (ppb)
SO2 (ppm)
Formaldehyde (ppm) Mean/Temperature r -0.152 0.063 -0.077 0.130 -0.090 0.098 0.070 -0.124 p 0.174 0.573 0.490 0.243 0.421 0.379 0.530 0.266
N 81 81 81 81 81 81 81 81
Minimum/Temperature r -0.157 0.069 -0.082 0.090 -0.121 0.064 0.139 -0.061 p 0.158 0.535 0.465 0.422 0.280 0.565 0.212 0.586
N 81 81 81 81 81 81 81 81
Maximum/Temperature r -0.133 0.050 -0.067 0.153 -0.056 0.118 0.006 -0.168 p 0.233 0.653 0.552 0.169 0.616 0.290 0.955 0.131
N 81 81 81 81 81 81 81 81
Mean/Relative humidity r 0.425 0.433 0.184 0.065 -0.210 0.284 0.074 0.370 p 0.000 0.000 0.099 0.559 0.059 0.010 0.511 0.001
N 81 81 81 81 81 81 81 82
Minimum/Relative humidity r 0.393 0.373 0.169 0.035 -0.189 0.207 0.114 0.377 p 0.000 0.001 0.129 0.755 0.090 0.062 0.309 0.000
N 81 81 81 81 81 81 81 82
Maximum/Relative humidity r 0.432 0.466 0.187 0.091 -0.218 0.342 0.031 0.343 p 0.000 0.000 0.092 0.416 0.049 0.002 0.783 0.002
N 81 81 81 81 81 81 81 82
Spring/Summer CO
(ppm) CO2 (ppm)
PM2.5 (mg/m3)
PM10 (mg/m3)
O3 (ppm)
VOC (ppb)
SO2 (ppm)
Formaldehyde (ppm) Mean/Temperature r 0.085 0.047 -0.115 -0.022 -0.038 0.093 -0.038 0.201 p 0.448 0.674 0.305 0.846 0.737 0.406 0.732 0.071
N 81 81 81 81 81 81 81 81
Minimum/Temperature r 0.038 0.033 -0.113 -0.066 -0.035 0.137 -0.007 0.185 p 0.735 0.770 0.313 0.557 0.754 0.220 0.949 0.095
N 81 81 81 81 81 81 81 81
Maximum/Temperature r 0.132 0.052 -0.079 0.004 -0.052 0.072 -0.062 0.130 p 0.237 0.645 0.481 0.972 0.645 0.519 0.579 0.245
N 81 81 81 81 81 81 81 81
Mean/Relative humidity r 0.054 -0.011 0.141 0.223 -0.051 0.313 0.073 0.466 p 0.631 0.923 0.208 0.044 0.651 0.004 0.514 0.000
N 81 81 81 81 81 81 81 81
Minimum/Relative humidity r 0.017 -0.025 0.126 0.209 -0.019 0.270 0.086 0.471 p 0.879 0.825 0.258 0.060 0.868 0.014 0.443 0.000
N 81 81 81 81 81 81 81 81
Maximum/Relative humidity r 0.069 -0.014 0.147 0.231 -0.062 0.299 0.059 0.454 p 0.541 0.902 0.187 0.037 0.583 0.006 0.599 0.000
N 81 81 81 81 81 81 81 81
Table 4. Variation of air pollutants as a function of temperature and relative humidity in autumn/winter and spring/summer. Coimbra, Portugal, 2011.
Autumn/Winter
Pollutants/Location Mean Standard deviation p
Mean CO (ppm) - Predominantly urban area 0.28 0.38 0.003a Mean CO (ppm) - Moderately urban area 0.69 0.69
Mean CO - Predominantly rural area 0.95 0.21
Mean CO2 (ppm) - Predominantly urban area 1,550.84 750.62 0.437 Mean CO2 (ppm) - Moderately urban area 1,611.65 636.82
Mean CO2 (ppm) - Predominantly rural area 1,941.50 685.19
Mean PM2,5 (mg/m3) - Predominantly urban area 0.08 0.03 0.063 Mean PM2,5 (mg/m3) - Moderately urban area 0.10 0.04
Mean PM2,5 (mg/m3) - Predominantly rural area 0.10 0.04 Mean PM10 (mg/m
3) - Predominantly urban area 0.11 0.05 0.024a
Mean PM10 (mg/m3) - Moderately urban area 0.14 0.04 Mean PM10 (mg/m3) - Predominantly rural area 0.11 0.06
Mean O3 (ppm) - Predominantly urban area 0.002 0.007 0.580 Mean O3 (ppm) - Moderately urban area 0.001 0.003
Mean O3 (ppm) - Predominantly rural area 0.000 0.000
Mean VOC (ppb) - Predominantly urban area 99.12 76.46 0.234 Mean VOC (ppb) - Moderately urban area 89.60 68.91
Mean VOC (ppb) - Predominantly rural area 160.00 7.07
Mean SO2 (ppm) - Predominantly urban area 0.005 0.02 0.806 Mean SO2 (ppm) - Moderately urban area 0.006 0.01
Mean SO2 (ppm) - Predominantly rural area 0.000 0.000
Mean formaldehyde (ppm) - Predominantly urban area 0.006 0.01 0.345 Mean formaldehyde (ppm) - Moderately urban area 0.01 0.01
Mean formaldehyde (ppm) - Predominantly rural area 0.01 0.01 Spring/Summer
Mean CO (ppm) - Predominantly urban area 0.14 0.14 0.675 Mean CO (ppm) - Moderately urban area 0.15 0.10
Mean CO - Predominantly rural area 0.10 0.00
Mean CO2 (ppm) - Predominantly urban area 1,115.50 632.62 0.203 Mean CO2 (ppm) - Moderately urban area 1,222.66 528.32
Mean CO2 (ppm) - Predominantly rural area 1,359.00 66.47
Mean PM2,5 (mg/m3) - Predominantly urban area 0.10 0.03 0.003a Mean PM2,5 (mg/m3) - Moderately urban area 0.08 0.02
Mean PM2,5 (mg/m3) - Predominantly rural area 0.10 0.04 Mean PM10 (mg/m
3) - Predominantly urban area 0.12 0.02 0.003a
Mean PM10 (mg/m3) - Moderately urban area 0.09 0.03 Mean PM10 (mg/m
3) - Predominantly rural area 0.14 0.02
Mean O3 (ppm) - Predominantly urban area 0.0009 0.005 0.852 Mean O3 (ppm) - Moderately urban area 0.0007 0.002
Mean O3 (ppm) - Predominantly rural area 0.000 0.000
Mean VOC (ppb) - Predominantly urban area 82.66 68.42 0.055a Mean VOC (ppb) - Moderately urban area 102.62 56.59
Mean VOC (ppb) - Predominantly rural area 165.00 7.07
Mean SO2 (ppm) - Predominantly urban area 0.005 0.03 0.958 Mean SO2 (ppm) - Moderately urban area 0.002 0.01
Mean SO2 (ppm) - Predominantly rural area 0.000 0.000
Mean formaldehyde (ppm) - Predominantly urban area 0.02 0.02 0.220 Mean formaldehyde (ppm) - Moderately urban area 0.01 0.01
Mean formaldehyde (ppm) - Predominantly rural area 0.03 0.01
O3: Ozone; Tº: Temperature; Rh: Relative humidity; NO2: Nitrogen dioxide; SO2: Sulfur Dioxide; VOC: Volatile organic compounds; PM10: particulates with diameter < 10 ug; PM2.5: particulates with diameter < 2.5 ug
In this study, the values found were below the reference value, with the exception of CO2, however, the values for some of the environmental parameters analyzed, such as CO and PM10 were signiicant.
Levels of particulate matter above the legislated values were found. The majority of classrooms were equipped with blackboards and chalk and had shelves or cupboards containing large quantities of stored paper, which accumulated dust. Countless activities take place inside the classrooms, often requiring mats, glue, paint, clay and other materials and, according to the results found by Almeida et al3 (2011) and Pegas et al13 (2012),
children’s activities themselves contribute to increasing the particles in the atmosphere.
The VOC values found, although signiicant, were
below the RMC. There are many possible sources, from glue and paints and all sorts of organic based compounds present in the classrooms.
The CO values found were below the RMC, in both autumn/winter and spring/summer. On average, schools located in predominantly rural areas had higher values of CO compared with those located in areas that were moderately or predominantly urban. The highest value found in autumn/winter was in a school in which there was a noticeable smell of smoke from a stove without a chimney, indicating a problem with extracting smoke from the classrooms.
O3 and formaldehyde levels were below the RMC. Some classrooms had higher levels, although no sources of contamination were perceptible (Table 2).
Two classrooms had signiicant values, although below
the RMC, for formaldehyde in autumn/winter. In these classrooms, the pupils had been working with glue in the previous lesson, demonstrating a lack of airing and ventilation in the classroom during this type of activity.
One school had signiicant values for formaldehyde in
spring/summer, without any handicraft activities having taken place previously.
Values for NO2 and SO2 mean air temperature in autumn/winter was above the reference limit established in Ordinance no. 80/2006 (20ºC). This is probably because all of the classrooms had heating systems and the doors and windows remained closed. Air tempera-ture values were below the reference value in spring/ summer, except for two schools where temperatures higher than the reference (25ºC) were found. Seven schools had values for relative humidity of > 70.0% in the autumn/winter. Diverse sources of contaminants were found inside the buildings. They may originate in the occupants, their activities, construction and
decoration materials or from air outside entering the building. Thermo-hygrometric conditions are impor-tant in guaranteeing a healthy environment. As well as affecting comfort, temperature and humidity affect the emission of chemical pollutants from existing sources of contamination.l
Poor IAQ over short periods (hours) may lead to discomfort, decreased attention and diminished learning capacity. However, prolonged exposure (days and weeks) to interior air pollutants may lead to serious health problems, such as respiratory disease or allergies. The majority of schools studied were old buildings that had not been restored in a long time. Their constructive aspects were cared for, there was a lack of air condi-tioning systems and a lack of mechanical or mixed ventilation, this generally being achieved by opening doors and windows. Especially high levels of CO2 were measured in the interior environment, showing
the deiciencies in IAQ due to insuficient ventilation.
Concentrations of pollutants in the air inside the class-rooms were higher than those observed outside,
indi-cating the signiicance of interior sources of emission.
It is essential that the schools continually monitor this situation so as to avoid exposing the pupils to risk. It is also important to improve airing systems, to make
them more effective and eficient. The behavior and
attitudes of the buildings’ occupants also needs to be
modiied, e.g., developing the simple habit of opening
the windows frequently.
Currently, there is debate on restructuring within schools, above all, increasing the numbers of pupils per class. Considering that CO2 is essentially the result of the metabolism of living beings, decision makers concerned in this policy should perceive that, if the classrooms become fuller, levels of CO2 and, conse-quently, health problems, will increase.
Efforts to develop methodologies of the determining and conditioning factors of air pollutants that affect
human health need to be intensiied, creating effec -tive tools in the public health area and contributing to drawing up policies aimed at improving air quality. Similarly, control and prevention programs concerning the consequences for the health of the occupants of these environments need to be established.
Developing other studies to evaluate the impact of air pollutants on the population’s health should be encouraged so as to contribute to adequate measuring of environmental health within buildings.
1. Al-Rashidi K, Loveday D, Al-Mutawa N. Impact of ventilation modes on carbon dioxide concentration levels in Kuwait classrooms. Energy Build. 2012; 47:540-9. DOI:10.1016/j.enbuild.2011.12.030
2. Almeida SM, Canha N, Silva A, Freitas MC, Pegas P, Alves C, et al. Children exposure to air particulate matter in indoor of Lisbon primary schools.
Atmos Environ. 2010;45:7594-9.
DOI:10.1016/j.atmosenv.2010.11.052
3. Daisey JM, Angell WJ, Apte MG. Indoor air quality, ventilation and health symptoms in schools: an analysis of existing information. Indoor Air. 2003;13 (1):53-64. DOI:10.1034/j.1600-0668.2003.00153.
4. Freitas MC, Canha N, Martinho M, Silva M, Almeida S, Pegas P, et al. Indoor Air quality in primary schools. In: Modoveanu A, editor. Advanced topics in environmental and air pollution case studies. Rijeka: InTech Europe; 2011. p. 361-84.
5. Godoi RHM, Avigo DJ, Campos VP, Tavares TM, Marchi MRR, Grieken R, et al. Indoor air quality assessment of elementary schools in Curitiba, Brazil.
Water Air Soil Pollut Focus. 2009;9(3-4):171-7.
DOI:10.1007/s11267-009-9220-3
6. International Study of Asthma and Allergies in Childhood. Worldwide variation in prevalence of symptoms of asthma, allergic rhinoconjunctivitis, and atopic eczema: ISAAC. The International Study of Asthma and Allergies in Childhood (ISAAC) Steering Committee. Lancet. 1998;351(9111):1225-32. DOI:10.1016/S0140-6736(97)07302-9
7. Kim JL, Elfman L, Mi Y, Johansson M, Smedje G, Norback D. Current asthma and respiratory symptoms among pupils in relation to dietary factors and allergens in the school environment. Indoor Air. 2005;15(3):170-82. DOI:10.1111/j.1600-0668.2005.00334.x
8. Kotzias D, Geiss O, Tirendi S, Barrero-Moreno J, Reina V, Gotti A. Exposure to multiple air contaminants in public buildings, schools and kindergartens -
The European Indoor Air Monitoring and Exposure Assessment Study (AIRMEX). Fresenius Environ Bull.
2009;18(5):670-81.
9. Mendell M, Heath G. Do indoor pollutants and thermal conditions in schools influence student performance? A critical review of the literature. Indoor Air. 2005;15(1):27-52. DOI:10.1111/j.1600-0668.2004.00320.x
10. Mumovic D, Palmer J, Davies M, Orme M, Ridley I, Oreszczyn T, et al. Winter indoor air quality, termal confort and acoustic performance of newly built schools in England. Build Environ. 2009;44(7):1466-77. DOI: 10.1016/j.buildenv.2008.06.014
11. Pegas PN, Evtyugina MG, Alves CA, Nunes T, Cerqueira M, Franchi M, et al. Outdoor/ Indoor air quality in primary schools in Lisbon: a preliminary study. Quim Nova. 2010;33(5):1145-9. DOI:10.1590/S0100-40422010000500027
12. Pegas PN, Alves CA, Evtyugina MG, Nunes T, Cerqueira M, Franchi M, et al. Seasonal evaluation of outdoor/indoor air quality in primary schools in Lisbon. J EnvironMonit. 2011;13(3):657-67. DOI:10.1039/c0em00472c
13. Pegas PN, Nunes T, Alves CA, Silva JR, Vieira SLA, Caseiro A, et al. Indoor and outdoor
characterisation of organic and inorganic compounds in city centre and suburban elementar schools of Aveiro, Portugal. Atmos Environ. 2012;55:80-9. DOI:10.1016/j.atmosenv.2012.03.059
14. Shusterman D, Murphy MA. Nasal hyperreactivity in allergic and non-allergic rhinitis: a potential risk factor for non-specific building-related illness. Indoor Air. 2007;17(4):328-33. DOI:10.1111/j.1600-0668.2007.00482.x
15. Sundell J. On the history of indoor air quality and health. Indoor Air. 2004. 14 Suppl7:51-8. DOI:10.1111/j.1600-0668.2004.00273.x REFERENCES