Personal Pension Plans in Spain?
Yaiza García Padrón
∗
, Juan García Boza
†
Contents: 1. Introduction; 2. Literature Review; 3. Sample description; 4. Testing Methodology; 5. Em-pirical results of testing the APT model; 6. Test of the model suggested by Chen et al. (1986); 7. Conclu-sions.
The aim of this paper is to analyse if the Arbirtrage Pricing Theory or the model suggested by Chen et al. (1986) can efficiently explain the variability of the cross-sectional returns on the Personal Pension Plans in Spain between 1995-2003, as well as to find their sources of risks. To test both models we have followed the traditional two-step cross-sectional re-gressions by Fama and MacBeth (1973). The results of our analysis show two significant risk factors derived from the fixed-income market: non-anticipated changes in the interest rate term structure and the default risk premium.
Este artigo analisa se o modelo APT ou o modelo sugerido por Chen et al. (1986) podem explicar de maneira eficiente a variabilidade dos rendimentos de seção cruzada dos Planos de Pensões do Sistema Individual em Espanha durante 1995-2003, bem como determina quais são seus fatores de risco. A metodologia de contraste utilizada foi a proposta por Fama and MacBeth (1973) na versão de múltiplas variáveis explicativas. Os resultados da análise mostram dois fa-tores de risco relevantes derivados do mercado de renda fixa: mudanças não antecipadas na estrutura temporária da taxa de juros e prima por risco de in-solvência.
Keywords: Personal Pension Plans; multifactor pricing models; APT; macroeconomic variables; risk factors; fixed-income market.
JEL Code:E44; G12.
1. INTRODUCTION
The wide criticism about the CAPM and the lack of unanimity shown by many studies related to it have led many authors to analyse and test a multifactor perspective of pricing models, in which there is not a single source of risk, but multiple. Their aim is to determine whether these models include, to a larger extent, risk factors related to portfolio or asset returns.
In this context, we have carried out the present study from a multifactor risk perspective and we have analysed multifactor pricing models in order to determine whether these models explain effi-ciently changes in cross-sectional returns on Personal Pension Plans in Spain and also to determine the risk factors relevant to their pricing.
In this line and as an alternative to the single-factor model, Ross (1976) created the APT model, lately developed and extended by Roll and Ross (1980). The APT proposes that changes in any asset returns are related to systematic risk factors present in economy. Thus, the first empirical studies on APT have considered unobserved factors extracted from analysing asset returns through statistical techniques. On this basis, firstly, we have tested the validity of the APT model with unobserved factors for pricing Personal Pension Plans in Spain during the test period between 1995 and 2003 and we have identified the significant risk factors.
Moreover, other studies have also analysed a multifactor model, but with pre-specified variables, taking certain macroeconomic variables as possible systematic risk factors in asset returns. Therefore, in a second place and following this perspective, we have tested whether the model proposed by Chen et al. (1986) with five macroeconomic variables and the extended model, that includes the market return variable, offers a better approximation to risk factors in the pricing of Personal Pension Plans.
Our study has been structured in seven sections. After the introduction, in the second section, we have made a literature review regarding the application of multifactor models in asset pricing with unknown factors and macroeconomic variables. In the third section, we have described the sample and, in the fourth section, the applied testing methodology. In the fifth and sixth sections, we have shown the results obtained from testing the APT model and the model by Chen et al. (1986) respectively. Finally, in the seventh section, we have summarised our conclusions.
2. LITERATURE REVIEW
We can distinguish two different lines in the multifactor studies of financial asset pricing with systematic risk factors.
On the one hand, the studies which test the APT model proposed by Ross (1976), and which use not pre-specified factors as explanatory variables extracted from statistical procedure.
On the other hand, studies that use pre-specified variables as explanatory factors, mainly of macroeconomic nature.
the number of factors remains invariable and non-dependant on data periodicity and they have also pointed out that there is one or rather two significant factors.
It is important to point out that there is no unanimity in relation to the authors who have accepted or not the APT model in their different tests. Thus, the results obtained by Reinganum (1981, p. 319-320) did not seem to support the APT model. Likewise, Abeysekera and Mahajan (1987, p. 388) did not obtain any significant risk premium when testing the APT model in the London Stock Market. However, Chen (1983, p. 1393,1397) gave evidence of the APT model and opposed to Reinganum (1981)’s proposal, verifying that in the USA market the APT model remains strong to inclusion of firm size and own variance, as these two variables did not show additional explanatory value. Besides, Bower et al. (1984, p. 1041) have observe in the same market that the APT model offers a better sign of risk and also better estimates of the expected return than a single-factor model. Lehmann and Modest (1988, p. 251-253) have analysed that in the USA market the APT model prices with a small error most of the stocks.
In relation to studies that have applied the APT model in Spain, we have also observed diverse results. Thus, Bergés (1984, p. 114,156) has found that stock returns in the Stock Markets of Spain, USA and Canada behave consistently with the APT model, whereas no significant factors have been observed in the London Stock Market. However, Gómez-Bezares et al. (1994, p. 161) have found only a single significant risk factor: the market return. Jordán and García (2003, p. 33) have only accepted the APT model on Equity Mutual Funds, and have only identified some factors with the market portfolio and non-anticipated changes in the default risk premium.
As we can see, there are many authors who have based their studies in analysing and testing the APT model exclusively, while others have tried to discover the economic nature of the significant factors, trying to identify them. Among the last group, we should point out Beenstock and Chan (1988)’s study and Cheng (1995)’s study for the London Stock Market; Gómez-Bezares et al. (1994)’s study for the Spanish Stock Exchange; Esteve (1996)’s and Jordán and García (2003)’s research for the Mutual Funds in Spain and Zhou (1999)’s study for the USA Stock Market.
The current controversy in relation to testing the APT model with non-observed factors to make a correct identification of such factors has led many authors to analyse a model with pre-specified macroeconomic variables. In this sense, we should point out Chen et al. (1986)’s study, which are the basis for new research applying the APT model with macroeconomic variables. Chen et al. (1986, p. 393-394,402) have specified some economic and financial variables, which convey systematic risk in the economy. After analysing them, they have tested whether these variables (monthly variation of industrial production, default risk premium, non-anticipated changes in the interest rate term structure, changes in expected inflation and unexpected inflation) can be considered as systematic risk factors in the stock pricing of the New York Stock Exchange. Likewise, they have also tested the model including, as a sixth variable, the market portfolio return estimated by means of a stock index, and the results remained the same. This study unveils that the three first variables mentioned before are significant risk factors in the stock pricing, while the variables related to inflation show weak significance. Bearing this in mind, the mentioned authors have concluded that stock returns are exposed to systematic economic news and are valued according to them.
Following this line, Burmeister and Wall (1986, p. 9,12) have found that stock values in the USA market are sensitive to each of these variables: default risk premium, non-anticipated changes in the interest rate term structure, unexpected inflation and unexpected grow in final real sales. These vari-ables showed significant coefficients. However, Shanken and Weinstein (1990, p. 1), when reproducing Chen et al. (1986)’s paper have observed that the only significant risk premium is the industrial produc-tion.
available when economic expectations arise. Taking all of this into account, they have affirmed that the incorrect use of final data in the empirical tests could convey errors concerning the real significance of the economic news. Bin et al. (2003, p. 241) have discovered that the ADR return in the USA is sensitive to Stock Market turnovers in the corresponding foreign exchange and money markets and, finally, to international financial crises.
Besides, the pricing model with pre-specified macroeconomic variables has not only been tested in the USA market, but in others. Therefore, we should mention the papers of Priestley (1996), Clare et al. (1997) and Antoniou et al. (1998) for the London Stock Market; Koutoulas and Kryzanowski (1996)’s for Canada; Clare and Priestley (1998)’s for Malaysia; Swoboda (2003)’s for the Stock Market of Buenos Aires, and Altay (2003)’s study for the German and Turkish Stock Markets.
Regarding the different studies carried out in Spain, we should mention Araguas (1991, p. 528-529), who has observed that the economic sector sensibilities to industrial production, non-anticipated infla-tion, interest rate term structure and the default risk premium are coherent despite their small statistic significance. Another author, Rodríguez (2000, p. 20-22), has shown that for the fixed income Mutual Funds in Spain the following variables are significant: the risk premium associated to the variable non-anticipated changes in the interest rate term structure and the return premium of the general index of the Stock Exchange of Madrid over the return of Government Bonds.
3. SAMPLE DESCRIPTION
In order to carry out the different analyses in this study, we have used the monthly return on Personal Pension Plans in Spain with a non-void equity security portfolio between 1995 and 2003. Data referring to liquidating value of Spanish Personal Pension Plans were obtained from information offered by theAsociación de Instituciones de Inversión Colectiva y Fondos de Pensiones(Association of Collective Investment Institutions and Pension Funds)1.
The analysed sample is made of the set of Personal Pension Plans that have been kept throughout the whole period, belonging to different Funds. This way, the sample is composed for 87 Personal Pension Plans (17 equity and mixed equity Plans, 36 type II mixed fixed income Plans and 34 type I mixed fixed income Plans).
We have detailed the main variables taken as possible risk factors in this study, including their definition and the sources of the data we have used. They are the following:
• The real inflation has been obtained from the monthly variation expressed by units of the Retail Price Index (RPI). The chosen series is based in the year 2001 and was published by the Statistical Bulletin of the Bank of Spain.
• Changes in the expected inflation corresponding to the t-month have been calculated by the difference between the expected inflation2 in the mentioned t-month and the corresponding to
the previous t-1 month.
• The unexpected inflation in a certain t-month is determined as the difference between the real inflation and the expected inflation, both related to the t-month.
• Non-anticipated changes in the interest rate term structure are obtained through the difference between interest rates of long-term Government Bonds and up-to-three month Treasury Bills. Both series have been taken from the Statistical Bulletin of the Bank of Spain.
• The default risk premium has been calculated as the difference between the return on corporate debt and long-term Government Bonds. The corporate debt is approximated through the interest rate of corporate bonds over two years, negotiated in the AIAF market (Spanish fixed-income market). Both series have been extracted from the Statistical Bulletin of the Bank of Spain.
• The interest rate of repo operations on Treasury Bills to 3 and 6 months has been taken from the Statistical Bulletin of the Bank of Spain.
• The interest rate of repo operations on bonds to 1 and 6 months has been extracted from the Statistical Bulletin of the Bank of Spain.
• The monthly variation expressed in units of the Industrial Production Index (IPI). The selected series is based in the year 2000, and the Spanish Statistics National Institute, from which we have taken it, has corrected its calendar-effect.
• The monthly variation expressed in units of the Brent oil spot FOB price for Europe, published by the U.S. Department of Energy.
• Variation of the exchange rate between the euro and the dollar, measured through the Napierian coefficient logarithm between the exchange rate at the end of the t-month and the corresponding to the end of the previous t-1 month. This series has been taken from the Statistical Bulletin of the Bank of Spain.
• In addition to the mentioned macroeconomic variables, we have used as proxies of the market portfolio return the simple variation of the following indices: Madrid Stock Exchange General Index (IGBM) and the continuous Stock Market index IBEX-35.
4. TESTING METHODOLOGY
In order to test the APT model and the model proposed by Chen et al. (1986) we have followed the two-step methodology proposed by Fama and MacBeth (1973). In the first step, we have estimated Personal Pension Plan betas or sensibilities to systematic risk factors.
The regression equation to make is the following:
rit−RF t=αi+ K
j=1
βji.Fjt+ǫit
Whererit, RF t, Fjt andβji are respectively thei-Personal Pension Plan return in thet-time (t -month), the monthly interest rate of up-to three month Treasury Bill in the t-time, the value of the explanatory j-factor in the t-time and the i-sensibility of the Personal Pension Plan to the j-factor. These regressions are made for each month, using data corresponding to the 60 previous months and the method of Estimates Ordinary Least Square.
In the second step, we have tested the mentioned model through the adjustment of the Personal Pension Plan excess returns with the betas obtained in the first step. Therefore, for each month between January 2000 and December 2003, both months included, we have made a cross-sectional regression between the Personal Pension Plan excess return and the beta coefficients or sensibilities, previously estimated in the first step. The regression to make is the following:
rit−RF t=λ0t+
K
j=1
Through the numbered cross-sectional regression, we have obtained the estimates of the constant term,λˆ0t, and the risk premiumˆλkt, corresponding to each of thek-factors. Subsequently, with the
results obtained from cross-sectional regressions, we have made the statistic significance test of the average coefficientsλˆ0andˆλk, that is to say, the constant term and the estimated risk premia, to verify
if the analyzed pricing model is observed in the Personal Pension Plans. The hypotheses derived from these tests are the following:
H0:λj = 0;j = 0,1,2, . . . K H1:λj = 0
and the expression of the used testing statistic:t(ˆλj) =
ˆ
λj
ˆ
σλˆ j
.
The used statistic follows a Studentt-distribution of(H −1)degrees of freedom, whereH is the number of months of the test period.
Thus, in order to correct possible variable estimating errors, which are derived from using in the cross-sectional regressions of estimations of sensibilities to factors as explanatory variables and not their own value, we have applied Shanken (1996)’s adjustment. This adjustment consists of multiplying the variance of each risk estimator,ˆσ2
ˆ
λk, by the following factor:
1 + ˆλ2k ˆ
σ2 Fk
.
5. EMPIRICAL RESULTS OF TESTING THE APT MODEL
Before proceeding to extract the common factors from the set of Personal Pension Plan excess re-turns, and which we will use later on in testing the APT model, we have tested the viability of this procedure, that is to say, the factor analysis technique. We have studied the appropriateness of the factor analysis technique by analysing the characteristics of the correlation matrix of excess return on Personal Pension Plans and we have found satisfactory results with all the applied measures. These results are the following: significance of correlation coefficients of excess returns, a very small deter-minant of the correlation matrix, refusal of the void hypothesis of Barlett’s test, high KMO index, small anti-image correlation coefficients and high MSA coefficients. All of this has led us to use the factor analysis technique for the extraction of common factors, so that these factors can explain to a larger extent the common variance of the return on Personal Pension Plans in Spain during the test period.
After analysing the viability of the factor analysis technique, we have applied the Principal Compo-nent method3to extract risk factors common to Personal Pension Plan returns. In the table 1 we have described the values of each of the factors obtained and also the proportion of the variance explained for each of them.
In order to select the common factors, which explained excess returns, to use in testing the APT pricing model on the Personal Pension Plans, we have followed two criteria. The Kaiser (1960, p. 145-146)’s criterion, which is widely used and consists of taking those factors with an eigenvalue over the unit. Likewise, we have also considered the percentage of the total variance, explained by each factor, to detect if there is any factor with enough relevance over the others. In this line, apart from the selection criterion mentioned before, and following Huang and Jo (1995, p. 998), we have used an alternative criterion, which consists of establishing a determined value for the proportion of the cumulative total variance, explained by the necessary factors and the percentage of the variance explained by each factor and, therefore, we have stopped adding more factors to the model. In this case, we have set as a division point that each factor explains more than 3% of the total variance and the number of factors to be selected can explain at least between 79% and 80% of the total variance, following what Afifi and Clark observed in their study in 1990, where they proposed 80% as the reference percentage.
Table 1 –Factors extracted from factor analysis on Personal Pension Plans
Factor Eigenvalue % of variance Cumulative %
1 61.585 70.787 70.787
2 4.379 5.034 75.821
3 2.876 3.305 79.126
4 2.088 2.400 81.526
5 1.520 1.748 83.274
6 1.277 1.468 84.742
7 1.157 1.330 86.072
In the table 1, the number of extracted factors is equal to seven, as it presents a value over the unit. Besides, we can observe that there is a dominant factor, which, almost on its own, explains most of the total variance, nearly 71 %, increasing this percentage up to 86% when considering all the selected factors. However, the number of factors to be selected in order to estimate and test the APT model varies depending on the criterion we use, therefore, we can distinguish two models. Thus, according to Kaiser (1960)’s criterion the model to be studied should contain the seven extracted factors (Model 1), while if we take into account that the first three factors explain nearly 79.13% of the total variance coinciding with the division point we have made, and that each of them explains more than 3% of the variance, these three factors would be the only ones to be included in the model (Model 2).
With the two return generating factor models we have obtained, we have tested the APT model. In the table 2 we show the results obtained from testing the APT model on the set of Personal Pension Plans and also the obtained values after having applied Shanken’s adjustment (1996).
Table 2 –Results of testing the APT on Personal Pension Plans
Used model ˆλj σˆˆλ
j t(ˆλj) P-value (ˆσˆλj)
A t(ˆλ
j)A P-value
ˆ
λ0 -0.0012 0.0007 -1.6555 0.1045 - - -ˆ
λ1 -0.1407 0.1840 -0.7649 0.4482 0.1850 -0.7606 0.4507 ˆ
λ2 0.1066 0.1293 0.8245 0.4138 0.1308 0.8149 0.4192
Model 1 λˆ3 -0.2020 0.1689 -1.1958 0.2378 0.1716 -1.1768 0.2452 ˆ
λ4 -0.0508 0.0853 -0.5959 0.5541 0.0856 -0.5941 0.5553 ˆ
λ5 -0.1152 0.1397 -0.8241 0.4140 0.1405 -0.8200 0.4164 ˆ
λ6 -0.1276 0.1588 -0.8035 0.4257 0.1599 -0.7979 0.4289 ˆ
λ7 0.1988 0.1067 1.8632 0.0687 0.1100 1.8068 0.0772 ˆ
λ0 -0.0027 0.0009 -2.9398 0.0051 - -
-Model 2 λˆ1 -0.0307 0.1607 -0.1913 0.8491 0.1607 -0.1913 0.8491 ˆ
λ2 0.1704 0.1239 1.3755 0.1755 0.1276 0.8149 0.4192 ˆ
λ3 -0.3050 0.1755 -1.7378 0.0888 0.1819 -1.6767 0.1002
AResults with Shanken’s adjustment.
coef-ficients that can be found in the scores of these factors and other macroeconomic variables. In this analysis, the macroeconomic variables have been selected taking into account the main variables used in the empirical studies on testing multifactor pricing models and the characteristics of the Spanish market. These variables are shown in the table 3.
Table 3 –Economic and financial variables that have been used
Variables Studies by
Market Portfolio Return Chen et al. (1986), Fama and French (1993), Gómez-Bezares et al. (1994), Antonio et al. (1998), Bin et al. (2003)
Inflation, interest rate variables (non-anticipated changes in the interest rate term structure, default risk premium)
Chen et al. (1986), Burmeister and Wall (1986), Chang (1991), Fama and French (1993), Rahman et al. (1998), Rodríguez (2000)
Short-term interest rates Araguas (1991), Cheng (1995), Esteve (1996), Groenewold and Fraser (1997), Clare and Priestley (1998), Altay (2003) and Jordán and García (2003)
IPI variation, shifts in oil price Chen et al. (1986), Chen and Jordan (1993) and Clare et al. (1997)
Variations of exchange rates Chang (1991), Connor (1995), Esteve (1996), Groenewold and Fraser (1997) and Altay (2003)
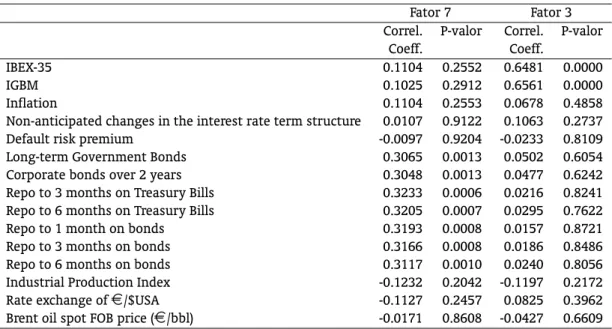
The relation among the different variables we have used and the significant factors in the Model 1 and Model 2, the factor 7 and the factor 3, respectively, are shown in the table 4.
According to the values obtained from the correlation coefficients, we can observe that though in the Model 1 the factor 7 cannot be identified with only one single variable, we can point out that this factor comprises in the return generating process the effect of a set of variables, which are related to interest rates, as we have observed a relation over 30%, which is significant with variables indicating interest rates, whether in the long term, through fixed-income government or corporate securities, or in the short term, through repo operations. This result follows what Araguas (1991, p. 528) proposed in his analysis of the Spanish Stock Market. Besides, this not single identification of a determined factor has been observed in other studies, as in those by Kim and Wu (1987, p. 92) and Zhou (1999, p. 428) for the USA market.
However, in the Model 2 we have pointed out the importance of the market risk premium, as we have identified the factor 3 with the market portfolio excess return, as it is correlated to 64.81% and 65.61% with the market indices IBEX-35 and IGBM respectively. In fact, there are different authors who, on testing the APT model, have found that the market is a significant risk factor. Among these authors, we should mention Bergés (1984)’s study on the Spanish Stock Market and Jordán and García (2003)’s on Mutual Funds.
Table 4 –Correlation Coefficients between the factor 7 and the factor 3 and other economic and financial variables
Fator 7 Fator 3 Correl. P-valor Correl. P-valor
Coeff. Coeff.
IBEX-35 0.1104 0.2552 0.6481 0.0000
IGBM 0.1025 0.2912 0.6561 0.0000
Inflation 0.1104 0.2553 0.0678 0.4858
Non-anticipated changes in the interest rate term structure 0.0107 0.9122 0.1063 0.2737 Default risk premium -0.0097 0.9204 -0.0233 0.8109 Long-term Government Bonds 0.3065 0.0013 0.0502 0.6054 Corporate bonds over 2 years 0.3048 0.0013 0.0477 0.6242 Repo to 3 months on Treasury Bills 0.3233 0.0006 0.0216 0.8241 Repo to 6 months on Treasury Bills 0.3205 0.0007 0.0295 0.7622 Repo to 1 month on bonds 0.3193 0.0008 0.0157 0.8721 Repo to 3 months on bonds 0.3166 0.0008 0.0186 0.8486 Repo to 6 months on bonds 0.3117 0.0010 0.0240 0.8056 Industrial Production Index -0.1232 0.2042 -0.1197 0.2172 Rate exchange of¤/$USA -0.1127 0.2457 0.0825 0.3962 Brent oil spot FOB price (¤/bbl) -0.0171 0.8608 -0.0427 0.6609
6. TEST OF THE MODEL SUGGESTED BY CHEN ET AL. (1986)
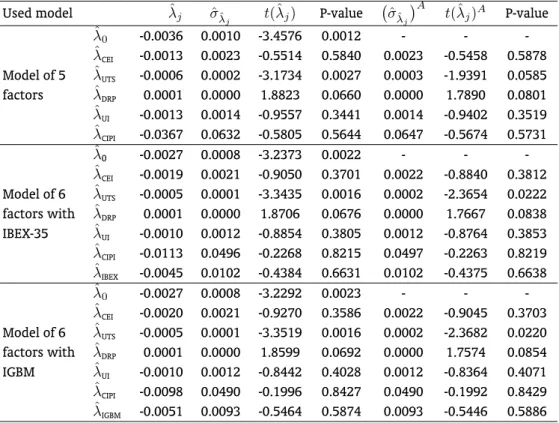
In our search for other significant risk factors we have made the empirical testing of the model pro-posed by Chen et al. (1986), where five macroeconomic variables are used: change in expected inflation (CEI), non-anticipated changes in the interest rate term structure (UTS), default risk premium (DRP) un-expected inflation (UI) and monthly variation of the industrial production index (CIPI). Moreover, a sixth variable has been included, the market return variable expressed in excess (IBEX or IGBM), presenting the extended model of six factors. The average results of testing the model by Chen et al. (1986) applied to Personal Pension Plans in Spain are shown in the table 5.
From the table 5 we can observe that the intercept is significant and with negative sign, indicating that the constant term in the model does not coincide with the risk free asset return.4
Moreover, regarding the significance of macroeconomic variables as possible risk factors in the model of five factors, firstly we have observed through the procedure of Ordinary Least Square that the risk premium, derived from non-anticipated changes in the interest rate term structure, and the default risk premium are significant at the 5% level. However, this result is relative because when we apply Shanken (1996)’s adjustment, these factors keep their significance, but only at the 10% level.
However, we have to point out that when including in the model the market risk premium, derived from IBEX-35 or IGBM, the first factor, that is to say, the term spread, acquires more significance in such a way that when correcting its standard deviation by Shanken (1996)’s adjustment, this premium turns to be a risk factor significant at the 5% level in the pricing of Personal Pension Plan return. Therefore, though the market risk premium is not significant, taking it into consideration improves the effects derived from non-anticipated changes in the interest rate term structure. In addition to this, we have to highlight that the obtained results do not seem to be affected by the market index we have used, as these results are similar to the used proxies, that is to say, the selective index and the general index.
Table 5 –Results of testing the model suggested by Chen, Roll and Ross on Personal Pension Plans
Used model λˆj σˆλˆ
j t(ˆλj) P-value
ˆ
σˆλ j
A
t(ˆλj)A P-value
ˆ
λ0 -0.0036 0.0010 -3.4576 0.0012 - - -ˆ
λCEI -0.0013 0.0023 -0.5514 0.5840 0.0023 -0.5458 0.5878
Model of 5 ˆλUTS -0.0006 0.0002 -3.1734 0.0027 0.0003 -1.9391 0.0585
factors ˆλDRP 0.0001 0.0000 1.8823 0.0660 0.0000 1.7890 0.0801
ˆ
λUI -0.0013 0.0014 -0.9557 0.3441 0.0014 -0.9402 0.3519
ˆ
λCIPI -0.0367 0.0632 -0.5805 0.5644 0.0647 -0.5674 0.5731
ˆ
λ0 -0.0027 0.0008 -3.2373 0.0022 - - -ˆ
λCEI -0.0019 0.0021 -0.9050 0.3701 0.0022 -0.8840 0.3812
Model of 6 ˆλUTS -0.0005 0.0001 -3.3435 0.0016 0.0002 -2.3654 0.0222
factors with ˆλDRP 0.0001 0.0000 1.8706 0.0676 0.0000 1.7667 0.0838
IBEX-35 ˆλUI -0.0010 0.0012 -0.8854 0.3805 0.0012 -0.8764 0.3853
ˆ
λCIPI -0.0113 0.0496 -0.2268 0.8215 0.0497 -0.2263 0.8219
ˆ
λIBEX -0.0045 0.0102 -0.4384 0.6631 0.0102 -0.4375 0.6638
ˆ
λ0 -0.0027 0.0008 -3.2292 0.0023 - - -ˆ
λCEI -0.0020 0.0021 -0.9270 0.3586 0.0022 -0.9045 0.3703
Model of 6 ˆλUTS -0.0005 0.0001 -3.3519 0.0016 0.0002 -2.3682 0.0220
factors with ˆλDRP 0.0001 0.0000 1.8599 0.0692 0.0000 1.7574 0.0854
IGBM ˆλUI -0.0010 0.0012 -0.8442 0.4028 0.0012 -0.8364 0.4071
ˆ
λCIPI -0.0098 0.0490 -0.1996 0.8427 0.0490 -0.1992 0.8429
ˆ
λIGBM -0.0051 0.0093 -0.5464 0.5874 0.0093 -0.5446 0.5886
AResults with Shanken’s adjustment.
Likewise, we have to point out that the sign of the relation found between the significant risk factors and the Personal Pension Plan excess return is consistent with what observed in other studies and with the macroeconomic situation in Spain during the test period.
In this sense, we should indicate that the significant negative sign of the variable related to non-anticipated changes in the interest rate term structure shows that a significant risk factor on the Pen-sion Plan return is the term spread, which is negative in this case due to high uncertainty in the market during the last years.5 Moreover, the difference of rates between operations of different maturity
pro-vokes uncertainty about the asset maturity, in which investments are to be made, and the portfolio distribution and, therefore, its final return, which in the case of Pension Plans means a negative pric-ing. Chen et al. (1986, p. 395) have obtained a similar result in their study for the USA Stock Market and commented that such negative pricing is due to the fact that those who want to protect their investments from a fall in the long-term real interest rates direct their investments towards assets which increase their value when this happens. Among the different authors who have found such in-fluence of the mentioned factor, we should point out Chang (1991, p. 385)’s analysis of the USA market, Araguas (1991, p. 528)’s study for the Spanish Stock Market and Rodríguez (2000, p. 21)’s analysis of fixed-income Mutual Funds in Spain.
The positive default risk premium shows that in the pricing of the Personal Pension Plans a
nificant factor is given by the difference between the interest rates of the government debt and the corporate debt. Personal Pension Plans are intended to be saved from such risk by the mentioned fac-tor. Chen et al. (1986, p. 395), Chang (1991, p. 385) and Araguas (1991, p. 528) have also obtained a positive default risk premium in their studies.
Summing up and according to the obtained results, we can point out that for the analysed sample of Personal Pension Plans, two significant risk factors are observed and they are derived from non-anticipated changes in the interest rate term structure and the default risk premium.
7. CONCLUSIONS
The results of testing the APT model on the set of Personal Pension Plans in Spain show that there is a single significant risk factor at the 10% level. For this reason, we refuse the appropriateness of this model for pricing the Personal Pension Plans. The obtained results are independent of the criterion followed to extract the number of factors. However, the significant factor is different depending on the model used and, therefore, it is identified with a different economic and financial variable, with variables related to interest rates in a factor model and with the market portfolio return in the other model.
Notwithstanding, the results obtained from testing the model by Chen et al. (1986) show two sig-nificant risk factors derived from non-anticipated changes in the interest rate term structure and the default risk premium. Therefore, we should indicate that the risk factors in the Pension Plan return mainly seem to be derived from the fixed-income market rather than equity securities or any other macroeconomic variable. All of this is consistent with the Personal Pension Plan final purpose of saving for retirement and, therefore, with the conservative character which is common in their management, as Montlor and Tarrazón (1999, p. 56) indicated. These results are in the same line as those suggested by Fama and French (1993, p. 40) in their study on the pricing of bonds. These authors have observed that the bond return is dominated by the risk factors related to the maturity or non-anticipated changes in the interest rate term structure and the default risk premium.
Bibliography
Abeysekera, S. P. & Mahajan, A. (1987). A test of the APT in pricing UK stocks.Journal of Business Finance and Accounting, 14(3):377–391.
Afifi, A. A. & Clark, V. (1990).Computer-aided multivariate analysis. Chapman & Hall, New York, USA,2nd edition.
Altay, E. (2003). The effect of macroeconomic factors on asset returns: a comparative analysis of the German and the Turkish Stock Markets in a APT framework. Technical Report 48/2003, Martin Luther University, Germany.
Antoniou, A., Garret, I., & Priestley, R. (1998). Macroeconomic variables as common pervasive risk factors and the empirical content of the Arbitrage Pricing Theory.Journal of Empirical Finance, 5(3):221–240.
Araguas, J. M. (1991). Teoría de formación de precios por arbitraje APT. Una aproximación al caso español.Actualidad Financiera, 26:513–529.
Beenstock, M. & Chan, K. (1988). Economic forces in the London Stock Market. Oxford Bulletin of Eco-nomics and Statistics, 50(1):27–39.
Bin, F. S., Morrris, G. B., & Chen, D. H. (2003). Effects of exchange-rate and interest-rate risk on ADR pricing behavior.The North American Journal of Economics and Finance, 14(2):241–262.
Bower, D. H., Bower, R. S., & Logue, D. E. (1984). Arbitrage Pricing Theory and utility stock returns. The Journal of Finance, 39(4):1041–1054.
Brown, S. J. & Weinstein, M. I. (1983). A new approach to testing asset pricing models: The bilinear paradigm.The Journal of Finance, 38(3):711–743.
Burmeister, E. & Wall, K. D. (1986). The arbitrage pricing theory and macroeconomic factor measures. The Financial Review, 21(1):1–20.
Chang, S. J. (1991). A study of empirical return generating models: A Market Model, a Multifactor Model, and a Unified Model.Journal of Business Finance and Accounting, 18(3):377–391.
Chen, N. (1983). Some empirical tests of the theory of arbitrage pricing. The Journal of Finance, 38(5):1393–1414.
Chen, N., Roll, R., & Ross, S. A. (1986). Economic Forces and the Stock Market. Journal of Business, 59(3):383–403.
Chen, S. & Jordan, B. D. (1993). Some empirical tests in the Arbitrage Pricing Theory: Macrovariables vs. derived factors.Journal of Banking and Finance, 17(1):65–89.
Cheng, A. C. S. (1995). The UK Stock Market and economic factors: a new approach. Journal of Business Finance and Accounting, 22(1):129–142.
Cho, D. C., Elton, E. J., & Gruber, M. J. (1984). On the robustness of the Roll and Ross Arbitrage Pricing Theory.The Journal of Financial and Quantitative Analysis, 19(1):1–10.
Christoffersen, P., Ghysels, E., & Swanson, N. R. (2002). Let’s get real about using economic data.Journal of Empirical Finance, 9(3):343–360.
Clare, A., Priestley, R., & Thomas, S. (1997). The robustness of the APT to alternative estimators.Journal of Business Finance and Accounting, 24(5):645–655.
Clare, A. D. & Priestley, R. (1998). Risk factors in the Malaysian Stock Market.Pacific-Basin Finance Journal, 6(1-2):103–114.
Connor, G. (1995). The three types of factor models: a comparison of their explanatory power.Financial Analysts Journal, 51(3):42–46.
Connor, G. & Korajczyk, R. A. (1993). A test for the number of factors in an approximate factor model. The Journal of Finance, 48(4):1263–1291.
Dhrymes, P. J., Friend, I., Gultekin, M. N., & Gultekin, N. B. (1985). New tests of the APT and their implications. The Journal of Finance, 40(3):659–674.
Dhrymes, P. J., Friend, I., & Gultekin, N. B. (1984). A critical reexamination of the empirical evidence on the Arbitrage Pricing Theory.The Journal of Finance, 39(2):323–346.
Diacogiannis, G. P. (1986). Arbitrage Pricing Theory: a critical examination of its empirical applicability for the London Stock Exchange.Journal of Business Finance and Accounting, 13(3):489–504.
Fama, E. F. & French, K. R. (1993). Common risk factors in the returns on stocks and bonds. Journal of Financial Economics, 33(1):3–56.
Fama, E. F. & Gibbons, M. R. (1984). A comparison of inflation forecasts. Journal of Monetary Economics, 13:327–348.
Fama, E. F. & MacBeth, J. D. (1973). Risk, return, and equilibrium: empirical tests. The Journal of Political Economy, 81(3):607–636.
Gómez-Bezares, F., Madariaga, J. A., & Santibáñez, J. (1994). Valoración de acciones en la bolsa española: un análisis de la relación entre la rentabilidad y el riesgo. Desclee de Brouwer, Bilbao, Spain.
Groenewold, N. & Fraser, P. (1997). Share prices and macroeconomic factors. Journal of Business Finance and Accounting, 24(9-10):1367–1383.
Huang, R. D. & Jo, H. (1995). Data frequency and the number of factors in stock returns. Journal of Banking and Finance, 19(6):987–1003.
Jordán, L. & García, J. (2003). Estimación y contraste del modelo APT en los fondos de inversión mobil-iaria españoles.Análisis Financiero, 89:22–35.
Kaiser, H. F. (1960). The application of electronic computers to factor analysis. Educational and Psycho-logical Measurement, 20(1):141–151.
Kim, M. K. & Wu, C. (1987). Macro-economic factors and stock returns. Journal of Financial Research, 10(2):87–97.
Koutoulas, G. & Kryzanowski, L. (1996). Macrofactor conditional volatilities, time-varying risk premia and stock return behavior.The Financial Review, 31(1):169–195.
Kryzanowski, L. & To, M. C. (1983). General factor models and the structure of security returns. The Journal of Financial and Quantitative Analysis, 18(1):31–52.
Lehmann, B. N. & Modest, D. M. (1988). The empirical foundations of the arbitrage pricing theory. Journal of Financial Economics, 21(2):213–254.
Montlor, J. & Tarrazón, M. A. (1999). La inversión de los fondos de pensiones: comparación del caso español y la situación internacional. Technical Report 151/199, Fundación de las Cajas de Ahorros Confederadas para la Investigación Económica y Social, Spain.
Priestley, R. (1996). The arbitrage pricing theory, macroeconomic and financial factors, and expectations generating processes.Journal of Banking and Finance, 20(5):869–890.
Rahman, S., Coggin, T. D., & Lee, C. (1998). Some tests of the risk-return relationship using alternative asset pricing models and observed expected returns. Review of Quantitative Finance and Accounting, 11(1):69–91.
Reinganum, M. R. (1981). The Arbitrage Pricing Theory: some empirical results. The Journal of Finance, 36(2):313–321.
Rodríguez, F. (2000). Influencia de las variaciones no esperadas de variables macroeconómicas en la rentabilidad de los fondos de inversión mobiliaria de renta fija. InX Congreso Nacional de ACEDE, Oviedo, Spain.
Ross, S. (1976). The arbitrage theory of capital asset pricing theory. Journal of Economic Theory, 13(3):341–360.
Shanken, J. (1996). Statistical methods in tests of portfolio efficiency: a synthesis. In Madala, S. & Rao, C., editors,Handbook of Statistics, volume 14. Elsevier Sciences.
Shanken, J. & Weinstein, M. I. (1990). Macroeconomic variables and asset pricing: estimation and tests. Technical report, Simon School of Business Administration, University of Rochester USA.
Swoboda, C. (2003). Teoría del arbitraje de precios: una investigación empírica para la Argentina. InIII Encuentro Internacional de Finanzas, Santiago de Chile, Chile.