Value and growth stocks in Brazil: risks and returns for
one- and two-dimensional portfolios under different
economic conditions
Ações de valor e de crescimento no Brasil: riscos e retornos
de carteiras uni e bidimensionais em diferentes estados da
economia
Leandro da Rocha Santos
Professor Mestre em Administração – Grupo IBMEC Educacional S.A. E-mail: [email protected]
Roberto Marcos da Silva Montezano
Professor Titular em Economia - Grupo IBMEC Educacional S.A. E-mail: [email protected]
Recebido em 24.11.2010 - Aceito em 11.01.2011 - 3ª. versão aceita em 29.04.2011
ABSTRACT
For empirical purposes, value stocks are usually defined as those traded at low price-to-earnings ratios (stock prices divided by earnings per share), low price-to-book ratios (stock prices divided by book value per share) or high dividend yields (dividends per share divided by stock prices). Growth stocks, on the other hand, are traded at high price-to-earnings ratios, high price-to-book ratios or low dividend yields. Academic research so far produced, international and Brazilian alike, shows that value stocks outperform growth stocks, challenging the Efficient Market Hypothesis, which states that the market prices of traded stocks are the best estimate of their intrinsic values. Most studies use a single ratio to sort stocks on per-centiles; risks (generally defined as beta or standard deviations) and returns are then calculated for the resulting value and growth portfolios. In the present paper, we aim to further contribute to the growing literature on the field by applying a method not previously tested on the Brazilian market. We build portfo-lios sorted by the price-to-earnings and price-to-book ratios alone and by a combination of both in order to assess value and growth stocks’ risks and returns on the Brazilian stock market between 1989 and 2009. Furthermore, our risk analysis may be regarded as the paper’s main contribution, since its approach de-parts from conventional risk concepts, as we not only test for beta: portfolios’ returns are measured under different economic conditions. Results support a pervasive value premium in the Brazilian stock market. Risk analysis shows that this premium holds under every economic condition analyzed, suggesting that value stocks are indeed less risky. Beta proved not to be a satisfactory risk measure. Portfolios sorted by the price-to-earnings ratio yielded the best results.
Keywords: Value Stocks. Growth Stocks. Market Efficiency. Emerging Markets. Brazilian Stocks. BM&FBovespa.
RESUMO
da ação dividido pelo valor patrimonial por ação) ou altos dividend yields (dividendos por ação divididos pelo preço da ação). Ações de crescimento, por outro lado, são aquelas negociadas a altos índices preço/lucro, altos índices preço/valor patrimonial ou baixos dividend yields. Pesquisas acadêmicas brasileiras e internacionais mostram que as ações de valor têm melhor desempenho do que as de crescimento, contrariando a Hipótese de Mercados Eficientes, que estabelece que os preços de mercado das ações são as melhores estimativas de seus valores intrínsecos. A maioria dos estudos utiliza um único múltiplo para classificar carteiras em percentis; riscos (geralmente definidos como coeficiente beta ou desvio-padrão) e retornos são então calculados para as carteiras de valor e de crescimento. No presente paper, busca-se contribuir para a crescente literatura sobre o tema empregando uma metodologia ainda não testada no mercado brasileiro. Construíram-se carteiras classificadas pelos índices preço/lucro e preço/valor patrimonial, isoladamente e em conjunto, para calcular riscos e retornos no mercado acionário brasileiro no período 1989-2009. Ademais, a análise de risco pode ser considerada a principal contribuição do paper, uma vez que a abordagem diverge de tradicionais métricas de risco, já que não se testou apenas o coeficiente beta: os retornos das carteiras são medidos em diferentes estados da economia. Os resultados indicam um consistente prêmio de valor no mercado acionário brasileiro. A análise de risco mostra que esse prêmio ocorre em todos os estados da economia analisados, o que sugere que as ações de valor são realmente menos arriscadas. O beta não se mostrou uma medida satisfatória de risco. As carteiras classificadas pelo índice preço/lucro produziram os melhores resultados.
Palavras-chave: Ações de Valor. Ações de Crescimento. Eficiência de Mercado. Mercados Emergentes. Ações Brasileiras. BM&F Bovespa
1 INTRODUCTION
Academic research on Value Investing seemed to lie dormant well into the 1990s, in spite of the pioneering study by Basu (1977), the half-century-old teachings of Benjamin Graham – who, on 1934, laid bare the foundations of the discipline (GRAHAM AND DODD, 1934) – and the remarkable investment stories of many of his followers, notably Berkshire Hathaway’s Warren Buffett, whose 24-year-long investment history produced a 20.3% compounded growth (BUFFETT, 2010). Part of the blame can be attributed to the intellectual dominance of the Efficient Markets School (EMS), whose models and theories became the paradigms of choice of the academic community. In a nutshell, the EMS propounds that agents are rational, the market prices of tradable securities are the best estimate of their intrinsic values and higher returns always entail higher risks (for a brief overview of market efficiency, see DIMSON AND MUSSAVIAN, 1998. The EMS has been criticized by, among others, MANDELBROT, 2004). Conversely, Value Investing’s
practitioners regard markets as inherently inefficient: investors often bid market prices away from intrinsic values, allowing for the purchase of undervalued securities, which tend to produce better returns in the long run (see GREENWALD ET AL., 2001). Rationality is indeed limited, for market agents are human beings, psychologically and neurologically unfit for investing (see BARBERIS AND THALER, 2003 and ZWEIG, 2007), who from time to time fall victim to market fads (see KINDLEBERGER, 2005 and CHANCELLOR, 2000).
Investing’s dominance, casting doubts on the EMS’ propositions. Nonetheless, given the worldwide publicity of the studies, the reasons for the superior performance remain controversial. Market efficiency-oriented researchers view value stocks as inherently riskier than growth stocks, yielding, therefore, higher returns. They take this stance despite the fact that traditional risk measures, such as beta and standard deviation, are shown to be generally smaller for value stocks (or, at most, disproportionately small relative to their higher returns). Behavioral-oriented researchers, on the other hand, view value stocks as less risky than growth stocks and maintain that their superior performance stems from behavioral and agency issues.
Most studies so far produced, international and Brazilian alike, focus on what can be dubbed one-dimensional strategies. A single multiple such as price-to-earnings (P/E, the ratio of the stock’s market price to the company’s profits) or price-to-book (P/B, the ratio of the stock’s market price to the company’s book value) is used to sort stocks into percentiles, producing different portfolios. The one with the lowest multiples stands for the value (“cheap”) portfolio; at the other end of the spectrum lies the growth (“expensive”) portfolio. Risks and returns are then calculated for each portfolio.
The economic motivation for selecting stocks according to these multiples comes primarily from two behavioral issues: overreaction and reversion to the mean. Graham (2006) sustains that the “manic-depressive Mr. Market” overreacts, leading securities’ prices, momentarily or throughout long periods, away from their intrinsic values and their historical average. Debondt and Thaler (1985) tested the overreaction hypothesis and concluded that losing portfolios (made up of stocks that underperformed the market in the five years prior to portfolio formation) outperformed winning portfolios (those that outperformed
the market in the five years prior to portfolio formation), even though the latter were riskier. Debondt and Thaler (1989) also tested the reversion to the mean hypothesis and concluded that stock prices do revert to the mean, either in a long-term perspective or after extreme market movements. Thus, low P/Es and low P/Bs are expected to capture, in a single metric, the excesses of pessimism and the failure of investors to consider reversion to the mean.
of wealth is higher. Their results have shown that value stocks are indeed less risky since they outperform growth stocks in every state of the economy analyzed and, most important of all, the results are even better in negative states.
Following in their footsteps, Chin et al. (2002) tested two-dimensional strategies in the New Zealand market and found that they outperform one-dimensional strategies. They did not, however, test the risk proposition advanced by Lakonishok et al. (1994). Athanassakos (2009), on the other hand, tested the risk proposition for portfolios sorted on P/E and P/B alone and alongside beta and size on the Canadian stock market. He found evidence of a pervasive value premium and better performances for the value strategy in every state of the economy analyzed.
To our knowledge, no previous study on the Brazilian market tested both propositions. One-dimensional and multivariate studies abound, showing that value stocks outperform growth stocks and are generally less risky (see, for example, RAMOS ET AL., 2000, ROSTAGNO ET AL., 2003, BRAGA AND LEAL, 2004, LOPES AND GALDI, 2007 and GALDI, 2008). None of them, however, tested for the two-dimensional strategies put forward by Lakonishok et al (1994). Risk analyses are generally based on traditional risk measures such as beta, standard deviation and the Sharpe Coefficient, but not on the assessment of risks under different states of the economy, which casts a wholly different light upon the subject, as it does not equate risk with volatility (arguably, volatility, by itself, might not be a proper risk measure for investors with long-term horizons). Moreover, most Brazilian studies focus on 10-year periods at most. Our paper, on the other hand, encompasses a 20-year period which, besides the obvious advantage of length, was shaped by five years of rampant hyperinflation and 15 years of monetary stability.
Thus, the present paper aims to contribute to the growing academic literature by doing both. Throughout a 20-year period, we test for one- and two-dimensional strategies on the Brazilian stock market and measure the risk of both strategies, assessing their performance in different states of the economy. For the sake of completeness, we also test for beta.
Before discussing our method, we present a brief summary of the key results found in the literature. Fama and French (1992) studied the American market from 1963 to 1990 and found a monthly value premium of 1.53 percentage points (p.p.) when sorting on P/Es and one of 0.68 p.p when sorting on P/Bs (betas were almost identical). Lakonishok et al (1994) tested different sorting strategies in the same market and period. When sorting on P/Es and P/Bs, for example, they found 5-year compound premiums of 67 p.p. and 90 p.p. respectively (again, the differences in betas were negligible). When using two-dimensional strategies, they attained a 104 p.p. 5-year composite value premium for the pair of variables P/E and GS (growth of sales). As already mentioned, value portfolios performed better in bad states of the economy, being thus less risky. Chin et al (2002) found a 78 p.p. three-year compound cumulative value premium for the two-dimensional P/E+P/B portfolio on the New Zealand market during the 1988-1995 period. Athanassakos (2009) investigated the Canadian market, using data from the 1985-2005 period, and found an average yearly value premium of 6.30 p.p. (when sorting on P/Es) and a consistent outperformance of the value portfolios in every state of the economy analyzed.
1988-1994 period. Rostagno et al. (2003) tested various value strategies throughout the 1994-2003 period. They found lower risks (measured as better Sharpe ratios) and a cumulative 304.57 p.p. value premium on P/E-sorted portfolios. Braga and Leal (2004) investigated the 1991-1998 period, using deflated numbers. They found a cumulative 155.03 p.p. value premium on P/B-sorted portfolios and better Sharpe ratios for value stocks. Lopes and Galdi (2007) tested the Brazilian market from
1994 to 2004 and found that value stocks (sorted by P/B) that are financially strong do generate higher returns than financially weak value stocks. The premium for two-year market adjusted returns was 77.8 p.p. They point out, however, that results were largely influenced by “small, low liquidity or highly indebted firms” (LOPES AND GALDI, 2007). Galdi (2008) applied a similar approach using P/E instead of P/B. Premiums for portfolios held for two years amounted to 109.6 pp.
2 RESEARCH METHOD
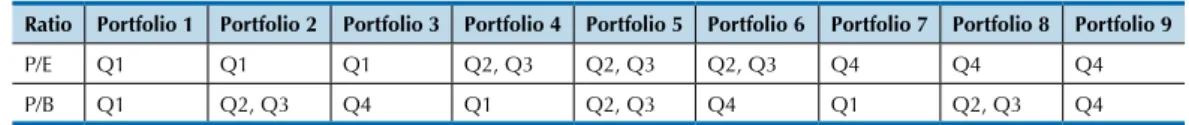
Table 1 Resulting portfolios for the two-dimensional strategy
Ratio Portfolio 1 Portfolio 2 Portfolio 3 Portfolio 4 Portfolio 5 Portfolio 6 Portfolio 7 Portfolio 8 Portfolio 9
P/E Q1 Q1 Q1 Q2, Q3 Q2, Q3 Q2, Q3 Q4 Q4 Q4
P/B Q1 Q2, Q3 Q4 Q1 Q2, Q3 Q4 Q1 Q2, Q3 Q4
Our data set comprises the period from December 1988 to April 2009. We build one-dimensional portfolios sorted by the P/E and the P/B ratios. The two-dimensional portfolios combine both ratios. We apply a buy-and-hold strategy and our portfolios are built every April 30th, to ensure that accounting results for the previous fiscal year (earnings per share and book value) were already made public. Thus, P/Es are defined as the stock’s market prices on April 30th of year t divided by the respective earnings per share on year t-1. P/Bs use book value on the denominator. Therefore, the first portfolios are built using market prices on April 30th, 1989 and each firm’s
1988 accounting results. Portfolios are held for a year and the corresponding returns and betas are then calculated using market prices on April 30th of the year subsequent to the portfolio’s formation. The last portfolios are built on 2008, using 2007 accounting data and 2009 market data for the measurement of returns.
In the one-dimensional strategy, we sort stocks into quartiles. The first quartile, the one with the lowest P/Es or P/Bs, represents the value portfolio; the fourth, the growth portfolio. For the two-dimensional strategy, we take intersections to build the portfolios shown below in Table 1. Portfolio 1 stands for the value portfolio; Portfolio 9 for the growth portfolio.
All portfolio returns are equally weighted. We do not calculate market-adjusted returns since we do not aim to compare portfolios returns with the overall market returns, but rather to assess the value premium (measured as the spread between the value and the growth portfolios) throughout different holding periods. When calculating
returns, we do not account for taxes and transaction costs.
Table 2 Real per capita GDP change and inlation-adjusted Ibovespa index (at
year-end closing prices)
Year Real per capita
GDP change
Inlation-adjusted
Ibovespa index
1988 -1.9% 6,577.68
1989 1.4% 5,909.99
1990 -7.1% 1,402.07
1991 -0.7% 5,914.70
1992 -2.2% 5,412.81
1993 3.3% 11,629.84
1994 4.2% 13,495.03
1995 2.6% 10,702.52
1996 0.6% 15,996.24
1997 1.8% 22,017.27
1998 -1.5% 14,410.80
1999 -1.2% 33,325.95
2000 2.8% 28,076.34
2001 -0.2% 23,201.19
2002 1.2% 17,111.33
2003 -0.2% 30,894.01
2004 4.3% 33,824.99
2005 1.9% 40,872.48
2006 2.7% 52,678.30
2007 4.9% 72,443.95
2008 4.0% 40,205.43
Source: Brazilian Central Bank (2010) and Economatica
numbers are central to our model for two reasons: first, our data set comprises both the 1989-1993 hyperinflation period (prior to the advent of the “Plano Real”) and the post-1994 more stable period and second, there is a gap between the publication of accounting statements and the date established for the portfolios’ construction (April, 30th). It should also be underlined that Brazilian accounting rules prior to 1994 allowed for balance sheet adjustments for inflation (for the reason that the figures would otherwise be meaningless). These adjustments were already factored in the data provided by Economatica.
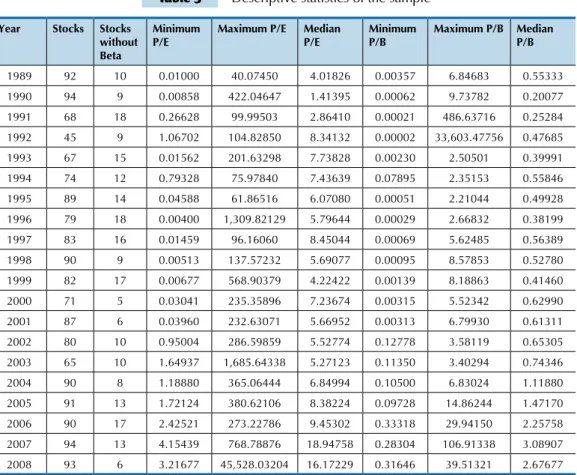
To ensure an adequate degree of liquidity, we limit our sample to the top 100 non-financial Brazilian companies by market value. We exclude companies that have shown accounting losses or negative book value in the fiscal year prior to portfolio formation. We also exclude stocks that were not traded on April, 30th of the subsequent year. As a result, the number of stocks in our sample ranged from 45 to 94, 81 being the average.
To test the risk proposition advanced by Lakonishok et al. (1994), we define four states of the economy: bull and bear markets, expansions and contractions. Bull markets were the years when the Ibovespa stock index grew in real terms (1991, 1993, 1994, 1996, 1997, 1999, 2003-2007); the opposite defines bear markets. Expansions were the years when Brazilian real per capita GDP advanced (1989, 1993-1997, 2000, 2002, 2004-2008); the opposite defines contractions. Besides these four states, we also calculate results for the total period, the first and second half, the 1989-1993 period (the years before the Plano Real, being thus characterized by high inflation and economic instability) and the
1994-We then group the results and present average annual returns, compound annual returns, cumulative returns, betas1, the average value premium (the difference between the returns of the value and growth portfolios) and t-statistics for testing the null hypothesis that the mean returns of the value and the growth portfolios are equal.
1 It should be noted that a yearly average of 15% of the stocks did not have betas in Economatica’s database.
Table 3 Descriptive statistics of the sample
Year Stocks Stocks
without
Beta
Minimum
P/E
Maximum P/E Median P/E
Minimum
P/B
Maximum P/B Median P/B
1989 92 10 0.01000 40.07450 4.01826 0.00357 6.84683 0.55333
1990 94 9 0.00858 422.04647 1.41395 0.00062 9.73782 0.20077
1991 68 18 0.26628 99.99503 2.86410 0.00021 486.63716 0.25284
1992 45 9 1.06702 104.82850 8.34132 0.00002 33,603.47756 0.47685
1993 67 15 0.01562 201.63298 7.73828 0.00230 2.50501 0.39991
1994 74 12 0.79328 75.97840 7.43639 0.07895 2.35153 0.55846
1995 89 14 0.04588 61.86516 6.07080 0.00051 2.21044 0.49928
1996 79 18 0.00400 1,309.82129 5.79644 0.00029 2.66832 0.38199
1997 83 16 0.01459 96.16060 8.45044 0.00069 5.62485 0.56389
1998 90 9 0.00513 137.57232 5.69077 0.00095 8.57853 0.52780
1999 82 17 0.00677 568.90379 4.22422 0.00139 8.18863 0.41460
2000 71 5 0.03041 235.35896 7.23674 0.00315 5.52342 0.62990
2001 87 6 0.03960 232.63071 5.66952 0.00313 6.79930 0.61311
2002 80 10 0.95004 286.59859 5.52774 0.12778 3.58119 0.65305
2003 65 10 1.64937 1,685.64338 5.27123 0.11350 3.40294 0.74346
2004 90 8 1.18880 365.06444 6.84994 0.10500 6.83024 1.11880
2005 91 13 1.72124 380.62106 8.38224 0.09728 14.86244 1.47170 2006 90 17 2.42521 273.22786 9.45302 0.33318 29.94150 2.25758
2007 94 13 4.15439 768.78876 18.94758 0.28304 106.91338 3.08907 2008 93 6 3.21677 45,528.03204 16.17229 0.31646 39.51321 2.67677
Our method entails limitations: a slight survivorship bias, given the fact that we only included in the sample stocks that were being traded one year after portfolio formation; stocks are sorted into quartiles, which might not have been the best way to
build portfolios; taxes and transaction costs were not accounted for; we only tested for 20 years, which might seem an eternity in today’s hectic investment environment, but is in fact an unrepresentative period for the history of a stock market.
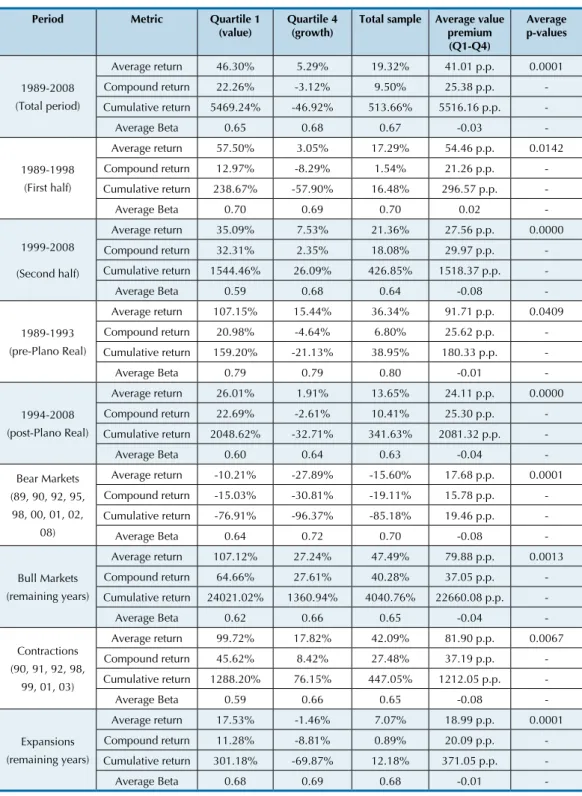
Our tests point to the unequivocal superiority of the value strategy. As shown in Table 4, one-dimensional P/E-sorted value portfolios averaged an annual compound return of 22.26% throughout our 20-year test period, whereas the growth portfolio yielded a negative return
of 3.12%2. The value strategy outperformed the growth strategy in each and every period analyzed (the sample’s first half, the second half, the years prior to the “Plano Real” and the years afterwards) and the null hypothesis was rejected at the 10% significance level.
2 We excluded from our sample the annual return of 12,415.06% in the year 2001, which was produced by Petroquisa, a Brazilian petrochemical company. Should we have left it, value stocks would have generated an annual compounded return of 33.58%. Nonetheless, the case for keeping it should be underlined: Petroquisa’s P/Es and P/Bs from 1990 to 2001 signaled a major, irrational bargain.
3 EMPIRICAL RESULTS
Table 4 Results for one-dimensional P/E-sorted portfolios
Period Metric Quartile 1
(value) Quartile 4 (growth) Total sample Average value premium (Q1-Q4)
Average
p-values
1989-2008
(Total period)
Average return 46.30% 5.29% 19.32% 41.01 p.p. 0.0001
Compound return 22.26% -3.12% 9.50% 25.38 p.p.
-Cumulative return 5469.24% -46.92% 513.66% 5516.16 p.p.
-Average Beta 0.65 0.68 0.67 -0.03
-1989-1998
(First half)
Average return 57.50% 3.05% 17.29% 54.46 p.p. 0.0142
Compound return 12.97% -8.29% 1.54% 21.26 p.p.
-Cumulative return 238.67% -57.90% 16.48% 296.57 p.p.
-Average Beta 0.70 0.69 0.70 0.02
-1999-2008
(Second half)
Average return 35.09% 7.53% 21.36% 27.56 p.p. 0.0000
Compound return 32.31% 2.35% 18.08% 29.97 p.p.
-Cumulative return 1544.46% 26.09% 426.85% 1518.37 p.p.
-Average Beta 0.59 0.68 0.64 -0.08
-1989-1993
(pre-Plano Real)
Average return 107.15% 15.44% 36.34% 91.71 p.p. 0.0409
Compound return 20.98% -4.64% 6.80% 25.62 p.p.
-Cumulative return 159.20% -21.13% 38.95% 180.33 p.p.
-Average Beta 0.79 0.79 0.80 -0.01
-1994-2008
(post-Plano Real)
Average return 26.01% 1.91% 13.65% 24.11 p.p. 0.0000
Compound return 22.69% -2.61% 10.41% 25.30 p.p.
-Cumulative return 2048.62% -32.71% 341.63% 2081.32 p.p.
-Average Beta 0.60 0.64 0.63 -0.04
-Bear Markets
(89, 90, 92, 95,
98, 00, 01, 02, 08)
Average return -10.21% -27.89% -15.60% 17.68 p.p. 0.0001
Compound return -15.03% -30.81% -19.11% 15.78 p.p.
-Cumulative return -76.91% -96.37% -85.18% 19.46 p.p.
-Average Beta 0.64 0.72 0.70 -0.08
-Bull Markets
(remaining years)
Average return 107.12% 27.24% 47.49% 79.88 p.p. 0.0013
Compound return 64.66% 27.61% 40.28% 37.05 p.p.
-Cumulative return 24021.02% 1360.94% 4040.76% 22660.08 p.p.
-Average Beta 0.62 0.66 0.65 -0.04
-Contractions
(90, 91, 92, 98,
99, 01, 03)
Average return 99.72% 17.82% 42.09% 81.90 p.p. 0.0067
Compound return 45.62% 8.42% 27.48% 37.19 p.p.
-Cumulative return 1288.20% 76.15% 447.05% 1212.05 p.p.
-Average Beta 0.59 0.66 0.65 -0.08
-Expansions (remaining years)
Average return 17.53% -1.46% 7.07% 18.99 p.p. 0.0001
Compound return 11.28% -8.81% 0.89% 20.09 p.p.
-Cumulative return 301.18% -69.87% 12.18% 371.05 p.p.
-Average Beta 0.68 0.69 0.68 -0.01
-Risk analysis tells the same story. Value outperformed growth by a sizeable premium in all states of the economy. Attention
expansions. Value’s betas were somewhat smaller (save for the sample’s first half). Thus, our results echo the ones found by Lakonishok et al. (1994) and suggest that value stocks are less risky and yield higher returns, in stark contrast to the EMS’s propositions.
Panels A and B of Table 5 show the results for the one-dimensional P/B-sorted portfolios and the two-dimensional portfolios, respectively. Results were smaller than P/E sorted portfolios’ but, in both strategies, value stocks confirmed their dominance: compound value premium totaled 19.22% when applying the two-dimensional strategy and 18.34% when sorting on P/Bs. Thus, contrary to Lakonishok et al. (1994), we did
not find better results for the two-dimensional strategies, as the corresponding figure for the P/E-sorted portfolios was 25.38%.
We believe P/Bs’ (and as a consequence, the two-dimensional’s) underperformance may be due to the fact that investors buy stocks expecting future cash flows. Graham and Meredith (1998) argue that book value may be an important metric in security analysis only in exceptional cases and that the success of an investment depends primarily on its earning power. Therefore, it would be reasonable to expect that P/E - a metric that captures earning power - would perform better than P/B, which is an indicator of the hard assets of the company, which may be outdated or obsolete.
Table 5 Results for one-dimensional P/B-sorted portfolios and for two-dimensional portfolios
PANEL A: Results for one-dimensional P/B-sorted portfolios
Period Metric Quartile 1
(value) Quartile 4 (growth) Total sample Average value premium (Q1-Q4)
Average
p-values
1989-2008
(Total period)
Average return 30.42% 3.21% 19.32% 27.21 p.p. 0.0001
Compound return 15.68% -2.66% 9.50% 18.34 p.p.
-Cumulative return 1740.81% -41.69% 513.66% 1782.50 p.p.
-Average Beta 0.72 0.66 0.67 0.06
-1989-1998
(First half)
Average return 30.94% -7.64% 17.29% 38.58 p.p. 0.0034
Compound return 4.92% -12.97% 1.54% 17.89 p.p.
-Cumulative return 61.60% -75.07% 16.48% 136.67 p.p.
-Average Beta 0.72 0.68 0.70 0.04
-1999-2008
(Second half)
Average return 29.90% 14.06% 21.36% 15.84 p.p. 0.0045
Compound return 27.54% 8.87% 18.08% 18.67 p.p.
-Cumulative return 1039.10% 133.90% 426.85% 905.20 p.p.
-Average Beta 0.72 0.63 0.64 0.08
-1989-1993
(pre-Plano Real)
Average return 57.58% -3.44% 36.34% 61.02 p.p. 0.0195
Compound return 7.23% -13.11% 6.80% 20.34 p.p.
-Cumulative return 41.74% -50.48% 38.95% 92.23 p.p.
-Average Beta 0.80 0.80 0.80 0.00
-1994-2008
(post-Plano Real)
Average return 21.37% 5.43% 13.65% 15.94 p.p. 0.0005
Compound return 18.64% 1.10% 10.41% 17.55 p.p.
-Cumulative return 1198.69% 17.75% 341.63% 1180.94 p.p.
-Average Beta 0.69 0.61 0.63 0.08
Period Metric Quartile 1
(value) Quartile 4 (growth) Total sample Average value premium (Q1-Q4)
Average
p-values
Bear Markets
(89, 90, 92, 95,
98, 00, 01, 02, 08)
Average return -12.39% -20.35% -15.60% 7.96 p.p. 0.1631
Compound return -18.44% -23.58% -19.11% 5.15 p.p.
-Cumulative return -84.02% -91.11% -85.18% 7.09 p.p.
-Average Beta 0.73 0.73 0.70 0.00
-Bull Markets
(remaining years)
Average return 72.13% 15.42% 47.49% 56.72 p.p. 0.0001
Compound return 53.96% 18.65% 40.28% 35.31 p.p.
-Cumulative return 11422.73% 556.14% 4040.76% 10866.59 p.p.
-Average Beta 0.68 0.63 0.65 0.05
-Contractions
(90, 91, 92, 98,
99, 01, 03)
Average return 52.00% 18.80% 42.09% 33.21 p.p. 0.0790
Compound return 27.22% 13.77% 27.48% 13.45 p.p.
-Cumulative return 439.22% 146.65% 447.05% 292.57 p.p.
-Average Beta 0.68 0.67 0.65 0.01
-Expansions (remaining years)
Average return 18.80% -5.18% 7.07% 23.98 p.p. 0.0002
Compound return 9.91% -10.50% 0.89% 20.41 p.p.
-Cumulative return 241.38% -76.36% 12.18% 317.74 p.p.
-Average Beta 0.74 0.65 0.68 0.09
-PANEL B: Results for two-dimensional portfolios
Period Metric Portfolio 1
(value) Portfolio 9 (growth) Total sample Average value premium (P1-P4)
Average
p-values
1989-2008
(Total period)
Average return 36.57% 6.45% 19.32% 30.13 p.p. 0.0000
Compound return 18.70% -0.52% 9.50% 19.22 p.p.
-Cumulative return 2983.10% -9.94% 513.66% 2993.04 p.p.
-Average Beta 0.69 0.67 0.67 0.02
-1989-1998
(First half)
Average return 41.94% -0.15% 17.29% 42.09 p.p. 0.0020
Compound return 9.42% -8.55% 1.54% 17.97 p.p.
-Cumulative return 145.92% -59.09% 16.48% 205.01 p.p.
-Average Beta 0.71 0.68 0.70 0.03
-1999-2008
(Second half)
Average return 31.21% 13.05% 21.36% 18.16 p.p. 0.0001
Compound return 28.77% 8.21% 18.08% 20.56 p.p.
-Cumulative return 1153.70% 120.15% 426.85% 1033.55 p.p.
-Average Beta 0.66 0.66 0.64 0.00
-1989-1993
(pre-Plano Real)
Average return 77.30% 6.91% 36.34% 70.39 p.p. 0.0081
Compound return 14.70% -7.91% 6.80% 22.61 p.p.
-Cumulative return 98.55% -33.75% 38.95% 132.30 p.p.
-Average Beta 0.80 0.79 0.80 0.00
-1994-2008
(post-Plano Real)
Average return 23.00% 6.29% 13.65% 16.70 p.p. 0.0000
Compound return 20.06% 2.07% 10.41% 17.99 p.p.
-Cumulative return 1452.82% 35.95% 341.63% 1416.87 p.p.
-Average Beta 0.65 0.63 0.63 0.02
-continued
Period Metric Portfolio 1
(value) Portfolio 9 (growth) Total sample Average value premium (P1-P4)
Average
p-values
Bear Markets
(89, 90, 92, 95,
98, 00, 01, 02, 08)
Average return -11.53% -22.01% -15.60% 10.48 p.p. 0.0012
Compound return -16.60% -25.15% -19.11% 8.54 p.p.
-Cumulative return -80.48% -92.62% -85.18% 12.14 p.p.
-Average Beta 0.69 0.73 0.70 -0.04
-Bull Markets
(remaining years)
Average return 85.79% 24.26% 47.49% 61.53 p.p. 0.0002
Compound return 58.44% 25.54% 40.28% 32.90 p.p.
-Cumulative return 15696.12% 1120.63% 4040.76% 14575.49 p.p.
-Average Beta 0.65 0.64 0.65 0.01
-Contractions
(90, 91, 92, 98,
99, 01, 03)
Average return 70.96% 22.14% 42.09% 48.82 p.p. 0.0138
Compound return 35.46% 15.56% 27.48% 19.90 p.p.
-Cumulative return 736.83% 175.16% 447.05% 561.67 p.p.
-Average Beta 0.64 0.65 0.65 -0.02
-Expansions (remaining years)
Average return 18.06% -2.00% 7.07% 20.06 p.p. 0.0016
Compound return 10.55% -8.23% 0.89% 18.78 p.p.
-Cumulative return 268.43% -67.27% 12.18% 335.69 p.p.
-Average Beta 0.71 0.68 0.68 0.03
-continued
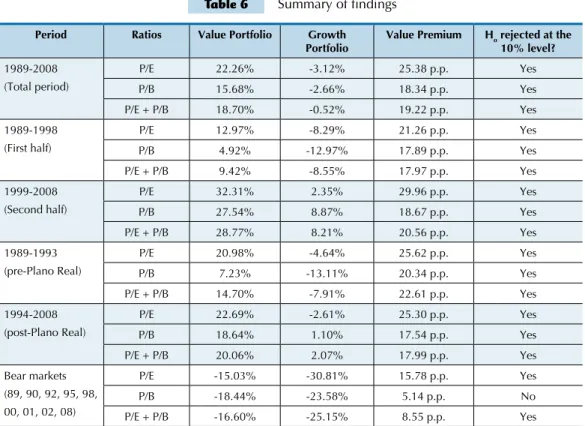
Table 6 presents a summary of the compound annual returns, permitting easy comparison of all strategies tested.
Table 6 Summary of indings
Period Ratios Value Portfolio Growth
Portfolio
Value Premium Ho rejected at the
10% level?
1989-2008
(Total period)
P/E 22.26% -3.12% 25.38 p.p. Yes
P/B 15.68% -2.66% 18.34 p.p. Yes
P/E + P/B 18.70% -0.52% 19.22 p.p. Yes
1989-1998
(First half)
P/E 12.97% -8.29% 21.26 p.p. Yes
P/B 4.92% -12.97% 17.89 p.p. Yes
P/E + P/B 9.42% -8.55% 17.97 p.p. Yes
1999-2008
(Second half)
P/E 32.31% 2.35% 29.96 p.p. Yes
P/B 27.54% 8.87% 18.67 p.p. Yes
P/E + P/B 28.77% 8.21% 20.56 p.p. Yes
1989-1993
(pre-Plano Real)
P/E 20.98% -4.64% 25.62 p.p. Yes
P/B 7.23% -13.11% 20.34 p.p. Yes
P/E + P/B 14.70% -7.91% 22.61 p.p. Yes
1994-2008
(post-Plano Real)
P/E 22.69% -2.61% 25.30 p.p. Yes
P/B 18.64% 1.10% 17.54 p.p. Yes
P/E + P/B 20.06% 2.07% 17.99 p.p. Yes
Bear markets
(89, 90, 92, 95, 98,
00, 01, 02, 08)
P/E -15.03% -30.81% 15.78 p.p. Yes
P/B -18.44% -23.58% 5.14 p.p. No
P/E + P/B -16.60% -25.15% 8.55 p.p. Yes
Period Ratios Value Portfolio Growth Portfolio
Value Premium Ho rejected at the
10% level?
Bull markets
(remaining years)
P/E 64.66% 27.61% 37.05 p.p. Yes
P/B 53.96% 18.65% 35.31 p.p. Yes
P/E + P/B 58.44% 25.54% 32.90 p.p. Yes
Contractions
(90, 91, 92, 98, 99,
01, 03)
P/E 45.62% 8.42% 37.20 p.p. Yes
P/B 27.22% 13.77% 13.45 p.p. Yes
P/E + P/B 35.46% 15.56% 19.90 p.p. Yes
Expansions (remaining years)
P/E 11.28% -8.81% 20.09 p.p. Yes
P/B 9.91% -10.50% 20.41 p.p. Yes
P/E + P/B 10.55% -8.23% 18.78 p.p. Yes
continued
The value strategy’s superiority can be easily grasped by focusing on the fifth column, which shows the pervasive and sizeable value premium. Table 5 also highlights the remarkable results produced by the P/E-sorted portfolios. Compared to the other strategies, spreads only lagged during expansions by a tiny margin (0.32%); they otherwise ranged from a minimum of 1.74% to a maximum of 23.75%. The null hypothesis was not rejected only during bear markets when sorting on P/Bs. Also noteworthy
is the fact that both portfolios showed a positive performance during economic contractions, suggesting stock markets’ tendency to anticipate economic improvements.
Graph 1 below portrays the evolution of a $1 invested in each strategy throughout the holding period. Also shown is the real return (i.e., inflation-adjusted) of the Ibovespa Index, the most comprehensive stock index for the Brazilian stock market.
Given the methodological and time frame differences, it is not possible to draw direct comparisons between our results and those of other Brazilian studies. Nonetheless, it is worth of notice that, according our computations, Braga and Leal (2004) found a 18.55 p.p. yearly value
spread on P/B-sorted portfolios. This is similar to our 17.89 p.p. spread found in a similar period (1989-1998). On the other hand, Lucena et al (2008) found a yearly spread of 53.01% p.p. (our computations), which is significantly higher than our yearly 23.30% p.p. for a similar period.
Graph 1 Evolution of a $1 invested in each strategy on a linear scale
1989 1990 1991 1992 1993 1994 1995 1996 1997 1998 1999 2000 2001 2002 2003 2004 2005 2006 2007 2008
70.00
60.00
50.00
40.00
30.00
20.00
10.00
0.00
IBOVESPA INDEX VALUE (P/E) VALUE (P/B) VALUE (P/E+P/B) GROWTH (P/E) GROWTH (P/B) GROWTH (P/E+P/B)
$
ATHANASSAKOS, George. Value versus growth stock returns and the value premium: the Canadian experience
1985-2005. Canadian Journal of Administrative Sciences,
Hamilton, v. 26, n. 2, p. 109-121, June 2009. BARBERIS, Nicholas; THALER, Richard. A Survey of Behavioral Finance. In: CONSTANTINIDES, G.M.;
HARRIS M.; STULZ, R. M. (eds.), Handbook of the
Economics of Finance. 1. ed, v. 1. Amsterdam: Elsevier, 2003.
BASU, S. Investment performance of common stocks in relation to their price-earnings ratios: a test of the
eicient market hypothesis. he Journal of Finance,
Oxford, v. XXXII, n. 3, p. 663-682, July 1977.
BRAGA, Cláudio A. B. M.; LEAL, Ricardo P. C. Ações de Valor e de Crescimento nos anos 1990. In: BONOMO, Marco (Org.). Finanças Aplicadas ao Brasil. 2. Ed. Rio de Janeiro: Editora FGV, 2004.
References
Given the spread in returns and their wide publicity, one may legitimately wonder why they persist. After all, if investors are confident that value always yields higher returns, they will bid value stock prices higher, cancelling out their oversized returns.
It seems safe to say that human behavior represents the key factor. Ferguson (2008, p. 174) argues that “so long as human expectations of the future veer from over optimism to over pessimism, from fear to greed, stock prices will tend to trace a line not unlike the jagged peaks of the Andes”. Financial history is littered with overreactions and excesses of unreasonable expectations: tulips traded at prices as high as house prices in Amsterdam (CHANCELLOR, 2000), investors greedy enough to believe in 40% returns over a 45-day stretch on the famous Ponzi scheme (KINDLEBERGER, 2005),
market value of a subsidiary higher than its holding company’s (SHILLER, 2005) or, to tread a recent terrain, the ironically called NINJA mortgages (No Income, No Job and no Assets) securitized as investment grade bonds, during the subprime bubble (Ferguson, 2008). In general, the excesses of pessimism reverberate much more fiercely than the preceding euphoria, providing excellent buying opportunities for those who do not share the apocalyptic vision then prevalent on the market. Thus, given the paramount importance of erratic human behavior, flagrantly ignored in the paradigms and models of the EMS, it is reasonable to expect that speculative bubbles, massive liquidity injections and the increase of correlations and reflexivity on global financial markets will keep on sparking exaggerated oscillations in stock prices.
4 CONCLUSIONS
Our results confirm the copious previous research on Value Investing’s risks and returns. Value premium, as measured by the spread in returns between the value and the growth portfolios, averaged a compound 25.38% a year on P/E-sorted portfolios, 18.34% on P/B-sorted portfolios and 19.22% on two-dimensional portfolios. Thus, P/E proved to be the best selection criterion.
Risk analysis suggests that value stocks are not riskier than growth stocks. Our value portfolios outperformed growth
BRAZILIAN CENTRAL BANK. Gross Domestic Product and Growth Rates. [S.l.: s.n.], 2010. Available at: <http:// www.bcb.gov.br/?INDECO>. Acessed in: Feb., 10th, 2010.
BUFFET, Warren E. Berkshire Hathaway 2009 Annual
Report. [S.l: s.n.], 2010. Available at:< http://www. berkshirehathaway.com/2009ar/2009ar.pdf>. Accessed on Feb., 10th, 2010.
CHAN, Louis K. C.; LAKONISHOK, Josef. Value and growth investing: review and update. Financial Analysts Journal, Charlottsville, v. 60, n. 1, p. 71-96, Jan./Feb. 2004.
CHANCELLOR, Edward. Devil take the hindmost: a
history of inancial speculation. Nova York: Penguin, 2000. CHIN, Jim Y.F.; PREVOST, Andrew K.; GOTTESMAN, Aron A. Contrarian investing in a small capitalization
market: evidence from New Zealand. Financial Review,
Oxford, v. 37, n. 3, p. 421-446, Aug. 2002.
DEBONDT, Werner F.; THALER, Richard H. Anomalies:
a mean-reverting walk down Wall Street. Journal of
Economic Perspectives, Nashville, v. 3, n. 1, p. 189-202,winter 1989.
____; ____. Does the stock market overreact? he Journal
of Finance, Oxford, v. XL, n. 3, p. 793-805, July 1985. DIMSON, Elroy; MUSSAVIAN, Elroy. A brief history
of market eiciency. European Financial Management,
Oxford, v. 4, n. 1, p. 91-103, 1998.
FAMA, Eugene F.; FRENCH, Kenneth R. he cross-section of expected stock returns. he Journal of Finance, Oxford, v. XLVII, n. 2, p. 427-465, June 1992.
FERGUSON, Niall. he ascent of money: a inancial
history of the world. New York: Penguin, 2008.
GALDI, Fernando Caio. Estratégias de investimento em
ações baseadas na análise de demonstrações contábeis: é possível prever o sucesso? 2008. 119p. Tese (Doutorado) - Faculdade de Economia, Administração e Contabilidade, Universidade de São Paulo, São Paulo, 2008.
GRAHAM, Benjamin. he intelligent investor. Revised
edition. New York: Collins, 2006.
____; DODD, David. Security analysis. New York:
McGraw-Hill, 1934.
____; MEREDITH, Spencer. he interpretation of
inancial statements: the classic 1937 edition. New York: HarperCollins, 1998.
GREENWALD, C. N. et al. Value investing: from Graham to
Bufett and beyond. Hoboken: John Wiley & Sons, 2001.
KINDLEBERGER, Charles P. Manias, panics, and crashes:
a history of inancial crises. Hoboken: Wiley, 2005. LAKONISHOK, Josef; SHLEIFER, Andrei; VISHNY, Robert W. Contrarian investment, extrapolation and risk. he Journal of Finance, Oxford, vol. XLIX, n. 5, p. 1541-1578, Dec. 1994.
LOPES, Alexsandro Broedel; GALDI, Fernando Caio. Does inancial statement anaylis generate abnormal returns under extremely adverse conditions? In: VII
Encontro Brasileiro de Finanças, 2007, São Paulo. Anais
eletrônicos. São Paulo: FGV, 2007. Available at: <http:// www.fucape.br/_admin/upload/prod_cientiica/Lopes_ Does_Financial.pdf>. Accessed on: Feb, 13th 2011.
MANDELBROT, Benoit. he misbehavior of markets:
a fractal view of risk, ruin & reward. New York: Basic Books, 2004.
RAMOS, Patrícia Barros; PICANÇO, Marcelo B.; COSTA Jr., Newton C. A. da. Retornos e riscos das value e growth stocks no mercado brasileiro. In: COSTA Jr, Newton C. A. da; LEAL, Ricardo P. C.; LEMBRUGER, Eduardo F. (Org.). Mercado de Capitais: análise empírica no Brasil. São Paulo: Atlas, 2000.
ROSTAGNO, Luciano Martin; SOARES; Karina Talamini Costa; SOARES, Rodrigo Oliveira. Estratégias de valor e de crescimento em ações na BM&FBovespa: uma análise de nove indicadores relacionados ao risco. In: III Encontro Brasileiro
de Finanças, 2003, São Paulo. Anais eletrônicos. São
Paulo: FGV, 2003. Available at: <http://virtualbib. fgv.br/dspace/handle/123456789/1223>. Acessed on:
December 19th 2008.
SHILLER, Robert J. Irrational exuberance. 2. ed. New
York: Currency Doubleday, 2005.
ZWEIG, Jason. Your money and your brain: how the new