Electronic copy available at: http://ssrn.com/abstract=1435300
The influence of the tag-along rights in the value of companies: an event study of the effects on
the market and service companies
Track: Corporate Finance and Financial Markets
William Eid Junior
Professor
FGV/EAESP
Escola de Administração de Empresas de São Paulo
Fundação Getúlio Vargas
Av. Nove de Julho 2029 10º andar
São Paulo Brasil CEP 01313-902
Phone: 55 11 3281-7899
Fax: 55 11 3284-1789
weid@fgvsp.br
Indexing: Eid Jr, William
Ricardo Ratner Rochman
Professor
FGV/EAESP
Escola de Administração de Empresas de São Paulo
Fundação Getúlio Vargas
Av. Nove de Julho 2029 10º andar
São Paulo Brasil CEP 01313-902
Phone: 55 11 3281-7899
Fax: 55 11 3284-1789
rrochman@fgvsp.br
Indexing: Rochman, Ricardo Ratner
Key words
Electronic copy available at: http://ssrn.com/abstract=1435300
The influence of the tag-along rights in the value of companies: an event study of the effects on the market and
service companies
Abstract:
the aim of this work is to check the effect of granting tag-along rights to stockholders by analyzing the behavior of the
return of the stock. To do so we carried out event studies for a group of 21 company stocks, divided into service provider
companies and others, who granted this right to their stockholders after Law 10,303 was passed in October, 2001. In the test
we used two models for estimating abnormal returns: adjusted to the market and adjusted to the risk and market. The results
of the tests we carried out based on these models did not capture abnormal returns (surpluses), telling us that the tag-along
rights did not affect the pattern of daily returns of the stocks of companies traded on BOVESPA (The Sao Paulo Stock
Exchange). We did not expect this result because of the new corporate governance practices adopted by companies in
Brazil.
1 Introduction
Corporate Governance is a theme that has aroused a great deal of interest because we know that differences in this area have
an impact on the value of companies and consequently on the wealth of their stockholders. The already classic work of La
Porta (1998) indicates that a level of protection for minority stockholders is reflected in the value of the stock, in other
words, an increase in the level of rights offered to minority stockholders increases the value of the company. Tag-along is
one of the rights that can be offered to the minority stockholder. It can be defined as the right of minority stockholders, in
the event of the company being sold or taken private, to receive for their stock a value, the point of reference of which is the
value paid to majority stockholders. Therefore the tag-along right is a way of aligning the interests of the different
associates of a company.
In Brazil, just as in other markets, there has been a movement in favor of the good practices introduced by Corporate
Governance. Brandão (2003) talks about the emergence of a national corporate governance movement, mentioning a series
of facts that provide evidence of such. The first is the reformulation of the Companies Law (Law 10,303 of 10/31/01) that
aimed at improving protection for minority stockholders. The second was the launch of new trading segments in Bovespa,
with Corporate Governance levels I and II. The third fact refers to the launch in 2002 of the Capital Markets Master Plan,
approved and accepted by a number of entities in the market. The BNDES’ [National Development Bank] Incentive
Program for Adopting Corporate Governance Practices is the fourth fact mentioned by the author. The fifth fact is the
concern expressed by various participants in the market with those who have an interest in companies, the so-called
Governance, coming from bodies like the CVM – the Securities Exchange Commission, – and IBGC – the Brazilian
Institute for Corporate Governance.
In this atmosphere it is quite appropriate to question if these Corporate Governance practices are perceived by stockholders
in Brazil as adding value. This work aims to reply in part to this question. In Brazil various companies listed on the Bovespa
have granted the tag-along right over the last few months. We want to identify if there was any alteration in the value of
these companies because this right was granted, in other words, if stockholders see it as something of value.
2 Bibliographic review
In trying to find an economic explanation for the existence of agreements between stockholders, among which we can
include the right of tag-along, Chemla, Habib and Ljunggvist (2002) show that they are put together with the intention of
avoiding renegotiation in an atmosphere where the value of companies depends on investments and mechanisms for
transferring wealth between stockholders. Stockholder agreements preserve the incentives for making investments and
minimizing transfers between stockholders.
In a similar conceptual discussion, Rabelo and Coutinho (2001) argue that an improvement in Corporate Governance
practices is fundamental for the development of the capital market and that the successive crises through which the country
has passed over the last 20 years have in some way or another hampered the development of these practices. They also
show that the control of companies in Brazil is exercised by few stockholders and that protection of minority stockholders
should be one of the objectives pursued by the regulatory bodies; this is one of the factors that will be able to increase the
level of internal financing available to companies.
Different empirical studies have been carried out in Brazil over the last few years trying to identify the impact of alterations
in the rights of minority stockholders on the value of the company.
Ribeiro Neto and Famá (2001) studied the impact of the New Corporation Law (emending Law 6404/76) approved by the
House of representatives on March 28, 2001. This emending law altered some clauses of the Law that was in force at the
time, such as the proportion between common and preferred stock, which went from a maximum of 2/3rds preferred to
50%. The article that dealt with the valuation of stocks in case a stockholder withdrawing from the company or the company
going private was also altered, in favor of an economic valuation of the stock. Also, and principally, a tag-along right of
80% of the value paid for the controlling block of stock in the case of the disposal of the company is included in the
emending law. Using the Event Study methodology on the difference in price between the ordinary and preference stock of
35 companies and presuming that the new legislation is of benefit to ordinary stockholders, the authors conclude that;
the companies studied 77% (27 companies) had some type of increase in the value of their common stocks. On the contrary the preferred stocks of nearly 51% (18 companies) of the companies declined in value. As the facts show, common stocks increased in value nearly 8 times more than preferred stocks. ....Neverthelss, it is clear that the market has been reacting to the changes that might come about as a result of the new legislation”.
Carvalho (2003) studies the effect of the migration of 22 companies to Bovespa levels I and II, by analyzing the impact of
this migration on the price, volumes and liquidity of the companies. The author argues that voluntary adherence to
Corporate Governance regimes that give greater protection to minority stockholders is an alternative to the imposition of
legal rules, since the latter come up against resistance from economic groups that are in control of the companies because
the value of their controlling share will fall with the imposition of greater protection for minority stockholders. The author
finds a positive effect on the value of companies, in other words, there is an abnormal positive return around the event
window. Nevertheless it is not possible to determine the size of this abnormal return since it is not clear how long the event
window lasts. The author also notices that there was an increase in the volume negotiated, an increase in liquidity and a
reduction in the sensitivity to macro-economic factors. In short, migration to Bovespa’s levels I and II of Corporate
Governance benefited the owners of stock in these companies.
Saito (2003) analyses the determinants of the difference in price between the common and preferred stocks of 53 companies
listed on Bovespa, selected by criteria associated with their liquidity. One of the highlights in this study refers to the impact
seen when the tag-along right was withdrawn by Law 9457 in May, 1997 and its reinstatement by Law 10,303 of October,
2001 (the same studied by Ribeiro Neto and Famá (2001) while it was still in the emendation stage). The result of this
analysis confirms the importance of the rights granted to minority stockholders, since the prize of the right to vote is
significantly altered in the two events, always in the direction to be expected from the theoretical framework.
It is important to emphasize that the empirical studies carried out in Brazil until now on corporate governance have used as
an event occurrences of a general nature, such as the approval of a new law or the migration to levels of corporate
governance. In this study we are proposing studying a specific event: the incorporation of the tag-along right for each one of
the companies in the sample.
3 Methodology
In this work we have used the technique of events’ study to evaluate the effect of the tag-along right in the price and return
of the stocks of the companies in the sample.
The technique of event study starts with the hypothesis that a particular fact or event affects the value of the company and
of an abnormal return is one of the most important in the event study. Considering that the price of a company’s stocks and
the market are continually subject to a great variety of factors, we need to choose an appropriate reference index to control
the effects of those facts not related to the event being studied.
We can define the empirical model of the stock returns of the company for those periods in which the event did not occur in
the following way:
t i t it
B
R
=
.
β
+
ε
where
average.
zero
with
term
random
the
is
and
portfolio;
market
the
o
relation t
in
i
stock
of
beta
example,
for
,
parameters
of
vector
the
is
t;
date
on
portfolio
market
the
of
return
the
example,
for
s,
t variable
independen
of
vector
the
is
t;
period
in the
i
stock
the
of
return
the
is
=
=
=
=
t i t itB
R
ε
β
For the periods in which the event occurred the empirical model is as follows:
t i
t
it
B
FG
R
=
.
β
+
+
ε
where
F = is the vector of characteristics of the company influencing the impact of the event in the process of the return on the stock
G = is the vector of parameters measuring the influence of F on the occurrence of the event.
In order to capture the change in the empirical model of returns we used the procedure proposed by Campbell, Lo and
MacKinlay (1997), who described the main steps in the process for studying the impact of the event on the returns of the
stock of the company as: definition of the event; selection of the sample; measurement of the sample return; procedure for
estimating; test procedure; empirical results; interpretation and conclusions.
In this work we defined as an event the date of the approval of the tag-along right at an extraordinary, or ordinary general
meeting of the stockholders of the company, after Law 10,303 of October 31, 2001 was passed.
In the Brazilian market we found 37 companies that met our definition of the event. We limited the study, however to those
necessary to estimate the parameters of the models and for the tests. Therefore the sample in this article is made up of the
following 21 stocks traded on BOVESPA and their respective companies:
Name Code Tag-Along
Date
Tag-Along Ord %
Tag-Along
Pref % Listing Level
Bco Itau Holding ITAU4 30/04/2002 80 80 Level 1
BBDC3 17/12/2003 80 100 Level 1 BBDC4 17/12/2003 80 100 Level 1 BBAS3 07/06/2002 100 - Traditional BBAS4 07/06/2002 100 - Traditional
Braskem BRKM5 16/08/2002 100 100 Level 1
Celesc CLSC6 17/06/2002 100 100 Level 2
Coteminas CTNM4 21/08/2002 80 80 Traditional
Duratex DURA4 16/12/2002 80 80 Traditional
Eternit ETER3 27/12/2002 80 80 Traditional
F Cataguazes FLCL5 14/02/2003 80 80 Traditional
Gerdau GGBR4 30/04/2002 100 100 Level 1
Itausa ITSA4 29/04/2002 80 80 Level 1
Marcopolo POMO4 21/08/2002 100 80 Level 2
Net PLIM4 02/05/2002 100 100 Level 2
Perdigão PRGA4 17/12/2002 80 80 Level 1
Randon Part RAPT4 10/12/2002 80 80 Level 1
Rhodia-Ster RHDS3 23/04/2002 80 80 Traditional
Sabesp SBSP3 18/04/2002 100 - New Market
Ultrapar UGPA4 22/03/2002 100 100 Traditional
Weg ELMJ4 18/11/2002 80 80 Level 1
Bradesco
Banco do Brasil
Table 1. Stocks and companies that go to make up the sample, the dates of the events, types of tag-along and listing segment
for the stock on BOVESPA.
The tests we carried out were the following:
a) With the sample of 21 stocks without any type of segregation;
b) Segregating the service companies from the others;
c) Segregating the companies that granted 100% tag-along for the minority common stockholders of the others.
The companies considered as financial service providers or utilities are: Bco Itau Holding Financ, Bradesco, Banco do
Brasil, Celesc, Itausa, Net, Sabesp, and Ultrapar.
The companies that granted tag-along of 100% for minority common stockholders are: Banco do Brasil, Braskem, Celesc,
Gerdau, Marcopolo, Net, Sabesp, Ultrapar.
The data source for the quotation of prices was the ‘Economática’ system and the source of information about tag-along
rights and the companies were BOVESPA and the ‘Economática’ system.
We noted that during 2002, after Law 10,303/01 was passed, companies granted or reinstated the right of tag-along to their
stockholders and a large number of these companies are to be found in the differentiated listing segments on BOVESPA
In an event study we need to define a period of time in which the data are used to estimate the parameters of the models
employed; we call this the estimation window. In addition we defined a period around this window for testing the event for
the model chosen; we called this the event window. We adopted an estimation window comprising 80 daily observations of
the stock quotations or returns. The event window on the other hand can be 22, 11 or 5 observations prior to and after the
date of the event, exclusive.
We want to test the significance of the abnormal returns in a window of time around the date or the event, or test the null
hypothesis that the expected value of the cumulative abnormal returns in the event window is equal to zero. Continuing with
the study we first of all estimated the abnormal returns, ex-post, which can be obtained from the difference between the returns of the company observed in the event window and the expected return of the company supplied by the reference
model. The estimation models of the abnormal returns can be divided into two major categories: statistical models that do
not depend on economic financial argumentation and economic financial models.
Brown and Warner (1980, 1985) quote the main statistical models for estimating abnormal returns: models adjusted to the
average; models adjusted to the market; and models adjusted to the risk and market. Kloeckner (1995) shows that the three
statistical models present similar results when it comes to estimating abnormal returns.
Campbell, Lo and MacKinlay (1997) present the main economic financial models that we are based on pricing models such
as CAPM (Capital Asset Pricing Model) or APT (Arbitrage Pricing Theory).
In this work we shall estimate the abnormal returns using the model adjusted to the market and the one adjusted to the risk
and market. The Brazilian stock market in this study will be represented by the closing Brazil Index (IBrX), as calculated by
BOVESPA and made up of the 100 most liquid stocks in the market.
In the return model adjusted to the market the abnormal returns are estimated from the difference between the stock return
and the market portfolio return in the same period. In this way, for each stock we determined the abnormal returns in the
period analyzed. Therefore the abnormal return of stock, “i” on date “t” is given by:
t.
date
on
market
the
of
return
t;
date
on
i
stock
of
return
t;
date
on
i
stock
of
return
abnormal
the
where
=
=
=
−
=
mt it
it
mt it it
R
R
AR
R
R
AR
Daily returns are obtained from the daily quotations of the closing price of the stocks that go to make up the sample,
( ) ( )
t.
date
on
i
stock
of
quotation
closing
t;
date
on
i
stock
of
return
the
where
ln
ln
1
=
=
−
=
− it it it it itP
R
P
P
R
The premise of the model of returns adjusted to the risk and market is that the abnormal returns of the stocks can be seen
from the difference between the individual returns observed and the returns calculated using a simple factor model. The
simple factor model is estimated using the data from the estimation window and a linear regression by means of ordinary
leasts squares. Therefore abnormal returns are given by:
(
)
t.
date
on
return
market
return;
market
the
o
relation t
in
i
stock
of
regression
of
t
coefficien
angular
return;
market
the
o
relation t
in
i
stock
of
regression
of
t
coefficien
linear
t;
date
on
i
stock
of
return
the
t;
date
on
i
stock
of
return
abnormal
the
where
=
=
=
=
=
+
−
=
mt i i it it mt i i it itR
R
AR
R
R
AR
β
α
β
α
The excess, or abnormal returns, are then accumulated in the event windows, in the variable cumulative abnormal return
(CAR), in the following way:
ow.
event wind
sample;
-sub
or
sample
in the
stocks
of
number
t;
date
on
i
stock
of
return
abnormal
the
where
CAR
1 t a t
-=
=
=
=
∑ ∑
− =t
N
AR
N
AR
it t t N i it( )
( )
ow.
event wind
event;
the
to
prior
period
control
in the
companies
the
of
returns
abnormal
the
of
deviation
standard
the
is
AR
s
t;
t to
-from
goes
that
period
event
for the
return
abnormal
cumulative
the
where
1
.
2
CAR
Test
-t a t
=
=
=
+
=
−t
CAR
t
AR
s
tat 4 ResultsThe methodology was used for the stocks in the sample considering the 2 abnormal return models presented, for event
windows of 22, 11 and 5 trading days prior to and after the event date, for the sample of 21 service or non-service
companies and for companies that did or did not grant 100% tag-along rights to their minority common stockholders. In
every case the estimation window contained 80 trading days prior to the event window.
Because of space limitations we shall only present tables with the results of the general aggregation of the returns of the
stocks in the sample in every period in the event window. The aggregation of the returns of each individual stock and the
returns of the stocks in the sample for each date in the event window separately did not generate significantly statistical
cumulative abnormal returns for the models adjusted to the market, or adjusted to the risk and market; nor did the sample of
21 companies, nor when we separated the sample into service companies, or those that granted 100% tag-along rights. One
possible reason for this is that the size of the sample, just 21 stocks, was a limiting factor as far as this test was concerned.
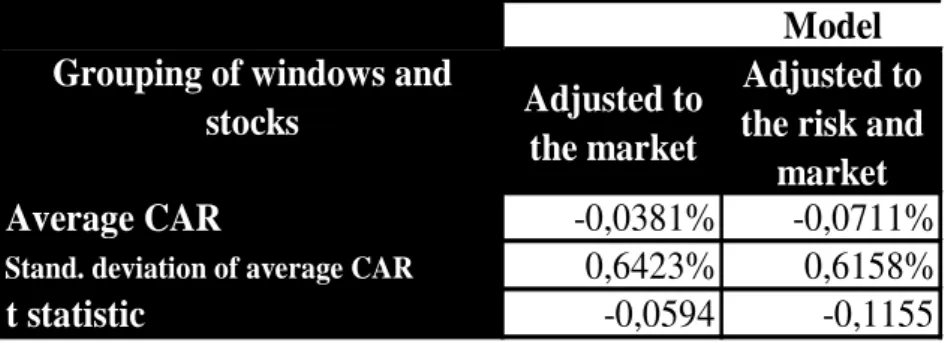
The results grouped together for each type of model and size of event window are shown in the following tables:
Adjusted to
the market
Adjusted to
the risk and
market
Average CAR
-0,0381%
-0,0711%
Stand. deviation of average CAR0,6423%
0,6158%
t statistic
-0,0594
-0,1155
Grouping of windows and
stocks
Model
Table 2. Results of the grouping of abnormal returns between stocks and trading days in the event window of 22 days prior
Adjusted to
the market
Adjusted to
the risk and
market
Average CAR
-0,0260%
-0,0472%
Stand. deviation of average CAR
0,5961%
0,6148%
t statistic
-0,0437
-0,0768
p value of test t
96,51751%
93,88061%
Grouping of windows and
stocks
Model
Table 3. Results of the grouping of abnormal returns between stocks and trading days in the event window of 11 days prior
to and after, for the sample of 21 stocks.
Adjusted to
the market
Adjusted to
the risk and
market
Average CAR
0,1757%
0,2129%
Stand. deviation of average CAR
0,6364%
0,6546%
t statistic
0,2761
0,3252
p value of test t
78,25027%
74,50350%
Grouping of windows and
stocks
Model
Table 4. Results of the grouping of abnormal returns between stocks and trading days in the event window of 5 days prior to
and after, for the sample of 21 stocks.
Grouping of windows and stocks
Model
Adjusted to the
market
Adjusted to the risk
and market
Average CAR -0.1581% -0.1071%
Standard deviation of average CAR 0.9356% 0.9164%
t statistic -0.1690 -0.1169
p value of test t 86.582% 90.694%
Table 5. Results of the grouping of abnormal returns between stocks and trading days in the event window of 22 days prior
Grouping of windows and stocks
Model
Adjusted to the
market
Adjusted to the risk
and market
Average CAR -0.0397% 0.0640%
Standard deviation of average CAR 1.0346% 1.0060%
t statistic -0.0384 0.0636
p value of test t 96.939% 94.929%
Table 6. Results of the grouping of abnormal returns between stocks and trading days in the event window of 11 days prior
to and after, for the sample of stocks of service provider companies.
Grouping of windows and stocks
Model
Adjusted to the
market
Adjusted to the
market and risk
Average CAR 0.2771% 0.3603%
Standard deviation of average CAR 1.1745% 1.1537%
t statistic 0.2359 0.3123
p value of test t 81.35116% 75.47919%
Table 7. Results of the grouping of abnormal returns between stocks and trading days in the event window of 5 days prior to
and after, for the sample of stocks of service provider companies.
Grouping of windows and stocks
Model
Adjusted to the market
Adjusted to the risk
and market
Average CAR -0.2084% -0.2048%
Standard deviation of average CAR 0.8927% 0.8911%
t statistic -0.2335 -0.2299
p value of test t 81.537% 81.819%
Table 8. Results of the grouping of abnormal returns between stocks and trading days in the event window of 22 days prior
Grouping of windows and stocks
Model
Adjusted to the market
Adjusted to the risk
and market
Average CAR -0.1475% -0.0585%
Standard deviation of average CAR 0.8659% 0.9144%
t statistic -0.1703 -0.0640
p value of test t 86.477% 94.896%
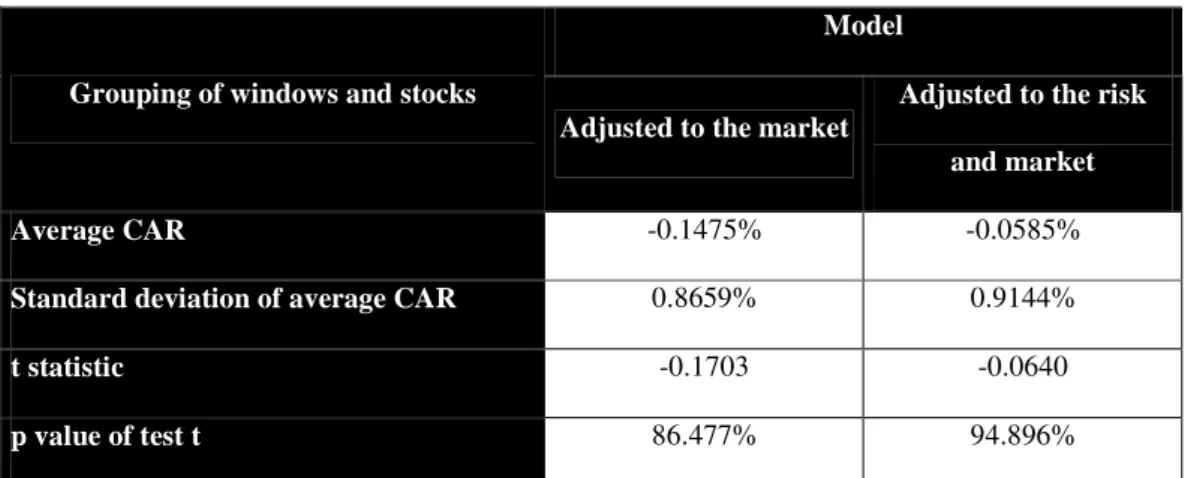
Table 9. Results of the grouping of abnormal returns between stocks and trading days in the event window of 11 days prior
to and after, for a sample of stocks of companies that granted 100% tag-along rights to minority common stockholders.
Grouping of windows and stocks
Model
Adjusted to the market
Adjusted to the risk
and market
Average CAR -0.1113% 0.0170%
Standard deviation of average CAR 1.0613% 1.1235%
t statistic -0.1049 0.0152
p value of test t 91.644% 98.790%
Table 10. Results of the grouping of abnormal returns between stocks and trading days in the event window of 5 days prior
to and after, for a sample of stocks of companies that granted 100% tag-along rights to minority common stockholders.
We can see from the above tables that the results of the models adjusted to the market and adjusted to the risk and market
are similar and consistent, as Kloeckner (1995) states, and in the case of this article these 2 models did not produce any
significant result. Therefore we cannot reject the null hypothesis that the expected cumulative abnormal returns are equal to
zero. We also carried out tests with the sub-samples of the companies that were not service providers and companies that
did not grant 100% tag-along rights on common stocks and the results also did not produce any significant result as far as
the presence of abnormal returns in the event windows are concerned.
5 Conclusions
The aim of this study is to analyze the effect of granting tag-along rights to stockholders in companies in general, or in
service provider companies. To do so we carried out event studies for a series of stocks of companies that have recently
Based on the two models we used the results of the tests were not contradictory. The statistical models did not capture
excess (abnormal) returns, indicating that the tag-along right did not affect the pattern of daily returns of the stocks of
companies traded on BOVESPA. Because of the new practices of corporate governance used by Brazilian firms, we were
not expecting to get this result.
The demand for better governance practices made by the international and national financial bodies, such as the BNDES,
before they would provide investment funds, and the greater limits for buying stocks that have better governance made by
pension funds, encouraged companies listed on BOVESPA to grant the tag-along right after the contents of Law 10,303/01
became public knowledge.
In the future we can redo this study with greater number of companies who gave the tag-along right and improve the
parameter estimates of the Brownian geometric motion.
References
ADLER,R.J.,FELDMAN R.E.,TAQQU,M.S.(1998)“APractical Guide to Heavy Tails”, Boston: Birkhäuser.
BRANDÃO,M.M.(2003)“Uma Visão sobre a Governança Corporativa das Companhias Abertas Nacionais”, Tríade do
Mercado, Apimec MG -www.apimecmg.com.br/nucleos/governanca/art03.pdf
BROWN, S., WARNER, J. (1980) “Measuring security price performance.”, Journal of Financial Economics, v. 8, n.3. BROWN, S., WARNER, J. (1985) “Using Daily Stock Returns. The case of Event Studies.”, Journal of Financial Economics,
v. 4, p.3-31.
CAMPBELL, J., LO, A W., MACKINLAY, A. (1997) The Econometrics of Financial Markets. New Jersey: Princeton
University Press.
CHEMLA,G.;HABIB,M.&LJUNGQVIST,A.(2002)“An Analysis of Shareholder Agreements”, Working Paper CLB-02-001, New York University http://papers.ssrn.com/sol3/papers.cfm?abstract_id=299420
FELLER, W. (1971) “An Introduction to Probability Theory and its Applications”, v.2, 2a edição. New York, John Wiley & Sons.
KLOECKNER, G. (1995) “Estudos de Evento: A análise de um método.”, Revista Brasileira de Administração Contemporânea. v.1, n.2, set., p.261-270, 1995.
LA PORTA,R.;LOPEZ-DE-SALINES,F.&SHLEIFER,A.(2000) “Investor Protection and Corporate Governance”, Journal of Financial Economics, v.59, n.1-2, p.3-27 .
RABELO,F.M&COUTINHO,L(2001)“Corporate Governance in Brazil”, OECD Development Centre -
http://www.oecd.org/dataoecd/9/62/2443323.pdf
RIBEIRO NETO,R.M.&FAMÁ,R.(2001)“Eficiência de Mercado: O impacto da Nova Lei das Sociedades Anônimas –
Análise do Comportamento das Ações do Ibovespa no Período de 02/01/2001 a 09/04/2001”, Anais do V Semead
http://www.fia.com.br/labfin/pesquisa/artigos/arquivos/233.pdf