Research Article
New method for determination of (
E
)-resveratrol in wine based on microextraction
using packed sorbent and ultra-performance
liquid chromatography
An ultra-fast and improved analytical methodology based on microextraction by packed sorbent (MEPS) combined with ultra-performance LC (UPLC) was developed and vali-dated for determination of (E)-resveratrol in wines. Important factors affecting the performance of MEPS such as the type of sorbent material (C2, C8, C18, SIL, and M1), number of extraction cycles, and sample volume were studied. The optimal conditions of MEPS extraction were obtained using C8 sorbent and small sample volumes (50–250mL) in one extraction cycle (extract–discard) and in a short time period (about 3 min for the entire sample preparation step). (E)-Resveratrol was eluted by 1250mL of the mixture containing 95% methanol and 5% water, and the separation was carried out on a high-strength silica HSS T3 analytical column (100 mm2.1 mm, 1.8mm particle size) using a binary mobile phase composed of aqueous 0.1% formic acid (eluent A) and methanol (eluent B) in the gradient elution mode (10 min of total analysis). The method was fully validated in terms of linearity, detection (LOD) and quantification (LOQ) limits, extraction yield, accuracy, and inter/intra-day precision, using a Madeira wine sample (ET) spiked with (E)-resveratrol at concentration levels ranging from 5 to 60mg/mL. Validation experiments revealed very good recovery rate of 9575.8% RSD, good linearity withr2 values40.999 within the established concentration range, excellent repeatability (0.52%), and reproducibility (1.67%) values (expressed as RSD), thus demonstrating the robustness and accuracy of the MEPSC8/UPLC-photodiode array (PDA) method. The LOD of the
method was 0.21mg/mL, whereas the LOQ was 0.68mg/mL. The validated methodology was applied to 30 commercial wines (24 red wines and six white wines) from different grape varieties, vintages, and regions. On the basis of the analytical validation, the MEPSC8/UPLC-PDA methodology shows to be an improved, sensitive, and ultra-fast
approach for determination of (E)-resveratrol in wines with high resolving power within 6 min.
Keywords: (E)-Resveratrol / Microextraction by packed sorbent / Ultra-performance LC / Wine
DOI 10.1002/jssc.201100336
1
Introduction
In the last decades, the increased consumption of table grapes and wines has been encouraged by their reported clinical health benefits including cardiovascular diseases,
brain degeneration, and certain carcinogenic diseases [1–3]. These benefits are mainly attributed to the occurrence of polyphenol compounds such as stilbenes, anthocyanins, catechins, proanthocyanidins, and other phenolics. These compounds are usually present in the higher plants, but reach a higher concentration in red wine grapes than in white varieties [2], and play a very important role in wine quality, since they contribute to the wine organoleptic characteristics, such as colour (anthocyanins) and flavour, astringency (tannins), bitterness, haze formation and interaction with proteins during wine oxidation [4, 5]. Moreover, they act as potent anti-oxidants, reinforcing the anti-oxidant system against reactive oxygen species and reactive nitrogen species.
Among stilbenes, the phytoalexin (E)-resveratrol ((E)-3,40,5-trihydroxystilbene) is synthesized by several plants in
Joa˜ o Gonc
-alves
Jose´ S. Caˆ mara
CQM – Centro de Quı´mica da Madeira, Centro de Cieˆncias Exactas e da Engenharia da Universidade da Madeira, Campus Universita´rio da Penteada, Funchal, Portugal
Received April 13, 2011 Revised May 6, 2011 Accepted June 10, 2011
Abbreviations: BIN, barrel insert and needle; HSS, high-strength silica; MEPS, microextraction by packed sorbent; PDA, photodiode array; SCX, strong cation exchange; UPLC, ultra-performance LC
Correspondence:Professor Jose´ S. Caˆmara, CQM – Centro de Quı´mica da Madeira, Centro de Cieˆncias Exactas e da Engenhar-ia da Universidade da Madeira, Campus Universita´rio da Penteada, 9000-390 Funchal, Portugal
response to stress, injury, UV radiation, and fungal infec-tion [6]. It is found in several plant species, especially in grapes (Vitis vinifera) [7], peanuts (Arachis hypogea), blue-berries (Vacciunum sp.), cranblue-berries (Vaccinium macro-carpon), and several other food plants [8]. It exists naturally in two isomeric forms, (Z)-and (E)-isomers. The amount and isoforms in wines are affected by a number of factors including variety, growing conditions of the grapes, fungal presence, geographical origin, winemaking processes, and wine storage [9–11]. The (E)-isomer occurs predominantly and has been shown to be the form more biologically active. However, reports of the presence of the (Z)-isomer, in certain wines, are attributed to photo-isomeric conversion, enzyme action during fermentation, or release from vini-ferins [8].
This phytochemical has attracted attention from biolo-gists and chemists due to its numerous putative health benefits including anti-oxidative, anti-inflammatory, platelet aggregation, inhibitory, anti-estrogenic, anti-cancer, as well as chemopreventive activities, and reduction of the effects of some neurological diseases, such as Alzheimer or Parkinson [12–18]. Moreover, (E)-resveratrol has been reported to promote anti-proliferative and pro-apoptotic activities [19, 20], anti-inflammatory effects against lipopolysacchar-ide-induced arthritis [21], and to inhibit tumour growth in a xenograft mouse model of neuroblasoma [19]. Kenealey et al. [19] demonstrated that (E)-resveratrol alone is taken up into tumour cells, induces a rise in [Ca12]
i, and ultimately leads to a decrease in tumour cell viability.
Different sample work-up procedures reported to determine (E)-resveratrol in wines and dietary products are usually based on liquid–liquid extraction and solid-phase extraction (SPE) [22, 23]. In the recent years, miniaturized sample preparation analytical techniques, namely, solid-phase microextraction by direct immersion [24, 25], and stir bar sorptive extraction [26–28], has gained attention due to its many special features over classical approaches. Among many advantages, usage of little or no solvent, increasing sensitivity of analysis, and user-friendly system, should be pointed out. Another miniaturized technique is the micro-extraction by packed sorbent (MEPS), developed from the conventional SPE packed bed devices from mL bed volumes to mL volumes [29, 30]. Briefly, when the sample passed through the solid support, the analytes are adsorbed to the solid phase packed in a barrel insert and needle (BIN) [24, 25]. The cartridge bed can be packed or coated to provide selective and suitable sampling conditions. Any sorbent material such as silica-based (C2, C8, C18), strong cation exchanger (SCX) using sulfonic acid-bonded silica, restricted access material, HILIC, carbon, polystyrene– divinylbenzene copolymer, or molecularly imprinted poly-mers, can be used. This technique has been used to extract a wide range of analytes including drugs from biological samples [31–34], polycyclic aromatic hydrocarbons, and semi-volatile residues in water [35, 36], analysis of small brominated and chlorinated aromatic compounds in wine [37], flavonoid content in fruit juice [38], phenolic
anti-oxidants from cereal products [39], and environment pollutants [40].
Quantitative analysis of (E)-resveratrol is commonly performed by means of high-performance liquid chroma-tography (HPLC) connected to a diode array detector or a triple quadrupole mass spectrometer [26, 27, 41–48]. In order to increase the selectivity and sensibility of the analytical method the analysis of these kinds of compounds should be performed by using a fluorescence detector. Recently, ultra-performance LC (UPLC) has become a wide-spread technique and new trend in separation sciences being regarded as a new direction for LC. Using sub-2mm particles and mobile phases at high linear velocities, and instrumentation that operates at higher pressures than those used in HPLC, dramatic increases in resolution, sensitivity, and speed of analysis can be obtained [43].
To date, no references have been found to the combi-nation of MEPS-UPLC for (E)-resveratrol analysis. Conse-quently, this study proposes the first determination of this phytochemical in wines from different grape varieties, vintages, and regions, through an ultra-fast, sensitive, effi-cient, and high-throughput MEPS-based technique in combination with UPLC-photodiode array (PDA) system. The chromatographic system includes a binary solvent manager that delivers up to 15 000 psi pressure, a PDA detector with spectra in the range of between 200 and 400 nm, a 1.8mm particle size analytical column, and a sample manager with small injection volume used (2mL). Fortified samples of Enxurros wine (ET) were used to eval-uate the performance of the developed method. Some factors influencing the MEPS extraction efficiency of (E)-resveratrol, such as type of sorbent material, number of extraction cycles (extract–discard), and sample volume, were evaluated and optimized.
2
Materials and methods
2.1 Solvents and materials
2.2 UPLC-PDA analysis
Chromatographic separation of (E)-resveratrol was performed on a Waters Acquity H-Class quaternary solvent manager UPLC system (Waters, Milford, MA, USA, purchased through Via Athena-Gesta˜o de Laborato´rios, Lda.) equipped with a Waters Acquity PDA detection system, an Acquity UPLC (HSS T3) analytical column (100 mm2.1 mm, 1.8mm particle size), a binary gradient pump, a column oven, and a degassing system and driven by the Waters Empower software v2.0. The column temperature was maintained at 401C. A gradient mobile-phase system was used with eluent A being aqueous 0.1% formic acid and eluent B being methanol. The 10 min gradient started with 80% eluent A then decreased to 70% A (0.5 min), 68% A (1 min), 20% A (8 min), and finally increased to 80% A (10 min). The flow rate was 250mL/min, gave a maximum back pressure of 6.000 psi, which is within the capabilities of the UPLC, and the injection sample volume was 2mL. The system was re-equilibrated with the initial composition for 3 min, prior to next injection. All samples were filtered through 0.22mm Millipore membrane filters. The target compound eluted within 6 min, while the additional equilibration at the initial mobile-phase composi-tion resulted in a total analysis time of 13 min. The UV detection wavelength was set to the maximum of absor-bance (lmax5305 nm) (Table 1) for the compounds of interest and the Empower 2 software was used for chromatographic data gathering and integration of chroma-tograms. The identification of (E)-resveratrol was based on the retention time (RT) and UV spectrum.
2.3 Wine samples and sample preparation
The methodology was applied to 30 representative commer-cial table wines available from different regions of Portugal, Madeira, Azores, and Canary Islands (Table 3), different varieties and vintages, which were produced according to standard procedures and defined varietal composition.
Wine samples were dealcoholized under vacuum at 401C, up to 1/4 of initial volume, in order to avoid the negative effect of ethanol in the extraction efficiency. The volume of dealcoholized wine was adjusted to the wine initial volume sample with the initial mobile phase (solution
containing 80% formic acid aqueous solution at 0.1 and 20% methanol). The pH of this solution was adjusted to 2.7 with 30% v/v acetic acid.
2.4 Preparation of standard and spiking of samples
A stock standard solution of (E)-resveratrol of 1000mg/mL was prepared by exactly weighing suitable amount of pure substance and dissolving in methanol. The solution was stored at 181C in dark. At these conditions it was stable for at least 2 months (as assessed by UPLC assays). Inter-mediate working standard solution, containing (E)-resvera-trol at 100mg/mL, was prepared by appropriate dilution of the stock solution in mobile phase used at the initial step of gradient elution, and stored under refrigeration at 41C during. This standard was used both to spike the matrix in order to optimize the extraction conditions and for the validation study. Calibration standard with concentrations ranging from 5 to 60mg/mL were prepared daily. Before injection in the chromatographic system, the eluate was filtered through Millipore membrane PTFE filter (0.22mm particle size).
2.5 Optimization of MEPS factors affecting the performance
The MEPS procedure was carried out by means of an SGE Analytical Science (I.L.C., Lisbon, Portugal) apparatus, consisting of a 250mL gas-tight syringe with a removable needle. The syringe was fitted with a BIN containing 4 mg of the sorbent material and was used to draw and discharge samples and solutions through the BIN. An ET red wine sample spiked with a known amount of (E)-resveratrol was used to optimize the MEPS procedure. Several important extraction parameters such as the type of sorbent material, number of extraction cycles, and sample volume were evaluated [49].
The performance of the five MEPS sorbent materials: C2 (ethyl-silica), C8 (octyl-silica), C18 (octadecyl-silica), SIL (unmodified silica) and M1 (a mixed-mode sorbent containing 80% C8 and 20% SCX) was tested and compared, in order to select the best sorbent for the deter-mination of (E)-resveratrol. C2–C8 phases are suitable for
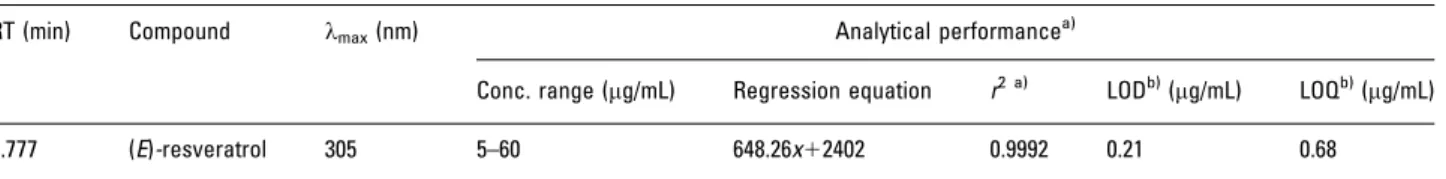
Table 1. Peak identification, RT, and results of regression for total area versus concentration and analytical performance for bioactive metabolite ((E)-resveratrol) using the newly developed methodology, MEPSC8/UPLC-PDA
RT (min) Compound lmax(nm) Analytical performancea)
Conc. range (mg/mL) Regression equation r2 a) LODb)(mg/mL) LOQb)(mg/mL)
5.777 (E)-resveratrol 305 5–60 648.26x12402 0.9992 0.21 0.68
a)r2: Correlation coefficient, gives an estimation how well the experimental points fit a straight line.
lipophilic analytes (non-polar) and polymeric phases such as polystyrene-divinylbenzene or mixed-mode phases (anion– cation exchange mode) are suitable for polar analytes such as acidic and basic compounds [30].
In order to select the number of extraction cycles (extract– discard) and sample volume, fortified ET wine samples were pumped up and down once, five and ten times with 50, 100 and 250mL of sample. The flow rate during aspiration is limited to 20mL/s to prevent cavitation. This will increase analyte/sorbent contact time and extraction efficiency. All optimization procedures were carried out in triplicate.
2.5.1 MEPS procedure
MEPS experiments were conducted using 4 mg of solid-phase material (C8 sorbent selected, in the optimization step, as the best sorbent to isolate the target analyte). Before being used for the first time, the sorbent was manually conditioned first with 100mL methanol and then with 100mL water (0.1% formic acid). This step activates the sorbent and ensures reproducible retention of the (E)-resveratrol [49]. A sample aliquot of 250mL was passed through the C8 sorbent once at a flow rate of about 20mL/s. The solid phase was then washed with 100mL of water containing 0.1% formic acid to remove interferences, at a speed of 50mL/s. The target analyte was then eluted with 250mL of 95% methanol and 5% water directly into a vial. Between every extraction, the sorbent was rinsed with 100mL methanol followed by 100mL of the washing solution. This step decreased memory effects (carry-over), but also functioned as the conditioning step before the next extraction. The extracts were filtered through Millipore membrane PTFE filters (0.22mm particle size). An aliquot of 2mL of this solution was injected in triplicate into the UPLC-PDA system. The same packing bed was used for about 100 extractions; then it was discarded due to both the low analyte extraction yields and clogging of the sorbent. All MEPS steps including activation, loading, washing and elution were carried out manually.
2.6 Method validation
The MEPSC8/UPLC-PDA method was validated in terms of
linearity, precision (intra- and inter-day), sensitivity (limit of
detection (LOD) and limit of quantification (LOQ), accuracy, and extraction yields achieved.
Linearity was studied by injecting solutions of bioactive phenolic at six different concentration levels, in triplicate for each point, in order to cover the whole working range. Calibration curve for (E)-resveratrol with the respective correlation coefficient was calculated by least-squares linear regression analysis of the peak area (Table 1).
Method sensitivity was assessed by the determination of LOD and LOQ. The calculations for LOD were based on the SD ofy-intercepts of regression analysis (s) and the slope (S), using the equation LOD53.3 s/S [50]. LOQs were calculated by the equation LOQ510s/S, wheresis the SD of the intercept andSis the slope.
Method accuracy was determined by successive extrac-tions of a standard solution of (E)-resveratrol at three concentration levels: low, medium, and high (Table 2). This standard was added to Enxurros wine samples whose analyte concentration was previously analyzed; then the mixture was subjected to the MEPS procedure above (Section 2.5.1). Recovery values were calculated according to the flowing formula:Accuracy5[analyteafter spiking]–
[analyte]before spiking/[analyte added]100. For the extraction
yields study, Enxurros wine samples were prepared at three concentration levels (Table 2) and were subjected to the MEPS procedure and injected in the UPLC-PDA system. Extraction yields (%) were calculated from the peak area of a blank wine (wine without (E)-resveratrol) spiked with a standard solution of (E)-resveratrol) at 10mg/mL (Aw) and
the mean peak area (n56) of this standard solution (Ass) as
follows: % extraction yield5(Aw/Ass)100%.
For method precision, standard solution of (E)-resvera-trol treated by MEPS at three different concentration levels were measured in six replicates (n56) in the same day to obtain repeatability (intra-day precision), and six times over three different days to obtain intermediate precision (inter-day precision, reproducibility), both expressed as %RSD, which describes the closeness of agreement between series of measurements.
The selectivity of the method was assessed by the absence of interference in the same RT as (E)-resveratrol analysing a standard solution of (E)-resveratrol at the concentration of 10mg/mL. (E)-Resveratrol-free wine sample was also analysed to assess the capacity of sample pretreatment to eliminate interferences.
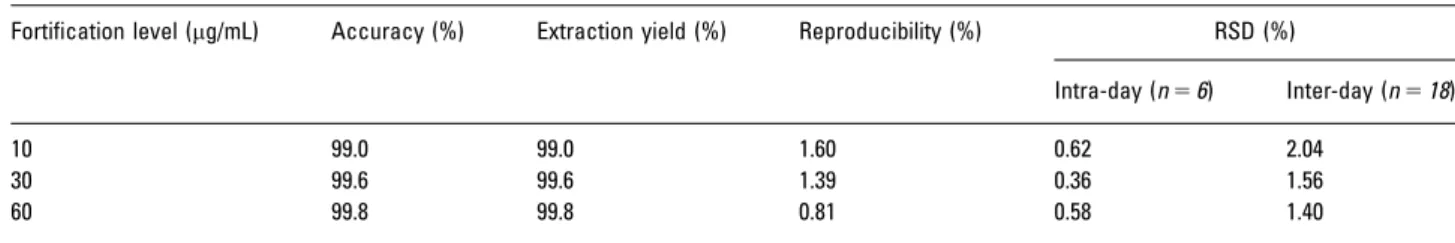
Table 2. Validation results for intra- and inter-day precision, extraction yield, and accuracy, obtained for (E)-resveratrol by using MEPSC8/
UPLC-PDA methodology
Fortification level (mg/mL) Accuracy (%) Extraction yield (%) Reproducibility (%) RSD (%)
Intra-day (n56) Inter-day (n518)
10 99.0 99.0 1.60 0.62 2.04
30 99.6 99.6 1.39 0.36 1.56
Specificity was determined by the calculation of peak purity facilitated by PDA, which confirmed the singularity of peak component. The absorption spectra of (E)-resveratrol remained invariable at each time point in the peak (Fig. 1A).
3
Results and discussion
3.1 MEPS optimization
Besides maximum enrichment performance by MEPS, the determination of the target analytes in small sample volumes requires a sensitive detection method. The preci-sion engineering used in the design and manufacture of MEPS allows the same functions as SPE, such as the removal of interfering matrix components and the selective isolation and concentration of analytes.
Selection of sorbent is important to achieve acceptable clean-up and extraction yield; therefore, the performance of different kinds of sorbents such as C2, C8, C18, SIL and M1 (mixed-mode C81SCX) was evaluated.
Each MEPS sorbent was evaluated in terms of extraction efficiency, determined by the peak area, and reproducibility. As shown in Fig. 1A, C18 sorbent gave the best extraction efficiency. However, C8 sorbent was selected because it showed a higher reproducibility and, statistically, differ-ences were not significant, when compared with C18. On the other hand, the lowest extraction efficiency was obtained by SIL (Fig. 1B).
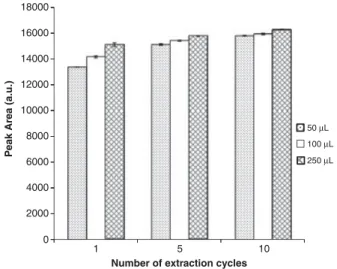
During MEPS, the sample can be drawn through the needle into the syringe, once or several times (draw–eject). The multiple extraction cycles can be made from the same aliquot (draw–eject in the same vial) or by draw up from aliquot and discard in waste (extract–discard). However, the latter was selected in this study. Figure 2 shows the influ-ence of the number of extraction cycles (extract–discard) and sample volume on extraction efficiency of (E)-resveratrol from wines. The competition for active adsorption sites of
the C8 sorbent increased slightly, when the sample volume and number of extraction cycles increased. However, no significant differences were observed between one, five, and ten times using a sample volume of 250mL. For this reason, 1250mL was selected, since the lower number of extrac-tion cycles gave a good recovery and can extend the lifetime of the MEPS cartridge.
3.2 Method validation
The analytical validation was performed according to the guideline principles of Food and Drug Admini-stration (http://www.fda.gov/downloads/Drugs/Guidance-ComplianceRegulatoryInformation/Guidances/ucm070107) [51] and International Conference on Harmonization (http://www.ich.org/LOB/media/MEDIA417.pdf) [52]. The assays were carried out using a Waters Acquity H-Class with a 100 mm1.8mm UPLC analytical column and using ET red wine as the development method matrix. The procedure was fully validated considering the linearity, LOD, LOQ, extraction yield, accuracy, and intra-/inter-day precision (Tables 1 and 2). These parameters were calculated using concentrations usually found in wines. A linear regression of the peak area versus analyte concentration was calculated to determine the linearity of the method using three replicates at six levels of concentration (Table 1). As it can be seen (Table 1), the calibration curve was linear over the quantitation range withr240.999.
The LOD and LOQ were calculated from ordinary least-square regression data. To calculate LOD and LOQ values, the chosen SD was the intercept SD. The SD chosen to calculate the LOD and LOQ values is the residual SD of the regression line for (E)-resveratrol in the analysed matrix (Table 1). As it can be seen in Table 1, the MEPSC8
/ULPC-PDA methodology gave very low LODs (0.21mg/mL) and LOQs (0.68mg/mL). These limits are comparable with those obtained by other authors [44–46, 48].
(E)-resveratrol - 5.688
AU
0.000 0.010 0.020 0.030
Minutes
5.20 5.30 5.40 5.50 5.60 5.70 5.80 5.90 6.00 6.10 6.20 215.9
AU
0.10 0.20
220.00 240.00 260.00 280.00 nm
300.00 320.00 340.00
0 100000 200000 300000 400000 500000 600000 700000
C2 C8 C18 SIL M1
P
e
a
k
A
re
a
(
a
.u
.)
Sorbent
SIL C2 M1 C8 C18
(E)- resveratrol UV sepectra (λmax = 305nm)
A
B
304.8
Figure 1.(A) Overload of UPLC-PDA (lmax5305 nm) chromatogram of a (E)-resveratrol standard solution (20mg/mL), showing the
In order to evaluate the accuracy of the present method, a recovery study was carried out fortifying Enxurros red wine samples at three concentration levels, with a known amount of (E)-resveratrol (Table 2). The concentrations of wine spikes were chosen to cover the expected values in the wine samples. The accuracy was determined according to the equation presented in Section 2.6.
The mean accuracies for (E)-resveratrol (n56) at each fortification level are listed in Table 2. At high concentra-tions, the results were excellent and ranged between 99.6 and 99.8%; however, at low concentrations the recovery is slightly lower (99.0%).
Precision was evaluated both for intra- and inter-day measurements by analysing six replicates of a Enxurros red wine extracted on three separate days. The intra-day preci-sion at three different concentrations varied between 0.36 and 0.62% (n56). The precision for the inter-day samples, which were prepared independently every day, was deter-mined by analysing the same sample six times on three separate days (1.40–2.04%, (n518)). The obtained RSDs are lower than 4.0% for all studied concentrations. These values fell well within the criteria normally accepted in bioanaly-tical method validation [44, 51, 52]. The intra- and inter-day precision data are summarized in Table 2.
Selectivity was assessed by the absence of interference in the same chromatographic windows as examined (E)-resveratrol in respective solution and wine sample and it was demonstrated by the analysis of blank matrices.
Combination of fast MEPS technique together with quick UPLC-PDA system proves to be improved, with excellent recoveries, sensitivity, and repeatability, which make it possible to use as a quick approach to analyse the selected analytes in wines.
3.3 Determination of (E)-resveratrol by MEPSC8/
UPLC-PDA methodology
Thirty commercial available wine samples from different geographical regions, grape varieties, and vintages were analysed in triplicate to demonstrate the applicability of the proposed method. (E)-Resveratrol was identified by its RT and by the wavelength corresponding to its maximum absorvance (lmax5305 nm). A typical chromatogram of a red (Enxurros) and white (Latadas) wine sample obtained by MEPSC8/UPLC-PDA is shown in Fig. 3. Excellent peak
shape and resolution were achieved with minimal 16000
18000
12000 14000
6000 8000 10000
P
e
ak Ar
ea (a.u.)
50 µL 100 µL 250 µL
2000 4000
0
1 5 10
Number of extraction cycles
Figure 2. Influence of the number of extraction cycles (extract– discard) and volume of wine sample, on the extraction efficiency of (E)-resveratrol from wine matrices. Error bars represent standard error of the mean (n53) for each data point (a.u.: arbitrary units).
Standard solution
Red wine
White wine
(E)-resveratrol (E)-resveratrol
(E)
-r
es
v
e
ra
tr
o
l
Figure 3. UPLC-PDA (lmax5
305 nm) chromatogram profile of red (Enxurros) and white (Latadas) wines after MEPSC8
interference from the wine matrix. The chromatograms for red and white wines showed quite different profiles.
The content of (E)-resveratrol found in the wine samples assayed is summarized in Table 3. As can be easily observed, the (E)-resveratrol is much more abundant in red wines than white wines. The fact that (E)-resveratrol content is higher in red wines was widely described before in the literature [51].
Red wine from Azores (TLT) was by far the one that showed higher (E)-resveratrol content (almost 50mg/mL), followed by Azores (Terras de Lava) and Madeira (Palheiros) Islands, with concentrations around 48 and 44mg/mL, respectively. In white wines, the (E)-resveratrol content is significantly lower. (E)-Resveratrol was found in Seic-al,
Latadas, Rocha Branca and Enxurros wines but their concentration was below the LOQ. In other wines, namely, Terrantez (Madeira) and Vin˜atigo Gual (Canary), (E)-resveratrol was not detected (n.d.).
The values found in some wines are higher than those reported in the literature for most of the Portuguese red wines [44–46].According to the literature, Canada produced red wines with the highest average level of (E)-resveratrol of 3.271.5mg/mL and Greece and Japan with 1.070.5 and 1.070.6mg/mL, respectively. Furthermore, the highest (E)-resveratrol levels reported in the literature were 11.9mg/ mL in a 1997 Swiss wine made from the Pinot Noir grape [53] and 14.3mg/mL in a Hungarian, 2002 Merlot [54].
4
Concluding remarks
An ultra-fast, sensitive and reproducible MEPSC8
/UPLC-PDA-based methodology, using a 100 mm analytical column (Acquity HSS T3) packed with 1.8mm particles, was developed, validated and successfully applied to the Table 3. (E)-Resveratrol levels (mg/mL) in commercial wines from different origins obtained by MEPSC8/UPLC-PDA methodology
Wine sample Origin Varieties Vintage (E)-Resveratrol (mg/mL)
Red wines
Basalto Azores Periquita, Agrono´mica, Saborinho 2009 39.470.67
Barbeito Madeira Tinta Negra Mole 1998 oLOQa)
Enxurros Madeira Tinta Negra Mole, Complexa, Merlot, Cabernet Sauvignon 2008 10.270.64
TLT Azores Merlot, Saborinho, Cabernet Sauvignon, Syrah 2009 50.270.83
Palheiros Madeira Cabernet Sauvignon, Merlot, Touriga Nacional 2006 44.470.93
Terras de Lava Azores Merlot, Saborinho, Cabernet Sauvignon, Syrah 2005 48.570.78
Vin˜atigo Canary Negramoll Tinto 2005 9.671.48
Torcaz Madeira Titnta Negra Mole NAb) n.d.c)
Real Lavrador Alentejo Castela˜o 2010 oLOQ
Porca de Murc-a Douro Touringa Nacional, Touriga Franca, Tinta Roriz, Tinto Ca˜o 2009 8.0273.36
Adega de Borba Alentejo Aragonez, Tincadeira, Alicante Bouschet 2009 oLOQ
Periquita Azeita˜o Castela˜o, Aragnez, Trincadeira 2008 13.771.75
Contemporal Da˜o Touriga Nacional, Touriga Franca, Tinta Roriz, Tinta Barroca 2008 4.5372.68
Terras d’el Rei Alentejo Trincadeira, Castela˜o, Moreto, Aragonez 2010 oLOQ
Pela˜o Douro Baga, Touriga Nacional 2009 5.2673.05
Reguengos Alentejo Aragonez, Trincadeira, Castela˜o 2010 oLOQ
Gra˜o Vasco Da˜o Jaen, Tinta Roriz, Touriga Nacional 2008 24.270.93
Terras Altas Da˜o Bastardo, Jean, Touriga National e Alfrocheiro 2007 2.7873.57
Casa de Santar Da˜o Touriga Nacional, Alfrocheiro, Tinta Roriz 2007 8.7671.57
Esteva Douro Tinta Roriz, Touriga Franca, Tinta Barroca, Touriga Nacional 2009 7.4774.38
JP Azeita˜o Setu´bal Castela˜o, Aragonez, Syrah NA 7.3571.35
Monte Velho Alentejo Aragonez, Trincadeira, Castela˜o 2009 2.5970.38
Frei Bernardo Beira Rufete, Marufo, Tinta Roriz NA 17.170.48
Fonte Serrana Alentejo Aragonez, Trincadeira, Cabernet Sauvignon, Alicante Bouschet 2009 5.4671.51
White wines
Seic-al Madeira Verdelho, Arnsburguer (Riesling) 2007 oLOQ
Latadas Madeira Verdelho 2007 oLOQ
Rocha Branca Madeira Arnsburguer 2007 oLOQ
Enxurros Madeira Verdelho, Arnsburguer 2005 oLOQ
Terrantez Madeira Terrantez 2000 n.d.
Vin˜atigo Gual Canary Gual 2007 n.d.
Repeatability (%RSD) 2.04 Reproducibility (%RSD) 1.60
a) All concentrations were above the LOD. b) NA: not available.
analysis of (E)-resveratrol in wines. The procedure is simple, more efficient and less time-consuming, and moreover can be used for small sample volumes (50mL) as well as large volumes (41000mL). After a careful selection of the eluent systems, it was demonstrated that the chromatographic separation of the (E)-resveratrol could be achieved within 6 min. The combination of the shorter running time with a smaller flow rate also reduced drastically the solvent consumption. The validated method is sensitive and specific, presenting low LODs and LOQs. The results demonstrated that the method revealed as an attractive and very promising approach for the analysis of other groups of compounds due to the possibility of automation, ease of use, rapidity and minimum cost of analysis.
The authors acknowledge the FEDER (Transnational Cooperation MAC 2007-2013 Program) through VinSaude-MAC project (VinSaude-MAC/1/M105) for the financial support, and Portuguese Foundation for Science and Technology (FCT) through the MS Portuguese Networks (REDE/1508/RNEM/ 2005) and Pluriannual base funding (QUI-Madeira-674).
The authors have declared no conflict of interest.
5 References
[1] Cheng, M., Gao, H. Q., Xu, L., Li, B. Y., Zhang, H., Li, X. H., J. Cardiovasc. Pharmacol. 2007, 50, 503–509.
[2] Caillet, S., Salmieri, S., Lacroix, M.,Food Chem.2006, 95, 1–8.
[3] Bishayee, A.,Cancer Prev. Res.2009,2, 409–418.
[4] Delgado, R., Martı´n, P., A´ lamo, M., Gonza´lez, M.,J. Sci. Food Agric.2004,84, 623–630.
[5] Segade, S. R., Va´zquez, E. S., Losada, E. D., J. Food Compos. Anal.2008,21, 599–607.
[6] Baur, J. A., Sinclair, D. A.,Nat. Rev. Drug Discov.2006, 5, 493–506.
[7] Athar, M., Back, J. H., Tang, X., Kim, K. H., Kopelovich, L., Bickers, D. R., Kim, A. L.,Toxicol. Appl. Pharmacol. 2007,224, 274–283.
[8] Aggarwal, B. B., Shishodia, S.,(E)-Resveratrol in Health and Disease, CRC Press, New York 2006.
[9] Stervbo, U., Vang, O., Bonnesen, C.,Food Chem.2007, 101, 449–457.
[10] Donna, D. L., Mazotti, F., Benabdelkamel, H., Gabriele, B., Plastina, P., Sindona, G., Anal. Chem. 2009, 81, 8603–8609.
[11] Pineiro, Z., Palma, M., Barroso, C. G.,J. Chromatogr. A 2006,1110, 61–65.
[12] Penumathsa, S., Maulik, N.,Can. J. Physiol. Pharmacol. 2009,87, 275–286.
[13] Fan, E., Zhang, L., Jiang, S., Bai, Y.,J. Med. Food2008, 11, 610–614.
[14] Aziz, M. H., Kumar, R., Ahmad, N.,Int. J. Oncol.2003, 23, 17–28.
[15] Saiko, P., Szakamary, A., Jaeger, W., Szekeres, T., Mutat. Res.2008,658, 68–94.
[16] Baur, J. A., Pearson, K. J., Price, N. L., Jamieson, H. A., Lerin, C., Kalra, A., Prabhu, V. V., Allard, J. S., Lopez-Lluch, G., Lewis, K., Pistell, P. J., Poosala, S., Becker, K. G., Boss, O., Gwinn, D., Wang, M., Ramaswamy, S., Fishbein, K. W., Spencer, R. G., Lakatta, E. G., Le Couteur, D., Shaw, R. J., Navas, P., Puigserver, P., Ingram, D. K., Cabo, R., Sinclair, D. A.,Nature2006,444, 337–342.
[17] Banerjee, S., Bueso-Ramos, C., Aggarwal, B. B.,Cancer Res.2002,62, 4945–4954.
[18] Provinciali, M., Re, F., Donnini, A., Orlando, F., Bartozzi, B., Di Stasio, G., Smorlesi, A.,Int. J. Cancer2005,115, 36–45.
[19] Kenealey, J. D., Subramanian, L., Ginkel, P., Darjatmoko, S., Lindstrom, M., Somoza, V., Ghosh, S., Song, Z., Hsung, R., Kwon, G. S., Eliceiri, K., Albert, D., Polans, A.,J. Agric. Food Chem. 2011. DOI: 10.1021/ jf104901g.
[20] Cheng, M., Gao, H. Q., Xu, L., Li, B. Y., Zhang, H., Li, X. H.,J. Cardiovasc. Pharmacol.2007,50, 503–509.
[21] Wang, K. T., Chen, L. G., Tseng, S. H., Huang, J. S., Hsieh, M. S., Wang, C. C.,Agric. Food Chem.2011. DOI: 10.1021/jf104718gJ.
[22] Ratola, N., Faria, J. L., Alves, A., Food Technol. Biotechnol.2004,42, 125–130.
[23] Mattivi, F., Z. Lebensm. Unters. Forsch. 1993 196, 522–525.
[24] Pawliszyn, J.,Solid Phase Microextraction, Theory and Practice, Wiley, New York 1997.
[25] Pawliszyn, J., Applications of Solid Phase Micro-extraction, Royal Institute of Chemistry, Cambridge 1999.
[26] David, F., Sandra, P., J. Chromatogr. A 2007, 1152, 54–69.
[27] Vin˜as, P., Campillo, N., Herna´ndez-Pe´rez, M., Herna´ndez-Co´rdoba, M., Anal. Chim. Acta 2008, 611, 119–125.
[28] Stark, T., Wollmann, N., Loesch, S., Hofmann, T.,Anal. Chem.2011. DOI: 10.1021/ac103305s.
[29] Altun, Z., Abdel-Rehim, M.,Anal. Chim. Acta2008,630, 116–123.
[30] Abdel-Rehim, M.,J. Chromatogr. A2010,1217, 2569–2580.
[31] Abdel-Rehim, M.,J. Chromatogr. B2004,801, 317–321.
[32] Altun, Z., Abdel-Rehim, M., Blomberg, L. G.,J. Chro-matogr. B2004,813, 129–135.
[33] Vita, M., Skansen, P., Hassan, M., Abdel-Rehim, M., J. Chromatogr. B2005,817, 303–307.
[34] Dawes, P., Hibbert, R., Wirth, H. J., Gooley, A., in34th International Symposium on Capillary Chromato-graphy, Sandra, T., Sandra, P., (Eds.), I.O.P.M.S., Belgium.
[35] El-Beqqali, A., Kussak, A., Abdel-Rehim, M., J. Chro-matogr. A2006,1114, 234–238.
[36] Wynne, P., Hibbert, R., DiFeo, D., Dawes, P., The Column2008,4, 12–17.
Brominated and Chlorinated Aromatic Compounds in Wine, Trends in Food Analysis VI, Belgium 2009.
[38] Wirth, H. J., Lahoutifard, N., Wynne, P., in4th Interna-tional Symposium on Recent Advances in Food Analy-sis, Pulkrabova´, J., Suchanova´, M., Tomaniova´, M., (Eds.), Prague 2009.
[39] Wynne, P., Gooley, A., Lahoutifard, N., in4th Interna-tional Symposium on Recent Advances in Food Analy-sis, Pulkrabova´, J., Suchanova´, M., Tomaniova´, M., (Eds.), Prague 2009.
[40] Wynne, P., in 28th International Symposium on Halo-genated Persistent Organic Pollutants, SGE Analytical Science, Birmingham 2008.
[41] Spa´cˇil, Z., Nova´kova´, L., Solich, P., Talanta 2008, 76, 189–199.
[42] Guillarme, D., Casetta, C., Bicchi, C., Veuthey, J. L., J. Chromatogr. A2010,1217, 6882–6890.
[43] Gruz, J., Nova´k, O., Strnad, M.,Food Chem.2008,111, 789–794.
[44] Paulo, L., Domingues, F., Queiroz, J. A., Gallardo, E., J. Agric. Food Chem.2011,59, 2157–2168.
[45] Bravo, M. N., Feliciano, R., Silva, S., Coelho, A. V., Boas, L. V., Bronze, M. R., J. Food Compos. Anal.2008,21, 634–643.
[46] Pereira, V., Caˆmara, J. S., Cacho, J., Marques, J. C., J. Sep. Sci.2010,33, 1204–1215.
[47] Paixa˜o, N., Perestrelo, R., Marques, J. C., Caˆmara, J. S., Food Chem.2007,105, 204–214.
[48] Paixa˜o, N., Pereira, V., Marques, J. C., Caˆmara, J. S., J. Sep. Sci.2008,31, 2189–2198.
[49] Blomberg, L. G., Anal. Bioanal. Chem. 2009, 393, 797–807.
[50] Samanidou, V. F., Nika, M. K., Papadoyannis, I. N., J. Sep. Sci.2007,30, 2391–2400.
[51] Food and Drug Administration: US Department of Health and Human Services, Guidance for Industry, Bioanalytical Method Validation, FDA.
[52] International Conference on Harmonization (ICH), Vali-dation of analytical procedures: methodology ICH Q2. ICH.
[53] Gerogiannaki-Christopoulou, M., Athanasopoulos, P., Kyriakidis, N., Gerogiannaki, I. A., Spanos, M., Food Contr.2006,17, 700–706.