Article
0103 - 5053 $6.00+0.00
*e-mail: [email protected]
Simultaneous Determination and Pharmacokinetics of Four Coumarins in Rat
Plasma after Oral Administration of Traditional Chinese Medicine “YIGONG”
Capsule by SPE-HPLC
Chao Feng, Jin-Lan Ruan* and Ya-Ling Cai
Hubei Key Laboratory of Natural Medicinal Chemistry and Resource Evaluation, College of Pharmacy, Tongji Medical Center of Huazhong University of Science and Technology,
Wuhan 430030, People’s Republic of China
Foi desenvolvido um método simples, sensível e rápido de extração em fase sólida utilizando cromatograia liquida de alta eiciência (SPE-CLAE) para a determinação simultânea de quatro cumarinas, psoralen, isopsoralen, imperatorina e isoimperatorina, utilizando ostole como padrão interno. Utilizando este método, foi analisada a farmacocinética destas cumarinas em plasma de ratos após administração oral de uma cápsula “YIGONG” da medicina chinesa tradicional. Amostras
de plasma foram pré-tratadas com extração em fase sólida utilizando cartuchos Extract-CleanTM
e a separação dos extratos foi realizada com uma coluna Eurospher C18 utilizando metanol-água
como fase móvel. Os limites de quantiicação foram 9,7 ng mL-1 para psoralen, 7,1 ng mL-1 para
isopsoralen, 6,7 ng mL-1 para imperatorina e 3,0 ng mL-1 para isoimperatorina. As recuperações
médias das quatro cumarinas contidas no plasma de ratos foram bem acima de 80%. As precisões determinadas para 6 dias estiveram sempre dentro de 10%. Concluiu-se que o método estabelecido é adequado para estudos farmacocinéticos destas quatro cumarinas em plasma de ratos.
A simple, sensitive and rapid solid-phase extraction method by using high performance liquid chromatography (SPE-HPLC) was developed for simultaneous determination of four coumarins, psoralen, isopsoralen, imperatorin and isoimperatorin using osthole as internal standard. Using this method, pharmacokinetic of these coumarins in rat plasma was analyzed after oral administration
of a traditional Chinese medicine “YIGONG” capsule. Plasma samples were pretreated with
solid-phase extraction using Extract-CleanTM cartridges, and separation of the extracts was performed
on a Eurospher C18 column using methanol-water as mobile phase. The quantiication limits
for psoralen, isopsoralen, imperatorin and isoimperatorin in rat plasma were 9.7, 7.1, 6.7 and
3.0 ng mL-1, respectively. Average extract recoveries of the four coumarins from rat plasma were
all over 80%. Precisions determined from 6 days were all within 10%. It was concluded that the established method is suitable for pharmacokinetic studies of these four coumarins in rat plasma.
Keywords: coumarins, SPE-HPLC, pharmacokinetics
Introduction
Traditional medicine has been applied in China for thousands of years through which a whole system of disease theories, diagnostic methods, treatment procedures, and drug therapies has evolved. This system is called traditional Chinese medicine (TCM). Though TCM played certain role in Chinese history and in the growth of the people, in light of modern science TCM - especially its disease theories - has been proven largely primitive, empirical, subjective, and unreliable. However, certain aspects of
is not easily achieved since most formulas have multiple components, each of which in itself might also contain tens or even hundreds of chemical ingredients. This problem highlights the urgent need of sensitive, reliable and eficient methods for analysis of drug in preparations as well as in biological samples.1,2 Endeavor has been made in this paper to achieve it.
The authors have studied a TCM formula named Yi-Gong-Ning-Xue oral solution which consists of ingredients from twelve herbal plants including Radix fructus psoraleae, Coastal glehnia root, Radix polygoni multilori,
Fructusligustri lucidi, Fructus schisandrae, Radix rubiae, Herba leonuri, Radix glycyrrhizae etc. Yi-Gong-Ning-Xue in line with State Food and Drug Administration Standard WS-5092 (B-0092)-2002) is commercially available. The capsule form of this formula (YGC) is used in our study. YGC is held in TCM to be able to restore vital energy, nourish YIN, and promote kidney function and homeostasis. It is also often prescribed as adjunctive treatment for some gynecological illnesses like menometrorrhagia, prolonged and/or irregular menstruation. In a previous study, the authors demonstrated that coumarins such as psoralen, isopsoralen, imperatorin and isoimperatorin are a major group of ingredients of YGC.3 These coumarins have been reported to be able to inhibit platelet aggregation and proliferation of vascular smooth muscle cells.4 Some studies also claim that these coumarins beneit therapeutically in the treatment of menstrual irregularities, abdominal and menstrual cramps, vaginal discharge, menopause related disturbances.5 Several published papers have analyzed the pharmacokinetics of some active constituents from a number of herbal medicines.6-10 In this paper, the authors have developed a solid-phase extraction high performance liquid chromatography based method (SPE-HPLC) to simultaneously determine these four coumarins in rat plasma. Furthermore, the method is applied to investigate the pharmacokinetics of these coumarins in rat plasma after oral administration of YGC.
Experimental
Materials
Sample YGC was supplied by Hubei Shientang Pharmaceutical Co. Ltd. (Hubei, China). Standard substances (psoralen, isopsoralen, imperatorin, isoimperatorin, luocinonide, bergapten and byak-angelicin) and osthole (internal standard, I.S.) were provided by National Institute for the Control of Pharmaceutical and Biological Products (Beijing, China). Male Sprague-Dawley rats were obtained from Experimental Animals Center, Tongji Medical
College, Huazhong University of Science and Technology. HPLC grade methanol and acetonitrile were purchased from Merck (Darmstadt, Germany). Other reagents were all of analytical grade. HPLC-grade water was puriied by Milli-Q system (Milford, MA, USA).
Chromatographic system
Waters 2695 Alliance HPLC system series with Empower software (Waters Technologies, USA) equipped with a quaternary solvent delivery pump, an online vacuum degasser, an autosampler, a thermostated compartment and a model 2996 diode array detector, were used for chromatographic analysis. All separations were carried out on a Eurospher C18 column (250 mm × 4.6 mm i.d. with 5.0 μm particle size) from Hanbang Science and Technology (Jiangsu, China). Mobile phase was methanol-water. A gradient program was applied as follows. A linear gradient of methanol-water (53:47, v/v) was used for the irst 13 min followed by holding at methanol-water (73:27, v/v) for 17 min. Flow-rate was 1.0 mL min-1 and column temperature was maintained at 30 oC. Efluent was monitored at 250 nm and injection volume was 20 μL. Peak identiication was based on the retention time and the DAD spectrum against the standard present in the chromatogram.
Preparation of calibration standards and quality control samples
Standard stock solutions of psoralen, isopsoralen, imperatorin, isoimperatorin and osthole (I.S.) were prepared separately at concentrations of 3.100, 2.800, 0.810, 0.300 and 0.15 mg mL-1 in methanol and stored away from light at 4 oC. Stock solutions were appropriately diluted to prepare a series of standard working solutions. Stock solution of osthole (I.S.) was also diluted in methanol to give a inal concentration of 0.5 μg mL-1.
Extraction procedure
Extract-CleanTM cartridges (100 mg, 1.5 mL, Alltech Associates Inc.) were applied for pre-concentration and extraction of coumarins from rat plasma. Conditioning was irst done by lushing the cartridge with methanol followed by deionized water. A mixture of 300 μL plasma samples containing 0.01 μg I.S. was transferred into a SPE column cartridge, the cartridge was washed with water after complete sample absorption. Then the compounds were eluted with 5 mL of methanol-water (53:47, v/v). The obtained eluate was evaporated dry in nitrogen at 37 oC and redissolved in 0.1 mL methanol. Following mixing by sonication and centrifuging at 6600 g for 10 min, 20 μL of the sample was injected into HPLC system for analysis.
Validation of the assay
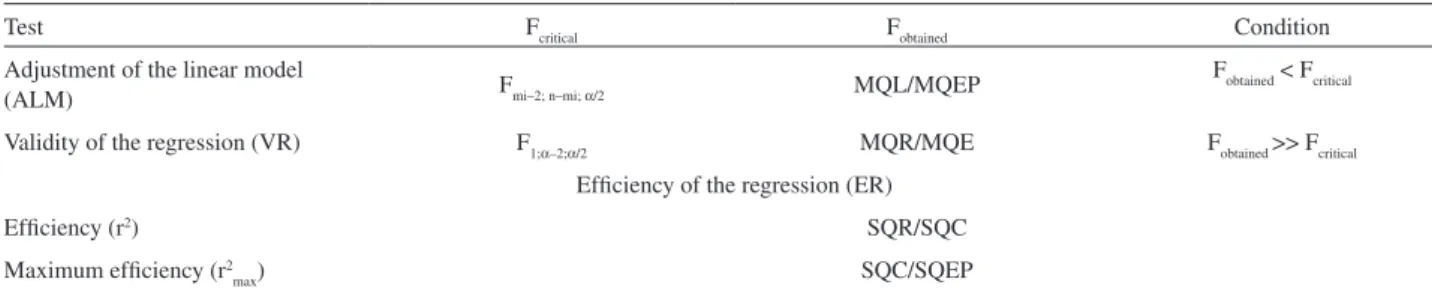
The linearity of the prepared standards was assessed by means of linear regression analysis, using least-square regression method. The statistical signiicance of regression was evaluated using the ANOVA table constructed from equations shown in Table S1 (see Supplementary Information, SI) and by adjustment of the linear model (ALM), validity of the regression (VR) and eficiency of the regression (ER) tests (see Table S2, SI), according to method developed previously.11
QC samples at low, middle, and high concentrations were assayed at a two-hour interval on the same day to examine the intra-day precision and accuracy. Assays were also performed on a daily basis within the same period to determine the inter-day precision and accuracy. For sensitivity determination, a series of diluted plasma standard samples were prepared and analyzed.
The limit of quantiication (LOQ) was determined as the inal concentration that produced a signal-to-noise (S/N) ratio of 10 and the limit of detection (LOD) as the inal concentration that produced a signal-to-noise (S/N) ratio of 3. The recoveries were determined by comparing the QC samples with drug-free plasma samples which were extracted using the same SPE procedure but spiked before nitrogen evaporation. I.S. solution was added before SPE procedure in all cases. QC samples were also checked for stability during storing and processing.12
The froze-thaw stability was examined after three freeze and thaw cycles. In each cycle the QC samples were analyzed without being frozen at irst, and then stored at −20 oC and thawed at the room temperature without any assistance. Long term stability of samples was determined after 2, 5, 10, 15, 30 days of storage at −20 oC. Samples for
short term stability were kept at room temperature for 0-8 h and the assays were performed at 0, 2, 4, 6, 8 h.
Preparation of YGC
YGC (0.5 g) was extracted with 20.00 mL solvent composed of (80% methanol in water, v/v) for 30 min in an ultrasonic bath, which was repeated for three times. After cooling, the extraction was iltered, concentrated, and then dried in a rotatory evaporator under reduced pressure to yield a residue which was subsequently stored at −20 oC before use. Coumarin contents in YGC were quantitatively determined to calculate the administered dosage of four coumarins. Extraction residue was dissolved in methanol by ultrasonication and transferred to a 10 mL volumetric lask. This solution was diluted to a appropriate concentration, filtered through a syringe ilter (0.45 μm) and then injected into the HPLC system for analysis. The contents of four coumarins (psoralen, isopsoralen, imperatorin and isoimperatorin) in the residue of YGC were 19.7, 18.5, 14.6 and 6.1%, respectively, determined from peak area ratios using a linear regression equation obtained from the calibration curve.
Application to pharmacokinetic studies
Male Sprague-Dawley rats (200 ± 20 g) were kept in environmental controlled breeding room for 4 days until the experiment. The rats were without feeding for 12 h prior to YGC content administration. YGC content was orally administered at a dose of 80 mg kg-1. Venous blood (300 μL) was obtained from the tail vein and collected in heparin pretreated test tubes at 0.25, 0.5, 75, 1, 2, 3, 4, 5, 6, 9, 12 and 24 h after YGC content administration. All blood samples were immediately centrifuged and obtained plasma was stored at −20 oC until analysis.
HPLC analysis procedure was applied to analyze plasma concentration-time proiles of psoralen, isopsoralen, imperatorin and isoimperatorin. All data were processed by two-compartmental analysis using DAS 2.0 software package (Chinese Pharmacological Society).
Results and Discussion
Method development
best resolution of each analyte. Protein precipitation by methanol, ethanol, acetonitrile or 10% trichloroacetic acid results in no chromatographic peak signal. Then several extraction solvents were tested, including ethyl ether, ethyl acetate and chloroform. It was found that liquid-liquid extraction technique resulted in a relative low recovery for four coumarins. Therefore, SPE method, using Extract-CleanTM cartridges was developed for HPLC analysis. Compared with the other extraction techniques, SPE not only yielded cleaner samples but also gave better recoveries of all four analytes.
Selection of internal standard
Osthole was selected as the I.S. because of its structural similarity to the analytes and its excellent chromatographic properties. Some other compounds such as luocinonide, bergapten and byak-angelicin were also been tested with a mobile phase of methanol-water (70:30, v/v), water (55:45, v/v), acetronitrile-methanol-water-acetic acid (20:15:65:2, v/v/v/v) at a low-rate of 1.0 mL min-1,13-15 but without satisfactory results. Due to its better separation from the analytes, osthole was selected as the I.S. HPLC conditions were developed to give the best peak resolution of each analyte.
Selectivity and chromatography
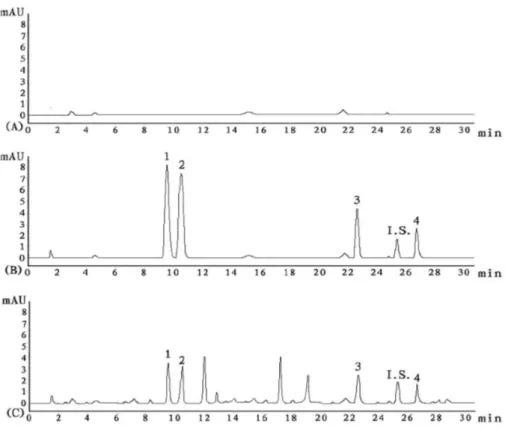
HPLC method described, in section Chromatographic system, was selective and speciic for analysis of all the four coumarins in rat plasma. Typical chromatography of blank plasma, plasma respectively spiked with psoralen 3.100 μg mL-1, isopsoralen 2.800 μg mL-1, imperatorin 0.810 μg mL-1, isoimperatorin 0.300 μg mL-1 and I.S. 0.500 μg mL-1 and plasma obtained 1h after oral administration of YGC was shown in Figure 1. The purity factor which was tested by diode array detector was larger than 990.00 (the threshold). The purity test result and the analysis of the plasma samples showed that there were no endogenous substance peaks or drug metabolite peaks interfering with analytes and I.S. in terms of retention time. The retention times were 9.6, 10.5, 22.9, 25.3, and 26.7 min for psoralen, isopsoralen, imperatorin, I.S. and isoimperatorin, respectively.
Linearity, working range and limit of detection
Evaluation of the assays were performed with a seven-point calibration curve over the concentration range described in section Preparation of calibration standards and quality control samples. Blank plasma was respectively
spiked with stock solutions of psoralen, isopsoralen, imperatorin, isoimperatorin to construct the calibration curve.
The standard calibration curves in the investigated range were linear, the regression data of the calibration curves, squares of correlation coefficients (r2) and maximum squares of correlation coeficients (r2
max) are shown in Table S3 (SI). Table S2 (SI) summarizes the results of linearity tests for a statistical signiicance of 95%. The adjustment of the model is considered satisfactory if Fobtained < Fcritical in the adjustment of the linear model (ALM) test. The validity of the regression (VR) test justiies that the slope of the linear regression equation is different than zero. It’s indication that the m value is not null if Fobtained >> Fcritical. The results showed that the squares of the linear correlation coeficients were above 0.99 (Table S3), evidencing the linearity occurrence.11 The regression of standard curves were statistically signiicant since the statistical test did not exceed the critical value. The values of r2 and r2
max were similar. This indicates that the error due to regression is close to the pure error that must be due to the analytical procedure, validating the use of the linear model.
LOD of the analytes were in the range of 1.30-4.86 ng mL-1, while LOQ were from 3.0-9.7 ng mL-1. Detailed descriptions of the calibration curves and linear ranges, together with the values of LOD and LOQ (all were listed in Table S3, SI).
Precision and accuracy
The precision and accuracy of the assays were evaluated using quality control (QC) samples at three concentration levels described in section Validation of the assay. The precision is presented as percentage of R.S.D. and accuracy is presented as percentage of the relative error (RE) against the nominal concentration. The intra-day and inter-day precision calculated as the relative standard deviation (R.S.D.) were smaller than 10%, and the corresponding RE values ranged from −14.3 to 9.7% (see in Table S4, SI). The results showed that the established method has satisfactory precision and accuracy.
Absolute recovery and repeatability of extraction procedure
To examine the absolute recovery of the SPE procedure, six replicates of QC samples at three concentration levels were used. The absolute recovery was within the range of 80.0-95.5% (shown in Table S5, SI). Repeatability of the extraction procedure was also determined by using six
replicates of the QC samples. The R.S.D. values of the extraction repeatability were all below 6.1%.
Stability
Stability of psoralen, isopsoralen, imperatorin and isoimperatorin in rat plasma during sample storage and processing procedures was also evaluated. The results of the stability tests shown in Table S6 (see SI) well met the criterion for stability measurements.
Application to pharmacokinetic study
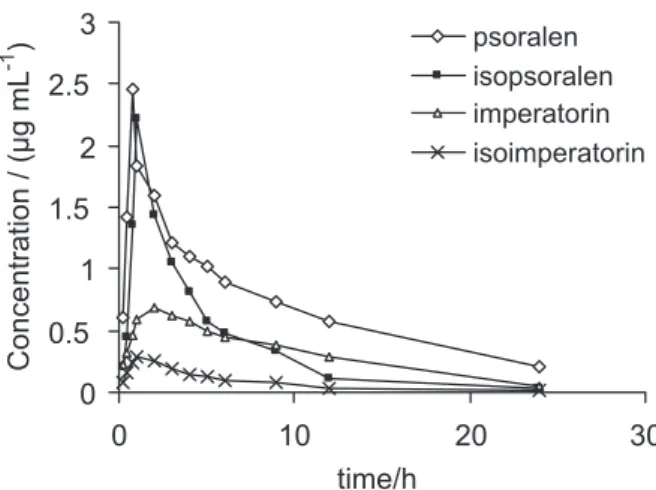
The concentrations of four coumarins in rat plasma were simultaneously determined by the described HPLC method after oral administration of YGC (80 mg kg-1) to rats. Pharmacokinetics was analyzed by using the two-compartmental method. The mean plasma concentration-time proiles of psoralen, isopsoralen, imperatorin and isoimperatorin are shown in Figure 2. The pharmacokinetic parameters are shown in Table S7 (see SI). Plasma concentrations of psoralen, isopsoralen, imperatorin and isoimperatorin peaked at 0.75 ± 0.21, 1.00 ± 0.32, 2.00 ± 0.27 and 1.00 ± 0.36 h, respectively after oral administration of YGC. The mean maximum concentrations (Cmax) of psoralen, isopsoralen, imperatorin and isoimperatorin in rat plasma were 2.452 ± 0.322, 2.221 ± 0.242, 0.684 ± 0.103 and 0.285 ± 0.035 μg mL-1, respectively. Elimination terminal half life (t1/2) for psoralen, isopsoralen, imperatorin and isoimperatorin were 8.292 ± 0.211, 3.831 ± 0.026, 7.365 ± 0.254 and 4.841 ± 0.105 h, respectively. It was demonstrated that this simple and rapid method was suficiently sensitive to follow plasma levels of psoralen, isopsoralen, imperatorin and isoimperatorin after oral administration YGC content to rats.
Conclusions
A simple, sensitive and rapid SPE-HPLC method has been developed for simultaneous determination of psoralen, isopsoralen, imperatorin and isoimperatorin in rat plasma after oral administration YGC, an effectual TCM compound preparation. SPE was employed for extraction of these components from the plasma samples. The developed method provided a simple sample preparation and a stable analytical result for the determination of these coumarins in the plasma samples. A pharmacokinetic study of the main active constituents in YGC will play an important role in studying the drug interaction in vivo for investigating their synergetic effects, identifying their mechanisms of action for obtaining a more effectual and safe remedy for clinical practice.
Supplementary Information
Supplementary data is available free of charge at http://jbcs.sbq.org.br, as PDF ile.
References
1. Wu, Y. J.; Chen, J. J.; Cheng, Y. Y.; Anal. Bioanal. Chem.2005,
382, 1595.
2. Li, J.; Wang, G. J.; Li, P.; Hao, H. P.; J. Chromatogr., B2005,
826, 26.
3. Feng, C.; Cai, Y. L.; Ruan, J. L.; J. Pharm. Biomed. Anal. 2008,
47, 442.
4. Chen, I. S.; Chang, C. T.; Sheen, W. S.; Teng, C. M.; Tsai, I. L.; Duh, C. Y.; Ko, F. N.; Phytochemistry1996, 41, 525. 5. Pires, A. E.; Honda, N. K.; Cardoso, C. A. L.; J. Pharm.
Biomed. Anal.2004, 36, 415.
6. Tegeder, I.; Schmidtko, A.; Brautigam, L.; Kirschbaum, A.; Geisslinger, G.; Lotsch, J.; Clin. Pharmacol. Ther.2002, 71, 153. 7. Zhang, J. L.; Yu, H. L.; Sheng, Y. X.; Li, L.; Ye, M.; Guo, D.
A.; Biomed. Chromatogr. 2005, 19, 15.
8. Mei, Y. H.; Xu, J.; Zhao, J. H.; Feng, N. P.; Liu, Y.; Wei, L.;
J. Chromatogr., B2008, 869, 138.
9. Xia, Y. F.; Dai, Y.; Wang, Q.; Liang, H. Z.; J. Chromatogr., B
2007, 857, 332.
10. Li, X. L.; Li, X. R.; Wang, L. J.; Li, Y. H.; Xu, Y. X.; Xue, M.;
J. Pharm. Biomed. Anal. 2007, 44, 1106.
11. Damasceno, L. H. S.; Adorno, M. A. T.; Hirasawa, J. S.; Varesche, M. B. A.; Zaiat, M.; J. Braz. Chem. Soc. 2008, 19, 1158. 12. Yu, k.; Ma, Y. H.; Shao, Q.; Qu, H. B.; Cheng, Y. Y.; J. Pharm.
Biomed. Anal. 2007, 44, 532.
13. Li, Y. B.; J. Pharm. Biomed. Anal.2006, 40, 1253.
14. Cardoso, C. A. L.; Pires, A. E.; Honda, N. K.; Chem. Pharm. Bull. 2006, 54, 442.
15. Xie, Y.; Chen, Y.; Lin, M.; Wen, J.; Fan, G. R.; Wu, Y. T.;
J. Pharm. Biomed. Anal. 2007, 44, 166.
Supplementary Information
0103 - 5053 $6.00+0.00
*e-mail: [email protected]
Simultaneous Determination and Pharmacokinetics of Four Coumarins in Rat
Plasma after Oral Administration of Traditional Chinese Medicine “YIGONG”
Capsule by SPE-HPLC
Chao Feng, Jin-Lan Ruan* and Ya-Ling Cai
Hubei Key Laboratory of Natural Medicinal Chemistry and Resource Evaluation, College of Pharmacy, Tongji Medical Center of Huazhong University of Science and Technology, Wuhan
430030, People’s Republic of China
Table S1. Mean sum of squares and degrees of freedom used in F-test (ANOVA)
Source of variability Sum of squares Degrees of Freedom Mean Sum of Squares
Total SQT = ΣΣy
ij
2 n MQT = SQT/n
Correction (“b”) FC = n y00 1 FC
Total correction SQC = ΣΣ(yij–y00)
2 n–1 MQC = SQC/(n–1)
Due to regression (“a”) SQR = Σ(yi–y00)
2 1 MQR = SQR
Residual SQE = ΣΣ(yij–yi)
2 n–2 MQE = SQE/(n–2)
Pure Error SQEP = ΣΣ(yij–yi0)
2 n– m
i MQEP = SQEP/(n– mi)
Lack-of-it SQL = Σ(y
i–yi0)
2 m
i–2 MQL = SQL/ (mi–2)
n = total number of measurements; mi= i-concentration levels (7); yij= observed signal; y00= mean of measured signals; yi= predicted dependent variable; yi0= mean of replicates of i-concentration level; “i” index refers to x-independent variable; “j” index refers to replicates in x-levels. First summation Σ ranges from i=1 to i=mi. Second summation ΣΣ in SQC, SQE and SQEP ranges from i=1 to j=ni.
Table S2. Linearity and regression eficiency tests
Test Fcritical Fobtained Condition
Adjustment of the linear model
(ALM) Fmi–2; n–mi; α/2 MQL/MQEP
Fobtained < Fcritical
Validity of the regression (VR) F1;α–2;α/2 MQR/MQE Fobtained >> Fcritical
Eficiency of the regression (ER)
Eficiency (r2) SQR/SQC
Maximum eficiency (r2
max) SQC/SQEP
Table S3. Calibration curves for four coumarins of YGC content in rat plasma
Components Calibration(y=ax+b) Linear range/ (μg mL–1) r
2 r2 max
ALM VR LOD/
(ng mL–1)
LOQ/ (ng mL–1)
F5,14,0.025 Fobtained F1,19,0.025 Fobtained
psoralen y = (112159±1265)x + (–84598 ± 124) 0.0097-3.10 0.9992 0.9999
3.66 2.77
5.92
23731 4.86 9.7
isopsoralen y = (93295±188)x + (–81817 ± 235) 0.0071-2.80 0.9941 0.9998 2.73 3201 3.46 7.1
imperatorin y = (79337±179)x + (–106203 ± 1134) 0.0067-0.81 0.9965 0.9998 2.68 5410 3.24 6.7
isoimperatorin y = (68869±192)x + (–51119 ± 213) 0.0030-0.30 0.9987 0.9999 2.62 14596 1.30 3.0
Table S4. Intra-day and inter-day precision for the assay of four coumarins in rats plasma (n = 6)
Nominal concentration / (μg mL–1)
Intra-day precision Inter-day precision
Measured concentration
R.S.D / (%) RE / (%) Measured concentration R.S.D / (%) RE / (%)
Mean ± SD / (μg mL–1) Mean ± SD / (μg mL–1)
psoralen
3.100 3.140 ± 0.010 3.2 1.3 3.261 ± 0.143 4.4 5.2
0.310 0.337 ± 0.013 3.9 8.7 0.340 ± 0.028 8.2 9.7
0.031 0.032 ± 0.002 6.3 3.5 0.028 ± 0.002 7.1 – 9.7
isopsoralen
2.800 2.696 ± 0.075 2.8 – 3.7 2.915± 0.134 4.6 4.1
0.280 0.278 ± 0.007 2.5 – 0.7 0.296 ± 0.014 4.7 5.7
0.028 0.025 ± 0.001 4.0 –10.7 0.024 ± 0.001 4.2 –14.3
imperatorin
0.810 0.798 ± 0.045 5.6 – 1.5 0.755 ± 0.029 3.8 – 6.8
0.081 0.079 ± 0.002 2.5 – 2.5 0.075 ± 0.002 2.7 – 7.4
0.016 0.015 ± 0.001 6.7 – 6.3 0.014 ± 0.001 7.1 –12.5
isoimperatorin
0.300 0.283 ± 0.016 5.7 – 5.7 0.279 ± 0.018 6.5 – 7.0
0.030 0.028 ± 0.001 3.6 – 6.7 0.031 ± 0.002 6.5 3.3
0.010 0.009 ± 0.0007 7.8 –10.0 0.0087 ± 0.0007 8.0 –13.0
Table S5. Absolute recovery of the developed method and repeatability of the extraction procedure (n = 6)
Components Nominal
concentration / (μg mL–1)
Measured concentation Mean ± SD / (μg mL–1)
Recovery / (%)
R.S.D / (%)
psoralen 3.100 2.855 ± 0.097 92.1 3.4
0.310 0.296 ± 0.003 95.5 1.0
0.031 0.027 ± 0.0016 87.1 6.0
isopsoralen 2.800 2.526 ± 0.078 90.2 3.1
0.280 0.267 ± 0.005 95.4 1.9
0.028 0.024 ± 0.0006 85.7 2.5
imperatorin 0.810 0.727 ± 0.0116 89.8 1.6
0.081 0.069 ± 0.0009 85.2 1.3
0.016 0.014 ± 0.0006 87.5 4.3
isoimperatorin 0.300 0.254 ± 0.012 84.7 4.7
0.030 0.028 ± 0.001 93.3 3.6
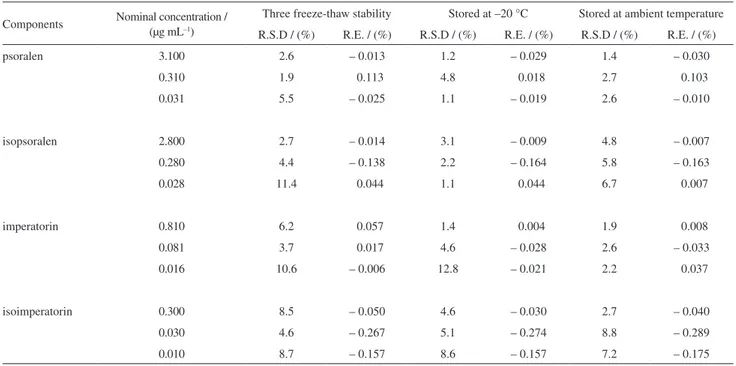
Table S6. Stability of four coumarins in rats plasma (n = 6)
Components Nominal concentration / (μg mL–1)
Three freeze-thaw stability Stored at –20 °C Stored at ambient temperature
R.S.D / (%) R.E. / (%) R.S.D / (%) R.E. / (%) R.S.D / (%) R.E. / (%)
psoralen 3.100 2.6 – 0.013 1.2 – 0.029 1.4 – 0.030
0.310 1.9 0.113 4.8 0.018 2.7 0.103
0.031 5.5 – 0.025 1.1 – 0.019 2.6 – 0.010
isopsoralen 2.800 2.7 – 0.014 3.1 – 0.009 4.8 – 0.007
0.280 4.4 – 0.138 2.2 – 0.164 5.8 – 0.163
0.028 11.4 0.044 1.1 0.044 6.7 0.007
imperatorin 0.810 6.2 0.057 1.4 0.004 1.9 0.008
0.081 3.7 0.017 4.6 – 0.028 2.6 – 0.033
0.016 10.6 – 0.006 12.8 – 0.021 2.2 0.037
isoimperatorin 0.300 8.5 – 0.050 4.6 – 0.030 2.7 – 0.040
0.030 4.6 – 0.267 5.1 – 0.274 8.8 – 0.289
0.010 8.7 – 0.157 8.6 – 0.157 7.2 – 0.175
Relative standard deviation (R.S.D) is expressed as: (standard deviation between observed concentrations/mean observed concentration) × 100; Relative error (R.E.) is expressed as: (mean observed concentration/nominal concentration) × 100.
Table S7.Pharmacokinetic parameters of four coumarins after oral administration of YGC content in rat, each value represents the mean ± SD (n=6)
Pharmacokinetic psoralen isopsoralen imperatorin isoimperatorin
K10 / (h–1) 0.230 ± 0.021 0.677 ± 0.086 0.249 ± 0.019 0.347 ± 0.046
K12 / (h–1) 0.866 ± 0.422 0.437 ± 0.023 1.536 ± 0.012 0.372 ± 0.034
K21 / (h–1) 0.584 ± 0.081 0.44 ± 0.053 1.179 ± 0.101 0.408 ± 0.097
t1/2 / (h) 8.292 ± 0.211 3.831 ± 0.026 7.365 ± 0.254 4.841 ± 0.105
Cmax / (μg mL–1) 2.452 ± 0.332 2.221 ± 0.242 0.684 ± 0.103 0.285 ± 0.035
Tmax / (h) 0.75 ± 0.21 1.00 ± 0.32 2.00 ± 0.27 1.00 ± 0.36
AUC 0→t /(μg mL
–1 h–1) 16.663 ± 2.675 8.885 ± 1.821 7.564 ± 1.324 1.743 ± 0.654
AUC 0→∞/(μg mL
–1 h–1) 19.127 ± 2.856 9.036 ± 1.956 8.322 ± 1.776 1.809 ± 0.994
K10:central compartment elimination rate contrant; K12:central to peripheral compartment rate contrant; K21:peripheral to central compartment rate contrant; t1/2: elimination terminal half life; Cmax: maximum plasma concentration; Tmax: time to reach the maximum plasma concentration; AUC 0→t: area