ISSN 0104-6632 Printed in Brazil
www.abeq.org.br/bjche
Vol. 23, No. 02, pp. 171 - 181, April - June, 2006
Brazilian Journal
of Chemical
Engineering
DESIGN AND OPTIMIZATION OF NEW
SIMULATED MOVING BED PLANTS
D. C. S. Azevedo
1*and A. E. Rodrigues
21
Grupo de Pesquisa em Separações por Adsorção (GPSA), Departamento de Engenharia Química, Universidade Federal do Ceará, Fone: +(55) (85) 4008-9611, Fax: +(55) (85) 4008-9610,
Campus Universitário do Pici, Bl. 709, CEP 60.455-760 Fortaleza - CE, Brasil. E-mail: [email protected]
2
Laboratory of Separation and Reaction Engineering (LSRE), Faculdade de Engenharia, University of Porto Rua Dr. Roberto Frias s/n, 4200-465 Porto, Portugal.
(Received: April 15, 2005 ; Accepted: March 06, 2006)
Abstract - The simulated moving bed (SMB) technology has attracted considerable attention for its efficiency
as a chromatographic adsorptive separation. It has been increasingly applied to the separation of binary mixtures with low separation factors, namely to separate isomers. Although quite a vast amount of information has been published concerning the simulation and design of operating conditions of existing SMB plants, fewer works have addressed the question of design and optimisation of geometric parameters and operating conditions of a new adsorber, especially when mass transfer resistances are significant. The present work extends an algorithm developed elsewhere to design SMB equipment and optimize its operating conditions and applies it to the case of fructose-glucose separation using a cation-exchange resin as stationary phase in order to obtain nearly pure fructose in the extract and glucose in the raffinate. The constraints were set as 99% purity for both products. The objective function was chosen to be the adsorbent productivity. The algorithm attempted to find the minimum column lengths for increasing throughputs, which met the required purity constraint. Then, the best construction parameters and operating conditions were chosen as those for which the adsorbent productivity was maximum. The effects of the safety margins applied on the velocity ratios in sections 1 and 4 were examined and a heuristic rule for optimum eluent flowrate was derived. The effect of the purity requirements was also investigated. Finally, the calculated optimal operating points, in terms of flowrate ratios in SMB sections 2 and 3, were analysed in the frame of the equilibrium theory. Sound coherence was verified, which confirmed the accuracy and adequacy of the extended algorithm for the design and optimisation of a SMB adsorber with strong mass transfer effects.
Keywords: SMB; Design; Optimisation
INTRODUCTION
The simulated moving bed technology has been very popular for the last four decades as a continuous chromatography-based operation to separate binary mixtures. The most commonly used configuration is depicted in Figure 1. It consists of a set of fixed beds connected in a closed circuit with two inlet and two outlet streams. The inlet streams are the mixture to be separated (the load or feed) and a suitable solvent to displace the chemical species being separated (the eluent or desorbent). The outlet streams collect the purified chemical species from the initial mixture: the extract contains the most strongly adsorbed species and the raffinate, the weakly adsorbed one.
Due to the relative complexity of its physical implementation, the definition of the number and dimensions of columns and operating conditions (flowrates and switching time) of a SMB adsorber is not a straightforward task. The flowrates and switching time must be such in order to allow the strongly retained species to concentrate around the extract port and be majorily adsorbed around the raffinate port. The reverse must be true for the weakly adsorbed species: it should concentrate in the bulk liquid phase surrounding the raffinate port.
Since it is a fruitless effort to search for suitable SMB operating conditions by trial-and error procedures, the design of SMB adsorbers has
attracted significant attention from the academic community. The simplest case may be formulated for systems with linear uncoupled adsorption isotherms. The analysis of the equivalent representation of a true moving bed under an equilibrium model leads to explicit inequality relations between solid and liquid flowrates in the four TMB sections (see Table 1). Nicoud (1992) as well as Ching and Ruthven (1985) changed these inequality relations into design equations by introducing a common safety margin β. Therefore, for linear systems, the SMB system is exclusively a flow-controlled process. That is to say, its design does not depend on the feed concentration in the frame of equilibrium theory.
Figure 1: Schematic drawing of a SMB. The continuous arrows represent stream positions at time “t” and the dashed arrows represent those positions at time “t-t*”.
Table 1: Operating Conditions for the Complete Separation under the Equilibrium Theory. Linear Adsorption Isotherms. (Ching and Ruthven, 1985; Nicoud, 1992)
Isotherm equation: * ' i i i
q =K C where i A,B= (1) '
A 1
K <m < ∞ (2)
' '
B 2 3 A
K <m <m <K (3) '
4 B
0<m <K (4)
where
( ) ( )
SMB j
j j
c
Q t *
m 1
1 1 V
⎛ ⎞
ε ε ⎜ ⎟
= γ = −
⎜ ⎟
Non-linear behaviour of the isotherms adds to the dependency of the flowrates the feed concentration as an influencing factor. The equilibrium theory applied to non-linear equilibria was originally addressed by Storti et al (1993) and Mazzotti et al (1996), who proposed explicit relationships to locate the boundaries of the separation region in a m2×m3 plane for isotherms of Langmuir and modified Langmuir type. The main finding provided by the equilibrium theory is certainly the explicit definition of the boundaries of separations regions in terms of the solid and fluid flowrates in SMB sections. Furthermore, it is always a useful check and source of comparison for design strategies that incorporate nonideal effects. However, equations from the equilibrium theory refer to flowrate conditions under which a SMB adsorber may achieve 100% purity for both extract and raffinate products, independently on column number and dimensions. In practice, the results are only applicable for columns with a sufficiently high number of theoretical stages (low HETP). Fortunately, for most applications, fairly inefficient columns may safely be used in a SMB operated under the conditions stated by the equilibrium theory (Charton and Nicoud, 1995). Alternatively, adsorbent particle size and column dimensions may also be tailored to overcome such effects as axial mixing and mass transfer resistances, which are main sources of deviation from the results of the equilibrium theory. Nevertheless, some authors have attempted to refine the scope of the equilibrium theory, so as to include those non-ideality effects into the design of operating conditions of SMB adsorbers. Pais et al (1997) shaped the regions of separation under nonideal effects by using a detailed model with intraparticle mass transfer being described with a simple LDF approximation. It was shown that the set of values of fluid/solid flowrate ratios in the m2×m3 is considerably reduced when mass transfer effects are present, even for a constraint of 99% on product purities. Similar results were obtained by Migliorini et al (1999). By using a complete detailed model, they defined the regions of separation in the
3 2
m
m
×
plane for decreasing purity requirements (99%, 95%, …, 60%). For SMB columns having the number of theoretical stages above a threshold value (40), the regions of separation would enlarge with decreasing purity requirements as compared to the region defined by the equilibrium theory. On the other hand, for less efficient columns, the regions of separation will virtually “shrink” in comparison with the ideal region and they may eventually not exist whether the constraint on purity is too strict or thecolumns have a plate number far below the limiting value. Both of these works attributed values to the flowrate ratios in sections 1 and 4 in accordance with the explicit relations defined in the equilibrium theory with a given safety margin. Azevedo and Rodrigues (1999) observed the impact of varying the values of the constraints for these sections on the resulting separation regions obtained for low-efficient columns. Instead of a 2-dimensional parameter space, a three dimensional separation volume is used to present the obtained separation regions as a function of the velocity ratio in section 1.
plotted in a parameter space and sound coherence is observed when compared to the predictions from the equilibrium theory.
THEORY UNDERLYING THE DESIGN ALGORITHM
This design strategy essentially determines the minimum column dimensions (length and section) and operating conditions that allow treating a required throughput and achieving a desired purity in the outlet streams without exceeding given pressure drop limits imposed by the packing material. The number of degrees of freedom in the design problem is, therefore seven: column length and diameter, switching time and the four section velocity ratios
j
γ . The algorithm to be applied is an extension of that developed by Biressi et al (2000). However, instead of using a model of equilibrium stages, we have used a detailed TMB steady-state model, as described in a previous publication (Azevedo and Rodrigues, 1999), since this system (fructose-glucose on ion-exchange resin) involves considerable mass transfer resistance, which is adequately predicted with a rigorous model. Another novel aspect is the search for the optimal safety margin β to be applied in the velocity ratio constraints in sections 1 and 4, using the adsorbent productivity as objective function.
The flow constraints as stated from the equilibrium model, equations (2), (3) and (4), have been used as general guidelines to provide an initial guess for γj. The other pieces of information to be used in the design/optimisation algorithm are:
A correlation to estimate pressure drop in packed beds, such as the Kozeny-Kárman equation:
(
)
23 2 c p 1 P 150 L d − ε
Δ = μυ
ε (6)
A detailed and computationally fast process model, such as that presented by Azevedo and Rodrigues (1999).
According to the guidelines proposed by Biressi et al (2000), the following two assumptions are made: i A given SMB recycle flowrate (Q1) is assumed
and all other flowrates and column cross section are obtained based on that value. After the algorithm calculations are finished, a scale parameter
Ω
is calculated as the ratio between the desired feed flowrate and the theoretical feed flowrate, which is that obtained for the recycle flowrate assumed a priori. All other calculatedflowrates and section area may be multiplied by the scale factor to obtain the values necessary to process the desired feed flowrate. Calculated
j
γ and L values remain unchanged. c
ii Since pressure drop is proportional to the throughput of the plant, we expect that the productivity will be the highest when pressure drop is the highest possible in the plant. Therefore, pressure drop in section 1, which is where the fluid velocity is maximum, should be equal to the allowable upper limit, hence fixing the value of the product υ ×1 Lc from equation (6).
From the adsorption isotherms and using a certain safety margin β≥, values for γ1 and γ4 are set so as to ensure the proper behaviour of sections 1 and 4, that is, complete regeneration of the adsorbent and eluent, respectively. β is an input parameter to the algorithm so that γ = β× ν1 K'FR and γ = ν4 K'GL β. Design results for different values of β are compared.
At this point, Q , 1 υ ×1 Lc, γ1 and γ4are defined. Three from the initially seven degrees of freedom (γ γ γ γ1, 2, 3, 4, t*, L , Ac ) of the design problem are left to be defined: the column length and the velocity ratios γ2and γ3. To define the most adequate values for these variables, heuristic rules based on the equilibrium theory are applied having product purities as decision parameters.
The parameter η is defined as the dimensionless distance of a certain
(
γ γ2, 3)
pair to the optimum point given by the equilibrium(
νK , K'B ν 'A)
. In other words:(
FR GL)
3 2 3 2
eq eq ' '
3 2 K K
γ − γ γ − γ
η = =
γ − γ ν − (7)
For each value of
η
within a certain range defined by the user, the algorithm manages to find the minimum column length and γ2, which lead to the required product purities. For a given value ofη
, the algorithm starts with the minimum γ2 value defined by the equilibrium theory(
νK'FR)
and a sufficientlysmall value for L . All information required by the c process model simulator is available by then and process performance is calculated using a detailed TMB model. Depending on the product purities calculated, the algorithm applies a heuristic rule and makes one of the following decisions:
Increase column length;
Figure 2:
Flowsheet des
cri
bing
The flow sheet describing the decision-making process of the algorithm may be found in Figure 2. The inner loop shows that, for a certain
η
, the algorithm will stop when the minimum column length that provides the required purities is found. These data will be stored together with the corresponding operating conditions. Plots ofη
versus column length and adsorbent productivity are then constructed. Adsorbent productivity (kg/hr/m3) is defined as the amount of fructose/glucose obtained per unit time divided by the inventory of adsorbent. The value ofη
which maximises productivity, for instance, defines the optimal operating point and column length for a given β. The scale factor corresponding to this optimal condition is also obtained (Ω =Q (desired) Q (theoretical)F F ). By multiplying the obtained section area and flowrates by Ω, one is able to re-scale all necessary operating conditions for any desired throughput.The procedure described in the previous paragraphs (following assumptions i and ii) is repeated for different values of β. An optimum β value (and the respective construction and operating parameters) may be found from the maximum in adsorbent productivity.
RESULTS AND DISCUSSION
This procedure was applied to the separation of fructose-glucose mixtures under the following conditions:
Concentration of each sugar = 400 g/l;
Viscosity = 3 cP;
Specific mass = 1260 kg/m3;
Maximum pressure drop = 2.5 bar/column;
Adsorbent: Dowex Monosphere 99/Ca, d = 320 p
μm;
Linear isotherms with K'GL=0.27 and K'FR= 0.53;
T=50ºC;
12 columns;
Purity constraint = 99% for both extract and raffinate;
The results obtained from the design algorithm will be presented as plots showing the minimum column length and adsorbent productivity as a
function of parameter
η
. This parameter isintrinsically related to the amount of feed being treated, that is, the required throughput. Figure 3 illustrates the results obtained for increasing safety margins
β
, so that γ = β× ν1 K'FR and γ = ν4 K'GL β were assumed in each case. The degree of subdivision was considered, a priori, as 3 columns per section. The axis <PR > stands for the average i adsorbent productivity calculated as follows:(
)
i X R
Pr 0.5 Pr Pr
< >= +
3 X
3
Pr (kg/m /hr)
Mass rate (kg/hr) of fructose obtained in the extract Volume (m ) of stationary phase
=
=
3 R
3
Pr (kg/m /hr)=
Mass rate (kg/hr) of glucose obtained in the raffinate =
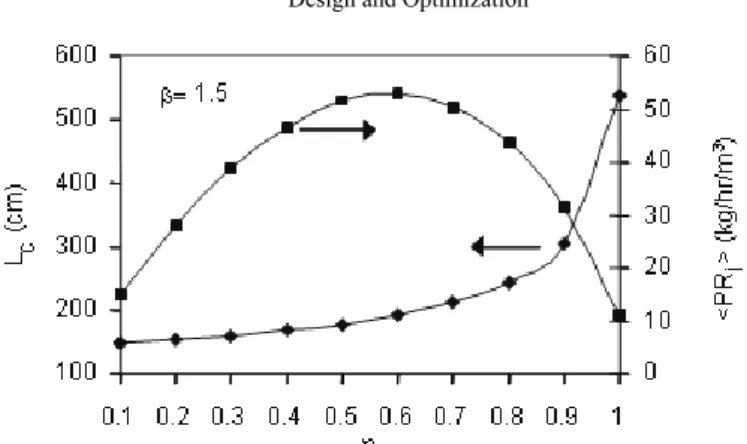
Figure 3: Minimum column lengths and corresponding average productivities as a function of required throughput (η) for different safety margins (β) imposed on sections 1 and 4
It is clear that an increasing adsorbent inventory becomes necessary as the SMB adsorber is required to treat greater throughputs. This is shown by the rise in the values of L obtained, which is initially slow c and then becomes steep for
η
>
0.8. This may indicate that it is wise to avoid operating a SMB plant close to the theoretical maximum throughput (η
=1) because a very large adsorbent inventory would be required to achieve the same purity. This is further confirmed by the fact that the packing is less efficiently used under this condition. In all plots, the average adsorbent productivity reaches a maximum value atη
around 0.6 to 0.7 and it declines abruptly thereafter.In regards to the effect of the safety margin
β
, the design algorithm results confirm that shorter columns, or smaller adsorbent inventory, are required as this parameter is increased. The adsorbent productivity also tends to increase for higher values ofβ
. The optimal column length wasselected for each value of
β
as that for which productivity is maximum. Figure 4 shows the optimal column lengths as a function of the average adsorbent productivity (<PR >) and the average i solvent consumption (<SC >). The average solvent i consumption is defined as:(
)
i X R
SC 0.5 SC SC
< > = +
3 3
X
Flowrate of solvent present in the feed and eluent streams (m /s) SC (m /kg)
Mass rate (kg/s) of fructose obtained in the extract
=
3 3
R
Flowrate of solvent present in the feed and eluent streams (m /s) SC (m /kg)
Mass rate (kg/s) of glucose obtained in the raffinate
=
The numbers in the plot stand for the respective values of
β
. The solvent consumption increases steadily as the safety margin is increased with a steep rise forβ
>1.3. The adsorbent productivity reaches a new peak at the very same value ofβ
. Therefore, for the present case, the parameters calculated forβ
=1.3 define the optimal operating conditions for a SMB adsorber with 3 columns per section given a required minimum purity of 99%.Another interesting point is raised when confronting the optimal (γ γ2, 3) pairs obtained for
each value of
η
. Figure 5 shows the path of points in a γ × γ2 3 parameter space for increasing values of the safety marginβ
. All “paths” convergeto the point (νK'GL, Kν 'FR), which is the optimal operating point as predicted by the equilibrium theory. However, from the standpoint of adsorbent productivity, the design algorithm using a detailed model indicates that the optimal operating point is located at
η
=0.7, rather than atη
=1.Figure 5: Path of optimal operating points in a γ × γ2 3 parameter space for different safety margins
β
.For
β
=1.3, the optimal geometric parameters, flowrates and switching time are summarized in Table 2, assuming a recycle flowrate of 1000 ml/min in section 1. The rows corresponding toη
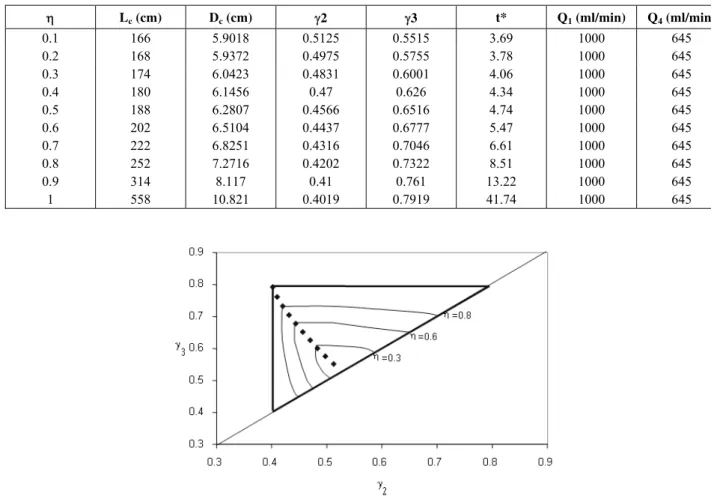
= 0.3, 0.6 and 0.8 were selected and the respective geometric parameters and operating conditions (t*,γ γ1, 4) were used in order to find the separation area for which both product purities would be higher than 99%. This was done by scanning the equilibrium triangle with a sufficiently fine grid and by performing successive simulations. Figure 6 shows the obtained regions of separation as compared to the optimal (γ γ2, 3) pairs found by the design algorithm. The vertex of each of the separation “triangles” coincides with the corresponding optimal point as calculated by the design algorithm for that value ofη
.The same analysis carried out previously was applied to the following SMB column subdivisions: 4-3-3-2; 3-4-3-2 and 3-3-4-2. The purity constraint was kept at 99% and
β
=1.1. Little deviations were observed by changing the relative length of thesections. Figure 7 shows the results obtained for minimum column length and corresponding productivity, where the lines join the points obtained for the same value of
η
. Some productivity enhancement is obtained when the size of section 4 is reduced in favour to sections 1 and 3. Yet, the maximum productivity obtained for this configuration is inferior to that obtained forβ
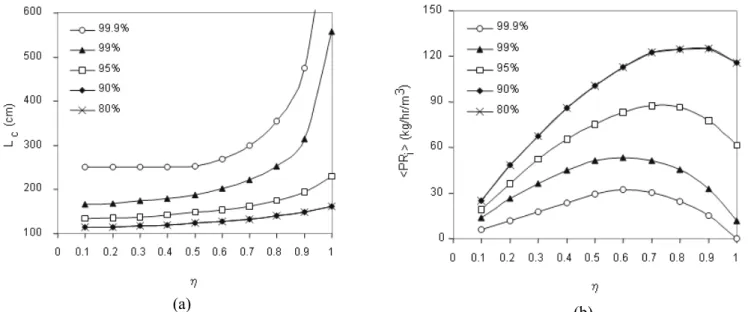
=1.3 and 3 columns per section.Finally, the effect of the requirement on product purity was investigated. For a SMB with 3 columns per section and
β
=1.3, the design algorithm was applied for the following minimum product purities: 99.9%, 99%, 95%, 90% and 80%. Figure 8 shows the obtained plots of the minimum column lengths (a) and respective productivity (b) as a function ofη
. As expected, the required column lengthTable 2: Summary of optimal geometric and operating parameters found by the design algorithm for increasing feed flowrates and
β
=1.3.η Lc (cm) Dc (cm) γ2 γ3 t* Q1 (ml/min) Q4 (ml/min)
0.1 166 5.9018 0.5125 0.5515 3.69 1000 645
0.2 168 5.9372 0.4975 0.5755 3.78 1000 645
0.3 174 6.0423 0.4831 0.6001 4.06 1000 645
0.4 180 6.1456 0.47 0.626 4.34 1000 645
0.5 188 6.2807 0.4566 0.6516 4.74 1000 645
0.6 202 6.5104 0.4437 0.6777 5.47 1000 645
0.7 222 6.8251 0.4316 0.7046 6.61 1000 645
0.8 252 7.2716 0.4202 0.7322 8.51 1000 645
0.9 314 8.117 0.41 0.761 13.22 1000 645
1 558 10.821 0.4019 0.7919 41.74 1000 645
Figure 6: Equilibrium separation triangle as compared to the separation areas calculated for the conditions given by the design algorithm at
η
=0.3, 0.6 and 0.8.(a) (b)
Figure 8: Design algorithm results showing the effect of minimum purity required on minimum column length (a) and the respective adsorbent productivity (b).
CONCLUSIONS
A design package to define construction and operating parameters of a SMB unit was applied to the case of fructose-glucose separation on ion-exchange resins, which generally impose significant internal mass transfer resistance. The results were used for optimization purposes. For the linear system under study, it has been demonstrated that SMB units operate inefficiently at the vertex of the equilibrium triangle (νK , K'B ν 'A), which is the optimum operating point in the frame of the equilibrium theory. Maximum productivity is achieved at 0.6<
η
<0.8. A safety margin of 1.3 was found to be ideal in order to obtain optimal performance in terms of adsorbent productivity. The optimal operating points in a parameter space γ2×γ3 arecoherent with the predictions drawn from the equilibrium theory. Changes in the relative size of one section to another do not significantly alter the obtained results. Superior productivity may eventually be obtained by decreasing the size of section 4 in favour of section 1 or 3. For decreasing purity requirements, required column lengths become shorter and the obtained productivity is higher. The bottom line for these trends was found when the required product purity comes to as low as 90%. A lower constraint on purity does not produce either further improvement in productivity or a decrease in column length.
ACKNOWLEDGEMENTS
The authors wish to thank CAPES (Ministry for Education of Brazil) and Fundação da Ciência e Tecnologia (FCT-Ministry for Science and Technology of Portugal) for funding this research.
NOMECLATURE
A Area of a SMB column cross section
(m2)
dp Adsorbent particle diameter (m)
K’ Linear adsorption constant for a homogeneous adsorbent
particle
(dimensionless)
Lc Length of a SMB column (m)
mj Ratio between liquid and solid
flowrates in a TMB section j
(dimensionless)
Qj Liquid flowrate in a SMB
section j
(m3/s)
T Temperature (ºC)
t* Switching time (min)
Vc Volume of a SMB column (m3)
Greek Letters
β Safety factor applied on section velocity ratios (>1)
(dimensionless)
j
γ Ratio between liquid and solid interstitial velocities in a TMB section j
(dimensionless)
P
Δ Pressure drop across a packed bed
(Pa)
ε Void fraction between particles in a packed bed
(dimensionless)
η
Dimensionless feed flowrate (dimensionless)μ
Absolute viscosity (kg/m/s)ν Ratio between solid and fluid volumes (=
(
1− ε ε)
)(dimensionless)
Ω Scale factor (dimensionless)
Subscripts/Superscripts
1,…,4 SMB/TMB section (-)
A, B Strongly and weakly adsorbed chemical species, respectively
(-)
eq In the frame of the equilibrium theory
(-)
F Feed (-)
FR, GL Fructose and glucose, respectively
(-)
REFERENCES
Azevedo, D. C. S. and Rodrigues, A.E., Bi-linear driving force approximation in the modeling of simulated moving bed using bidisperse adsorbents, Ind. Eng. Chem. Res., 38, 3519-3529 (1999).
Azevedo, D. C. S. and Rodrigues, A.E., Design of a Simulated Moving Bed in the Presence of Mass-Transfer Resistances, AIChE Journal, 45, 956-966 (1999).
Azevedo, D. C. S. and Rodrigues, A.E., Design Methodology and Operation of a Simulated Moving Bed Reactor for the Inversion of Sucrose and Glucose-Fructose Separation, Chem. Eng. Journal, 82, 95-107 (2001).
Biressi, G., Ludemann-Hombourger, O., Mazzotti, M., Nicoud, R.-M. and Morbidelli, M., Design and Optimisation of a SMB Unit: Role of Deviations from Equilibrium Theory, J. Chromatography A, 876, 3-15 (2000).
Charton, F. and Nicoud, R.-M, Complete Design of a Simulated Moving Bed, J. Chromatography A,
702, 97-12 (1995).
Ching, C. B. and Ruthven, D. M., Experimental Study of a Simulated Counter-Current Adsorption
System - III. Sorbex Operation, Chem. Eng. Sci.,40, 1411-1417 (1985).
Ludemann-Hombourger, O., Bailly, M., Nicoud, R.-M., Design of a Simulated moving bed: Optimal Particle Size of the Stationary Phase, Sep. Sci. & Technol., 35, 1285-1305 (2000).
Mazzotti, M., Storti, G., Morbidelli, M., Robust Design of Countercurrent Adsorption Separation: 3. Nonstoichiometric Systems, AIChE Journal, 42, 2784-2796 (1996).
Migliorini, C., Gentilini, A., Mazzotti, M. and Morbidelli, M, Design of Simulated Moving Bed Units under Nonideal Conditions, Ind. Eng. Chem. Res., 38, 2400-2410 (1999).
Nicoud, R.-M., The Simulated Moving Bed: A Powerful Chromatographic Process, LC-GC Intl., 5, 43-47 (1992).
Pais, L. S., Loureiro, J. M. and Rodrigues, A. E., Modeling, Simulation and Operation of a Simulated Moving Bed for Continuous Chromatographic Separation of 1,1'-bi-2-naphtol Enantiomers, J. Chromatography A, 827, 215-233 (1997).
Schramm, H., Kaspareit, M., Kienle, A. and Seidel-Morgenstern, A., Improving SMB process by cyclic modulation of the feed concentration, Chem. Eng. Technol. 25, 1151-1155 (2002). Storti, G., Mazzotti, M., Morbidelli, M. and Carrá,
S., Robust Design of Binary Countercurrent Adsorption Separation Processes, AIChE J., 39, 471-492 (1993).
Subramani, H. J., Hidajat, K. and Ray, A. K. Optimization of Simulated Moving Bed and Varicol Processes for Glucose-Fructose Separation, Trans IchemE, 81, part A, 549-567 (2003).