Copyright © 2007 by Sociedade Brasileira de Pediatria
O
RIGINALA
RTICLEThe use of bioelectrical impedance to detect excess
visceral and subcutaneous fat
Rômulo A. Fernandes,1 Clara S. C. Rosa,2 Camila Buonani,2 Arli R. de Oliveira,3 Ismael F. Freitas Júnior4
Abstract
Objective:To analyze bioelectrical impedance performance in detecting the presence of excess visceral fat and overweight/obesity in young Brazilians and how its values are related with them.
Methods:Study sample consisted of 811 adolescents of both genders (11 to 17 years of age). Nutritional status was determined based on triceps skinfold thickness (TSF), relative body fat (bioelectrical impedance), and excess visceral fat as determined by waist circumference. Statistical analysis was performed using means, standard deviations, linear correlation, Student’sttest, and ROC curve.
Results:Bioelectrical impedance achieved good performance in identifying excess visceral fat associated with overweight/obesity in both genders, and was found to be more specific (male 92.4% and female 93.8%) than sensitive (male 86.1% and female 71.8%).
Conclusion:Our findings support the use of bioelectrical impedance to identify the presence of excess visceral and subcutaneous fat in adolescents.
J Pediatr (Rio J). 2007;83(6):529-534:Abdominal circumference, nutritional status, obesity, adolescents, bioelectrical impedance.
Introduction
Over the last three decades, the prevalence of over-weight and obesity has increased at alarming rates around the world.1Because obesity is associated with the
develop-ment of risk factors for metabolic syndrome,2-3elevated
health care costs,4and reduction of life expectancy,5this
increase has been a source of concern to health care profes-sionals and must be monitored closely. Following this world-wide trend, overweight and obesity are already highly prevalent among young people in Brazil.1,6Special attention
must be paid to identification and management of childhood obesity, since it tends to persist into adulthood.7Therefore,
given the importance attached to obesity, the development of useful and reliable techniques for its accurate identification among children and adolescents also becomes relevant.
Because anthropometry (ANT) and bioelectrical imped-ance analysis (BIA) are relatively simple techniques that show significant correlations with body fat,8-10they have been
widely used in epidemiological studies.9-13However, in
Bra-zil, although BIA has become more popular over the last years, no studies to date have analyzed the effectiveness of body fat values measured by BIA and how they relate to excess vis-ceral and subcutaneous adipose tissue in young Brazilians.
Thus, the aim of this study was to analyze, in a sample made up of adolescents, the relationship of body fat assessed
1. Mestrando, Centro de Educação Física e Esporte (CEFE-UEL), Londrina, PR, Brazil.
2. Acadêmica de Educação Física, Departamento de Educação Física, Universidade Estadual Paulista (UNESP), Presidente Prudente, SP, Brazil. 3. Doutor. CEFE-UEL, Londrina, PR, Brazil.
4. Doutor. Departamento de Educação Física, UNESP, Presidente Prudente, SP, Brazil.
This study was developed at Universidade Estadual Paulista (UNESP), Presidente Prudente, SP, Brazil.
No conflicts of interest declared concerning the publication of this article.
Suggested citation:Fernandes RA, Rosa CS, Buonani C, Oliveira AR, Freitas Júnior IF. The use of bioelectrical impedance to detect excess visceral and subcutaneous fat. J Pediatr (Rio J). 2007;83(6):529-534.
Manuscript received May 08 2007, accepted for publication Aug 08 2007.
doi 10.2223/JPED.1722
by BIA with excess visceral and subcutaneous fat, as deter-mined, respectively, by waist circumference (WC) and tri-ceps skinfold thickness (TSF), and the effectiveness of this method in identifying its presence.
Methods
This is a cross-sectional study conducted in the city of Presidente Prudente (population ~180,000) in 2006. The sample size of 805 subjects was calculated to detect a preva-lence of overweight and obesity of 28.5%,14with a sample
error of 3.1%, and statistical significance level of 5%. Based on data from a pilot study, the loss rate was estimated in 6%. Hence, data were collected from 853 subjects.
For selection of the sample in the initial stage of the research project, data were collected and the municipality of Presidente Prudente was subdivided into five separate regions (North, South, East, West, and central). Base on the informa-tion thus obtained, it was noted that the central region was served by the greatest number of streets and throughways, and the most easily accessible from anywhere in the city by the main urban transport lines. Consequently, it was also the region with the largest portion of educational institutions of the private school network. Five schools were randomly selected for this study from within the universe of private schools located in that region.
All adolescents enrolled in middle and high school classes at the five schools chosen were invited to take part in the study. Of these, a total of 860 agreed to participate in the study, declared that they had never been diagnosed with any metabolic disease and returned an informed consent form duly signed by their parents or guardians. However, 49 sub-jects were excluded from the sample (30 male and 19 female) due to absences in the course of evaluations. Because they had been absent from evaluations it was impossible to detect possible differences in the variables analyzed between the excluded group (n = 49) and the sample studied (n = 811). The final sample thus comprised 811 healthy adolescents of both genders from 11 to 17 years of age (365 male and 446 female), which represents more than 15% of the total num-ber of students in this age bracket enrolled in the municipali-ty’s private school network.
An informed consent was obtained from all participants and their respective guardians before beginning the research, and the study protocol was approved by the Research Ethics Committee of the Universidade Estadual Paulista – UNESP (Presidente Prudente).
The adolescents’ chronological ages were determined cen-tesimally from birth and assessment dates. The main anthro-pometric variables studied were body weight, height, TSF, and WC. Body weight was measured using a portable digital scale accurate to 0.1 kg and maximum capacity of 150 kg. Height was measured using a wooden stadiometer accurate to 0.1 cm and with a measuring range of 200 cm. Body mass index
(BMI) was calculated as body weight divided by squared height (kg/m2). Body weight and height data were collected
following standardized procedures described in the litera-ture,15and all measurements were performed with subjects
standing barefoot and wearing light clothes. Triceps skinfold thickness, used as an indicator of excess subcutaneous adi-pose tissue, was measured using a Lange skinfold caliper (Cambridge Scientific Industries, Inc., Cambridge, Mary-land) according to recommendations found in the litera-ture.16Waist circumference was used as an indicator of excess
visceral adipose tissue and measured in duplicate at the nar-rowest point between the iliac crest and the lowest rib using a flexible metal anthropometric tape graduated in millimeters (mm).17
Body resistance and reactance (ohm) were measured with a portable body composition analyzer (BIA Analyzer – 101Q, RJL Systems, Detroit, USA). The device was calibrated before testing using a 500-ohm resistor provided by the manufac-turer. Bioelectrical impedance analysis (BIA) was performed in the morning after an overnight fast and the first urine void. All procedures were performed with the subjects lying supine on a nonconductive flat surface (mat) after their shoes, socks, and any kind of metal jewelry (earrings, bracelets, neck-laces, etc) had been removed. The transmitting electrodes were placed on the posterior surface of the right hand at the distal end of the third metacarpal and on the anterior surface of the right foot at the distal end of the second metatarsal, at least 5 cm from the receiving electrodes, which were posi-tioned between the radial and ulnar styloids and between the medial and lateral malleoli of the ankle.18Percent body fat
estimated by BIA (%BF-BIA) was calculated from the two sex-specific BIA equations developed by Sun et al.11The
pres-ence of excess body fat was assessed using sex-specific cutoff points (≥25% for males and >≥30% for females).19The
presence of excess subcutaneous and visceral adipose tis-sues was estimated using two sex- and age-specific cutoff points: one for TSF (≥85th P), developed by Must et al.,20
and one for WC, developed by Taylor et al.,21respectively. All
subjects were classified according to these three cutoff points.
adiposity associated with overweight/obesity (TSF≥85th P). Statistical analyses were performed using SPSS software ver-sion 10.0 (Statistical Package for Social Science, SPSS Inc, Illinois, USA), and the significant level was set at p < 0.05.
Results
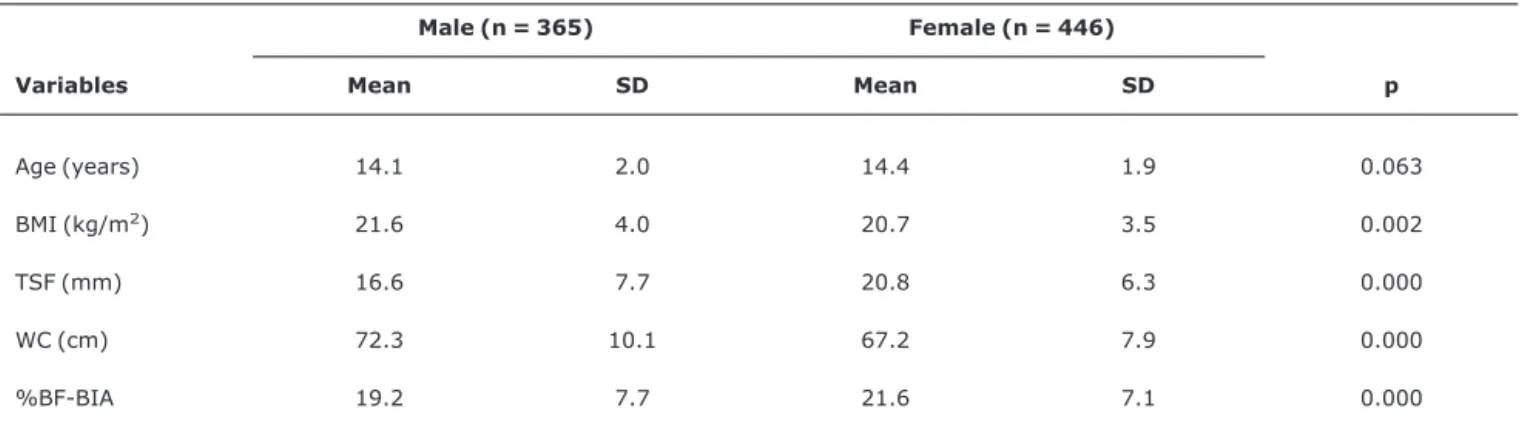
Study sample characteristics are shown in Table 1. Women accounted for 55% of the sample. Among anthropometric variables, only age did not differ significantly between gen-ders. Considering the entire sample, 15.4% of the subjects had excess abdominal fat, as determined by WC (male 21.8% and female 10.3%; p = 0.000), 17% had high levels of body fat (male 23.2% and female 11.9%; p = 0.000), and 36.2% had excess subcutaneous adipose tissue, as determined by TSF (male 45.6% and female 29%; p < 0.000).
Pearson's correlation coefficient showed that %BF-BIA was positively and significantly correlated (p < 0.001) with TSF and WC, for both male (r = 0.76 and r = 0.82, respec-tively) and female (r = 0.77 and r = 0.82, respecrespec-tively).
Sensitivity and specificity are directly related to the per-formance, or accuracy, of a test. Sensitivity is the ability of a test to identify true positive cases, and specificity is the abil-ity of a test to identify true negative cases.
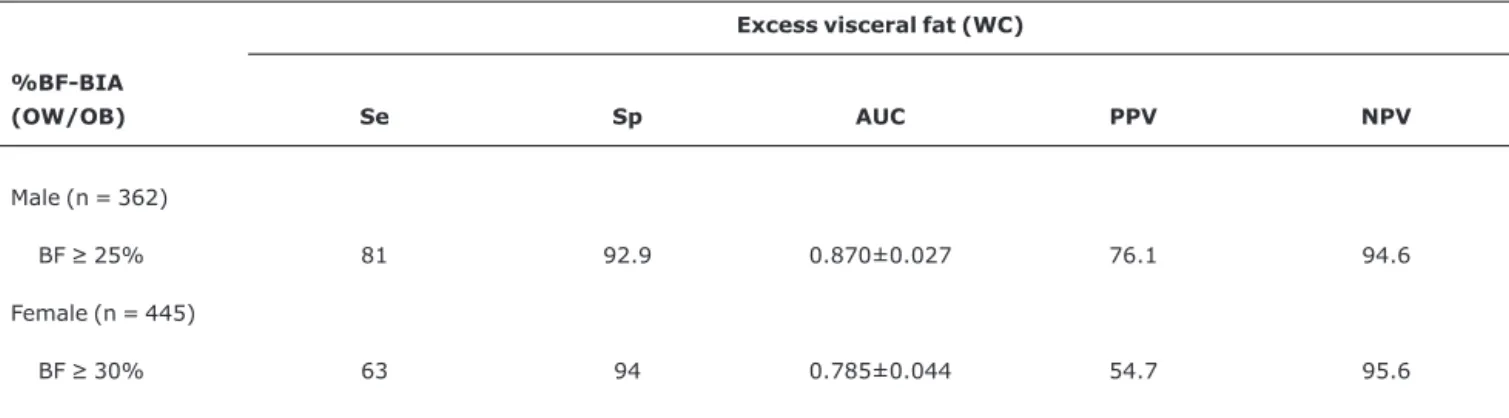
In the male group, regarding the presence of excess vis-ceral fat (Table 2), BIA has shown high accuracy in identifying obese (81% sensitivity), and non-obese (92.9% specificity) subjects, as well as elevated values in the other parameters of the ROC curve: AUC (0.87), PPV (76.1%) and NPV (94.6%). When compared with the male group, %BF-BIA was more accurate in indicating non-obese (94% specificity) subjects in the female group, but with lower sensitivity (63%).
When BIA effectiveness in identifying subjects with both excess visceral fat and excess subcutaneous adipose tissue was tested in both genders (Table 3), it showed specificity greater than 90% and sensitivity greater than 70%, suggest-ing that BIA is more specific than sensitive in this function.
Discussion
The identification and treatment of obesity during child-hood and adolescence are strategies used to prevent it from continuing into adulthood and, thereby, avert its harmful effects on health and the world economy.5,22Nevertheless, in
large population-based studies, the use of more accurate techniques for assessing body composition and, as a result, identifying the correct nutritional status becomes impracti-cable due to the high costs involved. Because of this, and also because of its consistent relationship with percent body fat measured by more accurate methods,11,21,23-25simple and
easy-to-perform procedures for identifying obesity and body fat distribution have become widely used.
In young populations, WC is an effective indicator of excess visceral fat,21,24,26which exhibits higher lipolysis rates
than subcutaneous fat and, therefore, causes the develop-ment of components of the metabolic syndrome (hyperten-sion, insulin resistance, and unfavorable lipid levels.27,28
Accordingly, the correlation coefficients found between %BF-BIA and WC, which were similar to those reported by Eisen-mann et al.24for children from 3 to 8 years old (r = 0.84),
may be considered a positive indication of BIA’s potential for identifying the presence of excess visceral fat in young populations.
Triceps skinfold thickness is a widely used measure of sub-cutaneous fat. Studies such as that conducted by Sardinha et al.10have suggested that its values are strongly correlated
with total body fat, and it has been successfully used as an indicator of nutritional status.20In our study, %BF-BIA has
shown a significant correlation with TSF, as was also observed by Pecoraro et al.8in a sample of Italian children. This finding
confirms the existence of significant relationships between body fat determined by BIA and visceral and subcutaneous adipose tissues.
The high correlation values found between TSF, WC and %BF-BIA are a good indicator of the viability of this method.
Table 1- Overall characteristics of the study sample
Male (n = 365) Female (n = 446)
Variables Mean SD Mean SD p
Age (years) 14.1 2.0 14.4 1.9 0.063
BMI (kg/m2) 21.6 4.0 20.7 3.5 0.002
TSF (mm) 16.6 7.7 20.8 6.3 0.000
WC (cm) 72.3 10.1 67.2 7.9 0.000
%BF-BIA 19.2 7.7 21.6 7.1 0.000
However, as pointed out by Sardinha et al.,10these values by
themselves do not determine the effectiveness of BIA in assessing the concomitant presence of excess visceral fat and overweight/obesity. For this purpose, more specific statisti-cal techniques, such as the ROC curve, should be used.
In regard to the ROC curve analysis, according to Vieira et al.,12choosing more sensitive or specific cutoff points has
sig-nificant implications on the desired objectives. High-sensitivity values mean that the method is more accurate in identifying obese young people, making it an important tool for stratifying and referring these patients to health care pro-fessionals. Conversely, highly specific methods result in a lower number of non-obese subjects being classified as obese (false-positive), thus preventing health care systems from becoming even more overburdened unnecessarily.
Overweight and obesity are increasingly prevalent1,6
among young Brazilians, as Ferreira et al.27have also pointed
out, posing a real threat to their health. Therefore, methods
that are more sensitive to the identification of obesity seem to be more appropriate to Brazilian reality.
Both the sensitivity and specificity values of %BF-BIA for identifying the presence of excess visceral fat associated with overweight/obesity were elevated, higher than those reported by Neovius et al.29for BMI, which is the anthropometric index
most commonly used throughout the world for identifying overweight and obese adolescents.
In our study, 90.5% and 91.5% of the adolescents with excess visceral fat and with combined excess visceral fat and overweight/obesity, respectively, had a high percentage of body fat measured by BIA. In addition, the AUC values, which represent the discriminative power of %BF-BIA, were usually high for indicating both excess visceral fat (male 0.87 and female 0.78) and combined excess visceral fat and overweight/obesity (male 0.89 and female 0.82). These high values of the AUC are reflected in the high values of PPV, which is the probability that a subject with a positive test will be a
Table 2- Sensitivity and specificity (%) of bioelectrical impedance for identifying the presence of excess visceral fat
Excess visceral fat (WC) %BF-BIA
(OW/OB) Se Sp AUC PPV NPV
Male (n = 362)
BF≥25% 81 92.9 0.870±0.027 76.1 94.6
Female (n = 445)
BF≥30% 63 94 0.785±0.044 54.7 95.6
AUC = area under the ROC curve; BF = body fat; %BF-BIA = percent body fat estimated by bioelectrical impedance analysis; OW/OB= overweight and obesity; NPV = negative predictive value; PPV = positive predictive value; Se = sensitivity; Sp = specificity; WC = waist circumference.
Table 3- Sensitivity and specificity (%) of bioelectrical impedance for identifying the presence of excess visceral fat associated with overweight/ obesity
OW/OB (TSF≥85th P) and excess visceral fat (WC) %BF-BIA
(OW/OB) Se Sp AUC PPV NPV
Male (n = 362)
BF≥25% 86.1 92.4 0.893±0.025 73.8 96.4
Female (n = 445)
BF≥30% 71.8 93.8 0.828±0.044 52.8 97.1
true positive, and NPV, which is the probability that a subject with a negative test will be a true negative. These results fur-ther indicate that, in population-based studies, %BF-BIA can be used with reasonable success to detect the presence of excess visceral fat alone or associated with overweight/ obesity in Brazilian adolescents.
Our data point to the viability of using BIA in population-based studies; however, the lack of equations specifically developed for the Brazilian population is a limitation of this method, indicating that care must be exercised in drawing inferences from these data. The authors believe that the need for equations that are specific for the Brazilian population should prompt further studies.
Conclusions
In sum, this study indicates that, overall, %BF-BIA is highly correlated with visceral and subcutaneous adipose tis-sue in both genders, being reasonably effective in discrimi-nating the presence or absence of excess visceral fat alone or associated with overweight/obesity.
Considering all the above, we conclude that %BF-BIA is a good indicator of excess visceral fat in Brazilian adolescents and that further studies aimed at developing equations that are specific for the Brazilian population are needed.
References
1. Wang Y, Monteiro C, Popkin BM. Trends of obesity and underweight in older children and adolescents in the United States, Brazil, China, and Russia. Am J Clin Nutr. 2002;75:971-7.
2. Guedes DP, Guedes JE, Barbosa DS, Oliveira JA, Stanganelli LC. Fatores de risco cardiovasculares em adolescentes: indicadores biológicos e comportamentais.Arq Bras Cardiol. 2006;86:439-50.
3. Ribeiro RQ, Lotufo PA, Lamounier JA, Oliveira RG, Soares JF, Botter DA.Fatores adicionais de risco cardiovascular associados ao excesso de peso em crianças e adolescentes: o estudo do coração de Belo Horizonte.Arq Bras Cardiol. 2006;86:408-18.
4. Wang G, Dietz WH.Economic burden of obesity in youths aged 6 to 17 years: 1979-1999. Pediatrics. 2002;109:E81-1.
5. Fontaine KR, Redden DT, Wang C, Westfall AO, Allison DB.Years of life lost due to obesity.JAMA. 2003;289:187-93.
6. Costa RF, Cintra IS, Fisberg M.Prevalência de sobrepeso e obesidade em escolares da cidade de Santos, SP.Arq Bras Endocrinol Metab. 2006;50:60-7.
7. Guo SS, Chumlea WC.Tracking of body mass index in children in relation to overweight in adulthood. Am J Clin Nutr. 1999;70(1 Part 2):145S-8S.
8. Pecoraro P, Guida B, Caroli M, Trio R, Falconi C, Principato S, et al.Body mass index and skinfold thickness versus bioimpedance analysis: fat mass prediction in children.Acta Diabetol. 2003;40 Suppl 1:S278-81.
9. Malina RM, Katzmarzyk PT.Validity of the body mass index as an indicator of the risk and presence of overweight in adolescents. Am J Clin Nutr. 1999;70(1 Part 2):131S-6S.
10. Sardinha LB, Going SB, Teixeira PJ, Lohman TG.Receiver operating characteristic analysis of body mass index, triceps skinfold thickness, and arm girth for obesity screening in children and adolescents. Am J Clin Nutr. 1999;70:1090- 5.
11. Sun SS, Chumlea WC, Heymsfield SB, Lukaski HC, Schoeller D, Friedl K, et al.Development of bioelectrical impedance analysis prediction equations for body composition with the use of a multicomponent model for use in epidemiologic surveys.Am J Clin Nutr. 2003;77:331-40.
12. Vieira AC, Alvarez MM, de Marins VMR, Sichieri R, da Veiga GV. Desempenho de pontos de corte do índice de massa corporal de diferentes referências na predição de gordura corporal em adolescentes. Cad Saude Publica. 2006;22:1681-90.
13. Bellizzi MC, Dietz WH.Workshop on childhood obesity: summary of the discussion. Am J Clin Nutr. 1999;70(1 Part 2):173S-5S.
14. Fernandes RA, Kawaguti SS, Agostini L, Oliveira AR, Ronque ERV, Freitas Júnior IF. Prevalência de sobrepeso e obesidade em alunos de escolas privadas do município de Presidente Prudente – SP. Rev Bras Cineantropom Desempenho Hum. 2007;9:21-7.
15. Gordon CC, Chumlea WC, Roche AF. Stature, recumbent length and weight. In: Lohman TG, Roche AF, Martorell R, editors. Anthropometric standardization reference manual. Champaign, IL: Human Kinetics; 1988. p. 3-8.
16. Harrison GG, Buskirk ER, Carter JEL, Johnston FE, Lohman TG, Pollock ML, et al. Skinfold thicknesses and measurement technique. In: Lohman TG, Roche AF, Martorell R, editors. Anthropometric standardization reference manual. Champaign, IL: Human Kinetics; 1988. p. 55- 70.
17. Callaway CW, Chumlea WC, Bouchard C, Himes JH, Lohman TG, Martin AD, et al. Circunferences. In: Lohman TG, Roche AF, Martorell R, editors. Anthropometric standardization reference manual. Champaign, IL: Human Kinetics; 1988. p. 39-54.
18. Heyward VH, Stolarczyk LM. Avaliação da composição corporal aplicada. São Paulo: Manole; 2000.
19. Williams DP, Going SB, Lohman TG, Harsha DW, Srinivasan SR, Webber LS, et al.Body fatness and risk for elevated blood pressure, total cholesterol, and serum lipoprotein ratios in children and adolescents.Am J Public Health. 1992;82:358-63.
20. Must A, Dallal GE, Dietz WH.Reference data for obesity: 85th and 95th percentiles of body mass index (wt/ht2) and triceps skinfold thickness.Am J Clin Nutr. 1991;53:839-46.
21. Taylor RW, Jones IE, Williams SM, Goulding A.Evaluation of waist circumference, waist-to-hip ratio, and the conicity index as screening tools for high trunk fat mass, as measured by dual-energy X-ray absorptiometry, in children aged 3-19 y.Am J Clin Nutr. 2000;72:490-5.
22. Chenoweth D, Leutzinger J. The economic cost of physical inactivity and excess weight in American adults. J Phys Activ Health. 2006;3:148-63.
23. Eto C, Komiya S, Nakao T, Kikkawa K.Validity of the body mass index and fat mass index as an indicator of the obesity in children aged 3-5 year.J Physiol Anthropol Appl Human Sci. 2004;23:25-30.
24. Eisenmann JC, Heelan KA, Welk GJ.Assessing body composition among 3- to 8-year-old children: anthropometry, BIA and DXA. Obes Res. 2004;12:1633-40.
26. Brambilla P, Bedogni G, Moreno LA, Goran MI, Gutin B, Fox KR, et al.Crossvalidation of anthropometry against magnetic resonance imaging for the assessment of visceral and subcutaneous adipose tissue in children. Int J Obes (Lon). 2006; 30:23-30.
27. Ferreira AP, Oliveira CE, França NM.Metabolic syndrome and risk factors for cardiovascular disease in obese children: the relationship with insulin resistance (HOMA-IR). J Pediatr (Rio J). 2007;83:21-6.
28. Sinaiko A. Obesity, insulin resistance and the metabolic syndrome.J Pediatr (Rio J). 2007;83:3-4.
29. Neovius MG, Linne YM, Barkeling BS, Rossner SO.Sensitivity and specificity of classification systems of fatness in adolescents. Am J Clin Nutr. 2004;80:597-603.
Correspondence: Rômulo Araújo Fernandes
Rua Santos, 620/202, Edifício Itamaracá CEP 86020-040 – Londrina, PR – Brazil Tel.: +55 (43) 3344.2812