Authors
Elaine Hillesheim 1 Valéria Laguna Salomão Ambrósio 1
Inalda Facincani 1
1 Universidade de São
Paulo.
Submitted on: 09/23/2015. Approved on: 01/07/2016.
Correspondence to:
Inalda Facincani. Hospital das Clínicas da Faculdade de Medicina de Ribeirão Preto - USP. Avenida Bandeirantes, nº
3900, Vila Monte Alegre, Ribeirão Preto, SP, Brazil. CEP: 14049-900
E-mail: inaldanefroped@gmail. com
Development of Height and Body Mass Index After Pediatric
Kidney Transplantation: Experience of the Nephrology Pediatric
Service at HCFMRP- USP, 2005-2014
Evolução de Estatura e Índice de Massa Corporal Após Transplante
Renal Pediátrico: Experiência do Serviço de Nefrologia Pediátrica do
HCFMRP-USP, 2005-2014
Introdução: A doença renal crônica em crianças geralmente determina o compro-metimento do estado nutricional. Embora o transplante renal (TxR) resolva os distúr-bios endócrinos e metabólicos, o crescimen-to continua a ser inadequado e o ganho de peso excessivo pode resultar em obesidade. Objetivos: Avaliar a evolução da estatura e do índice de massa corporal de crianças e adolescentes transplantados renais e iden-tificar fatores associados com o estado nu-tricional final. Método: Foram revisados os prontuários de 17 pacientes com seguimento regular até 24 meses após o (TxR). O esta-do nutricional foi avaliaesta-do por estatura para idade (E/I) e índice de massa corporal para idade (IMC/I). Foi considerado catch-up de crescimento o aumento no escore-z E/I ≥ 0,5 desvios-padrão. A análise de regressão linear múltipla foi utilizada para estimar a influ-ência de variáveis clínicas e demográficas na variação dos indicadores antropométri-cos aos 24 meses após TxR. Resultados: A média de idade foi 9,1 ± 4,1 anos. Após 24 meses de TxR, a média de escore-z E/I au-mentou de -2,66 ± 1,66 para -1,93 ± 1,08 (p ≤ 0,05), 47,0% dos pacientes apresen-taram catch-up de crescimento e a mesma proporção apresentou escore-z E/I < -2. A média do escore-z IMC/I aumentou de -0,48 ± 1,03 no TxR para 0,80 ± 0,94 no terceiro mês após TxR (p < 0,001) e manteve-se es-tável até 24 meses. A frequência de excesso de peso aumentou de 5,9% no TxR para 41,2% aos 24 meses. A idade (r = -0,66; p = 0,006) e o escore-z E/I no TxR (r = -0,72; p = 0,002) foram inversamente associados ao crescimento. Conclusão: Após 24 meses de TxR verificou-se crescimento insuficiente para recuperação do déficit estatural e ganho ponderal excessivo. O TxR promoveu maior crescimento nos pacientes mais jovens e com maior déficit estatural no TxR.
R
ESUMOPalavras-chave: adolescente; crescimento, criança; índice de massa corporal; trans-Introduction: Chronic kidney disease in
children often determines poor nutritional status. Although renal transplantation (RTx) resolves endocrine and metabolic disorders, growth continues to be suboptimal and excessive weight gain may result in obesity. Objectives: Evaluating the development of height and body mass index in renal transplanted children and adolescents and identifying associated factors with final nutritional status.
Methods: We reviewed the medical records of 17 patients with regular follow-ups up to 24 months after RTx. Nutritional status was assessed by height-for-age (H/A) and body mass index-for-age (BMI/A). It was considered catch-up growth the increase in z-score H/A ≥ 0.5 standard deviation. Multiple linear regression was used to estimate the influence of factors clinical and demographic variables on anthropometric indicators at 24 months after RTx. Results: Mean age was 9.1 ± 4.1 years old. Twenty-four months after RTx the mean z-score H/A increased from -2.66 ± 1.66 to -1.93 ± 1.08 (p ≤ 0.05), 47.0% of the patients showed catch-up growth and the same proportion showed z-score H/A < -2. Mean z-score BMI/A increased from -0.48 ± 1.03 at RTx to 0.80 ± 0.94 at third month after RTx (p < 0.001) and remained unchanged up to 24 months. The frequency of weight excess increased from 5.9% at RTx to 41.2% at 24 months. Age (r = -0.66; p = 0.006) and z-score H/A (r = -0.72; p = 0.002) at RTx were inversely associated with growth. Conclusion: Twenty-four months after transplant it was verified inadequate growth to recovery from stunting and excessive weight gain. RTx promoted greater growth in the youngest patients and most stunted at RTx.
A
BSTRACTKeywords: adolescent; body mass in-dex; child; growth; kidney
I
NTRODUCTIONChildren with chronic kidney disease (CKD) commonly present nutritional problems and growth retardation. In spite of renal transplantation (RTx) being the best treatment to correct metabolic and endocrine abnormalities of kidney failure, the insufficient growth to reach adequate height and the excessive weight gain after RTx are frequent.1-8
Low height is determinant in the quality of life and self-esteem of people. For adults transplanted in childhood, the final height was directly associated to educational level, paid activity, marital life, and independent housing.9 Furthermore, Rosenkranz
et al.10 reported that one third of adults with CKD in childhood were dissatisfied with their height. Among the main reasons for the unsatisfactory growth after RTx are age at RTx, stunting pre-RTx, use of corticosteroids for maintaining immunosuppression, low graft functionality, and delayed puberty.3,4 On the other hand, the excessive weight gain after RTx, which is assigned mostly to the chronic use of corticosteroids5,6, may have harmful effect on the graft survival11 and contribute to the cardiovascular morbidity.12
Despite the importance of the physical development for children and adolescents, there are few reports about weight gain after pediatric RTx in Brazil and no reports about linear growth. Thus, the aim of the present study was twofold: to evaluate the development of height and body mass index of renal transplanted children and adolescents in Ribeirão Preto, Brazil, and to identify their associated factors.
M
ETHODSThis is a retrospective longitudinal study conducted through review of medical records of children and adolescents who were renal transplanted at Hospital das Clínicas da Faculdade de Medicina de Ribeirão Preto da Universidade de São Paulo (HCFMRP-USP), Brazil, and were in outpatient treatment in 2013.
The patients were selected according to the following inclusion criteria: be between 2 and 16 years old at RTx, have performed RTx for at least 24 months, have functioning graft up to 24 months after RTx, have both clinical and anthropometric data in the medical records, and have no other clinical conditions that alter body composition or nutritional status.
Out of a total of 19 patients who had their medical records reviewed, seventeen met the above criteria and were included in final sample. The research was approved by the Institutional Ethics Committee in Research under the protocol number 446.595, which allowed exemption of Informed Consent Form.
All patients were transplanted between 1997 and 2012. In the review of the medical records were collected the data registered on the day of RTx or up to two months earlier, and data registered during outpatient follow-up on 1, 3, 6, 12, 18, and 24 months after RTx.
Demographic (age at RTx and gender), clinical (primary renal disease, time on dialysis, type of donor, plasma creatinine level, prednisone dose, and medication prescribed after RTx) and anthropometric data (weight and height) were obtained. The nutritional status was assessed by z-score, from the anthropometric indicators height for age (H/A) and body mass index for age (BMI/A), according to World Health Organization reference population.13,14
In children with score-z H/A < -2, the BMI was expressed relative to height-age, that is, the age at which the child’s height would be on the 50th percentile.15 The increase in the z-score H/A ≥ 0.5 standard deviations between RTx and 24 months after RTx was considered catch-up growth.16 Glomerular filtration rate (GFR) was estimated by Schwartz formula.17 Steroids exposure was estimated by area under the curve (AUC) of prescribed prednisone dose (mg/Kg) as a function of the time (days), by the trapezoidal rule.5
All variables were checked for normality by Shapiro-Wilk test and by graph representation. Descriptive statistical procedures were used for data reporting (relative and absolute frequencies). Wilcoxon test was used to compare means before and after RTx. Simple linear regression analysis was used in order to select the variables under study (GFR, type of donor, age at RTx, z-score at RTx, AUC to prescribed prednisone dose and steroid pulse therapy to treat acute rejection episodes) to integrate the multiple model.
were carried out using SPSS version 20.0 (IBM SPSS Statistics, USA) with the significance level set at 0.05.
R
ESULTSThe sample characteristics for the demographic and clinical variables are described in Table 1. The sample was 17 patients with mean age 9.1 ± 4.1 years. There was only one patient with CKD stage 4 at RTx (GFR = 17.2 mL/min/1.73m2) and all other with kidney failure. Fifteen (88.2%) patients were on dialysis for 36.7 ± 18.0 months and only two (11.8%) patients were pre-emptively transplanted. The mean GFR on 6 and 24 months after RTx were 82.1 ± 28.7 and 85.3 ± 25.3 mL/min/1.73m2, respectively.
After RTx, all patients were using daily immunosuppressive medications. The mean prescribed prednisone dose was reduced from 0.76 mg/Kg/day (range: 0.23-1.72 mg/Kg/day; AUC: 30.8 ± 9.3 mg/Kg) in the first month to 0,35 mg/Kg/day (range: 0.13-0.88 mg/ Kg/day; AUC: 60.8 ± 23.1 mg/Kg) in the third month, and to 0.14 mg/Kg/day (range: 0.06-0.23 mg/Kg/day; AUC: 172.5 ± 52.6 mg/Kg) in the twenty-fourth month after RTx (p < 0.001). Two (11.8%) patients (12.4 and 13.8 years old) started using recombinant human growth hormone (rhGH) 18 months after RTx with a maximum increase of 0.15 z-score H/A after six months of its use.
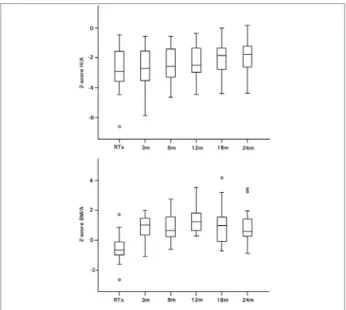
Development of anthropometric indicators H/A and BMI/A after RTx is shown in Figure 1. Growth retardation was evident at RTx since the mean z-score H/A was -2.66 ± 1.66 and 58.8% of the sample was smaller than z-score E/I -2. From twelve months after RTx, there was significant increase in mean z-score H/A (-2.23 ± 1.20 at 12 months, -2.03 ± 1.08 at 18 months and -1.93 ± 1.08 at 24 months after RTx, p ≤ 0.05). However, considering age at RTx the mean z-score H/A increased only in the group < 10 years old (-2.95 ± 1.84 at RTx and -1.72 ± 0.61 at 24 months after RTx, p < 0.05) if compared to group ≥ 10 years old (-2.34 ± 1.50 at RTX and -2.17 ± 1.46 at 24 months after RTx, p > 0.05) (Figure 2).
At 24 months after RTx, 76.5% (n = 13) of the sample exhibited some increase in z-score H/A and 47.0% (n = 8) exhibited catch-up growth. Among patients who exhibited catch-up growth, 62.5% (n = 5) were < 10 years old at RTx. Nevertheless, twenty four months after RTx 47.0% (n = 8) of the sample remained below z-score H/A -2.
Regarding the BMI/A at RTx, the sample showed negative mean z-score (-0.48 ± 1.3), however, the age- and sex- BMI cutoffs identified only one (5.9%) patient
Figure 1. Development of the score-z height for age and score-z body mass index for age after renal transplantation. Wilcoxon’s test showed difference in the score-z H/A between RTx and 12, 18, and 24 months after RTx (p < 0.05), and in the score-z BMI/A between RTx and all other times after RTx (p < 0.001). RTx=renal transplantation; H/A=height for age; BMI/A=body mass index for age; m=months after RTx.
Figure 2. Development of the score-z height for age after renal transplantation. Wilcoxon’s test showed difference in the score-z height for age between RTx and other times after RTx in the age group <10 years old (p < 0.05). There was no difference between RTx and other times after RTx in the age group =10 years old (p > 0.05). RTx=renal transplantation; H/A=height for age; m=months after RTx.
as underweight (z-score < -2); fifteen (82.4%) patients were identified as eutrophic (z-score ≥ -2 and < 1) and one (5.9%) as overweight (z-score ≥ 1 and ≤ 2). The mean z-score BMI/A was higher from the third month after RTx (0.80 ± 0.94, p < 0.001) and remained stable up to 24 months (0.94 ± 1.16, p < 0.05) when 29.4% (n = 5) of patients were overweight and 11.8% (n = 2) were obese (z-score > 2).
TABLE 1 DEMOGRAPHICANDCLINICALCHARACTERISTICSOFRENALTRANSPLANTEDCHILDRENANDADOLESCENTSIN
RIBEIRÃOPRETO, BRAZIL
n (%)
Male gender 14 (82.3)
Age at RTx
< 10 years old 9 (52.9)
≥ 10 years old 8 (47.1)
Race/ethnicity
White 12 (70.6)
Black/non-Caucasian 5 (29.4) Primary renal disease
Congenital 14 (82.4)
Acquired 3 (17.6)
Dialytic therapy pre-RTx
Peritoneal dialysis 12 (70.6)
Hemodialysis 1 (5.9)
Peritoneal dialysis + hemodialysis 2 (11.8) Preemptive transplant 2 (11.8)
Deceased donor 11 (64.7)
Steroids pulse therapy
Yes 6 (35.3)
No 11 (64.7)
Calcineurin inhibitor (1; 6; 24 months post-RTx)
Tacrolimus 11 (64.7); 12 (70.5); 13 (76.5) Cyclosporine 6 (35.3); 5 (29.5); 4 (23.5) Immunosuppressive drug (1; 6; 24 months post-RTx)
Azathioprine 5 (29.4); 4 (23.5); 2 (11.8) Mycophenolate Mofetil 12 (70.6); 13 (76.5); 15 (88.2) GFR (6; 24 months post-RTx)
≥ 90 mL/min/1.73m2 5 (29.4); 8 (47.1)
60 to 89 mL/min/1.73m2 8 (47.1); 7 (41.2)
45 to 59 mL/min/1.73m2 3 (17.6); 1 (5.9)
30 to 44 mL/min/1.73m2 1 (5.9); 1 (5.9) RTx: renal transplantation; GFR: glomerular filtration rate.
In the simple linear regression analysis, moderate to strong partial correlations were found between Δ z-score H/A after 24 months of RTx and age at RTx (r = -0.714, p = 0.001), z-score H/A at RTx (r = -0.764,
p < 0.001), and AUC of prescribed prednisone dose up to 24 months after RTx (r = 0.598, p = 0.011). However, after inclusion of variables in the multiple linear regression model, only age at RTx and z-score H/A at RTx continued to show effect on Δ z-score H/A 24 months after RTx (Table 2). Associations between
Δ z-score BMI/A at 24 months after RTx and studied variables was not observed in the sample.
D
ISCUSSIONTABLE 2 SIMPLEANDMULTIPLELINEARREGRESSIONMODELSPREDICTINGTHEVARIATIONOFZ-SCOREHEIGHT-FOR-AGEOF
CHILDRENANDADOLESCENTSAT 24 MONTHSAFTERRENALTRANSPLANTATIONINRIBEIRÃOPRETO, BRAZIL
Simple linear regression analysis Estimate CI 95% r partial p R2
Constant 2.50 1.46 ; 3.55 < 0.001 0.51 Age at RTx
(years) -0.19 -0.30 ; -0.09 -0.714 0.001
Constant -0.63 -1.37 ; 0.11 0.089 0.58 H/A at RTx
(z-score) -0.51 -0.75 ; -0.27 -0.764 < 0.001
Multiple linear regression analysis
Estimate CI 95% r partial p R2 T VIF
Constant 0.90 -0.26 ; 2.06 0.119 0.76 0.81 1.23 Age at RTx
(years) -0.13 -0.21 ; -0.04 -0.658 0.006 H/A at RTx
(z-score) -0.38 -0.58 ; -0.17 -0.720 0.002
H/A: height-for-age; RTx: renal transplantation; T: tolerance; VIF: variance inflation factor.
The z-score H/A at RTx was similar to several studies that evaluated transplanted children, mostly in the 1980s and 1990s.2,8,18 Nevertheless, recent studies found better results. Franke et al.19 reported as -1.74 the mean score-z H/A at RTx of German children transplanted between 1998 and 2009. According to the data published by The North American Pediatric Renal Trials and Collaborative Studies (NAPRTCS), from sample of approximately ten thousand American children and adolescents transplanted between 1987 and 2010, the mean score-z H/A at RTX was -1.75. This value has improved over the years, and if considered the transplants performed in 2009, the mean value was -1.23.20
In our sample, 88.2% of patients were transplanted after 2005. Preemptive transplantation, shorter total dialysis time and use of rhGH were identified as predictive factors for a better height at RTx.2,21 The height at RTx, in turn, was directly associated with final height.2,22
Twenty-four months after RTx the mean score-z H/A increased, approximately 75% of the sample showed a positive variation in the z-score H/A, and 47% showed catch-up growth. These changes are consistent with the literature, however, insufficient for many children reach the adequate height.1,2
Patients who were more stunted at RTx presented the greatest increase in th score-z H/A, and this situation is often reported.2,4,22,23 Since the stunting and bone age are directly related,22 it is probable that such patients have the best growth potential and, thus, they have the best growth velocity.
The age at RTx was also a growth predictor
showed that children transplanted up to five years old exhibited substantial acceleration of growth velocity up to three or four years after RTx, while recipients from 6 to 12 years old exhibited limited improvement or decline in height, and recipients over 12 years old exhibited a minimal decline in z-score H/A.4 However, some studies have shown that a growth improvement in older prepubertal recipients is possible.3,23
This could be explained by the occurrence of the prepubertal growth spurt after RTx. In contrast to the prepubertal recipients, children transplanted during or after the puberty, besides not having prepubertal growth spurt, have a short pubertal growth spurt due to its late start. Thus, there is a continuous decline in the growth velocity during puberty.3 In our sample, some children over 10 years old exhibited catch-up growth, however, most of them exhibited minimum or negative variation of score-z H/A.
Although younger children exhibit accelerated growth in the first years after RTx, it is important to mention that occurs a fall in growth velocity later.1,4 Jung et al.2 reported that children under 10 years old exhibited improvement in score-z H/A up to two years after RTx, whereas Vester et al.8, with a sample non-stratified by age, reported this improvement only up to one year after RTx. The inability to sustain a normal or accelerated growth velocity until adulthood often determines low final height2,3 and has been identified as a consequence of the decreased graft functionality and of the chronic use of corticosteroids.21
study, there was no association between growth and GFR after RTx. This result can be attributed to the maintenance of glomerular function above 60 mL/ min/1.73m2 in 88.2% (n = 15) of patients. The two remaining patients presented moderately decreased renal function (GFR between 30 and 59 mL/ min/1.73m2).
In contrast to previous studies in which the corticosteroid dose is one of the main predictors of growth after RTx, in the multiple analysis this association was not confirmed. However, the use of prednisone on alternate days, the early suspension or the medication absence have resulted in better growth compared to daily use.16,25,26 All patients in this study were treated with similar immunosuppressive regimen that consisted of daily doses of prednisone.
Furthermore, the dose variation (mg/kg) in each moment after RTx was small. Data from NAPRTCS, 1996, showed the mean change in the standardized height scores from 1 month to 24 months after transplantation was significantly greater in transplanted patients under 13 years on alternative day (+0.5 +/- 0.06) than in those on daily dosing prednisone (+0.1 +/- 0.03).26 Therefore, despite the absence of orrelation between growth and prednisone dose in this study, the depressive effect of corticosteroids on growth cannot be excluded
In the studied sample only two patients used rhGH, starting from 18 months after RTx, and no important change in score-z H/A was observed in the following six months until completing the study. The effectiveness of rhGH for renal transplanted children has been confirmed after one year into treatment. However, its safety about the induction of graft rejection is still uncertain.27 In Brazil, rhGH this medication is not available free of charge for renal transplanted patients and its high cost and the need for long-term use are among the main reasons for non-use by most children.
This study also evaluated the BMI/A at RTx and its development up to 24 months after RTx. The frequency of overweight at RTx (5.9%) was lower than that reported by another Brazilian study (9.1%).5 International studies presented frequency of obesity at RTx between 9.7% e 13,0%, without considering the cases of overweight.7,11,28
However, such as reported by a British study, the frequency of excessive weight after RTx in our sample was higher than the national average.29 The increase in the score-z BMI/A occurred in the first months
after RTx did not return to baseline up to 24 months and has been a common event in renal transplanted children.6,8 Approximately 65% of the patients exhibited an increase of more than one standard deviation in the score-z BMI/A, and this change in childhood was associated with risk of coronary disease 5% to 15% higher in adulthood.12
In our sample there was no association of Δ score-z BMI/A and the studied variables (age at RTx, BMI/A at RTx, AUC to prescribed prednisone dose and steroid pulse therapy), whereas in the literature the predictors of weight gain after RTx are quite controversial.5-8 Similar to the growth, the small variation of the prednisone dose among patients may have affected the detection of its effect on weight gain. Furthermore, we believe that social, genetic and dietary factors may also be related to weight gain in the studied sample. A high maternal BMI, for example, has been suggested as a risk factor for weight gain in transplanted children.8 In adults, the adherence to a healthier diet was associated with less weight gain after RTx.30 However these external factors to the RTx were not evaluated in this study and remain speculative.
This study has some limitations related to its retrospective design. Data from bone age, pubertal stage, socioeconomic and dietary factors are lacking and the sample size prevented analysis using age subgroups. However, our findings are similar to those found in other large studies.
C
ONCLUSIONRTx promote better growth in younger and more stunted children. Nonetheless, almost half of the patients had low H/A at 24 months after RTx. This situation is particularly worrying because the probable worsening of renal function over the years must slow down the growth velocity and may induce greater proportion of low final height. Furthermore, there was important increase in the number of overweight patients and the first three months after RTx proved to be a critical period for weight gain.
R
EFERENCES1. Ninik A, McTaggart SJ, Gulati S, Powell HR, Jones CL, Walker RG. Factors influencing growth and final height after renal transplantation. Pediatr Transplant 2002;6:219-23. DOI: http://dx.doi.org/10.1034/j.1399-3046.2002.01084.x
2. Jung HW, Kim HY, Lee YA, Kang HG, Shin CH, Ha IS, et al. Factors affecting growth and final adult height after pediatric renal transplantation. Transplant Proc 2013;45:108-14. DOI: http://dx.doi.org/10.1016/j.transproceed.2012.07.146
3. Nissel R, Brázda I, Feneberg R, Wigger M, Greiner C, Querfeld U, et al. Effect of renal transplantation in childhood on longitudinal growth and adult height. Kidney Int 2004;66:792-800. PMID: 15253735 DOI: http://dx.doi.org/10.1111/j.1523-1755.2004.00805.x
4. Fine RN, Martz K, Stablein D. What have 20 years of data from the North American Pediatric Renal Transplant Cooperative Study taught us about growth following renal transplantation in infants, children, and adolescents with end-stage renal disease? Pediatr Nephrol 2010;25:739-46.
5. Boschetti SB, Nogueira PC, Pereira AM, Fisberg M, Pestana JO. Prevalence, risk factors, and consequences of overweight in children and adolescents who underwent renal transplantation-short- and medium-term analysis. Pediatr Transplant 2013;17:41-7. DOI: http://dx.doi.org/10.1111/petr.12020 6. Foster BJ, Martz K, Gowrishankar M, Stablein D, Al-Uzri A.
Weight and height changes and factors associated with greater weight and height gains after pediatric renal transplantation: a NAPRTCS study. Transplantation 2010;89:1103-12. PMID: 20168276 DOI: http://dx.doi.org/10.1097/TP.0b013e3181d3c9be 7. Plumb LA, Pitcher D, Tse Y, Shield JP, Inward C, Sinha MD;
British Association for Paediatric Nephrology. Longitudinal changes in body mass index following renal transplantation in UK children. Nephrol Dial Transplant 2014;29:196-203. DOI: http://dx.doi.org/10.1093/ndt/gft395
8. Vester U, Schaefer A, Kranz B, Wingen AM, Nadalin S, Paul A, et al. Development of growth and body mass index after pediatric renal transplantation. Pediatr Transplant 2005;9:445-9. DOI: http://dx.doi.org/10.1111/j.1399-3046.2005.00304.x 9. Broyer M, Le Bihan C, Charbit M, Guest G, Tête MJ,
Gagnadoux MF, et al. Long-term social outcome of children after kidney transplantation. Transplantation 2004;77:1033-7. DOI: http://dx.doi.org/10.1097/01.TP.0000120947.75697.8B 10. Rosenkranz J, Reichwald-Klugger E, Oh J, Turzer M, Mehls
O, Schaefer F. Psychosocial rehabilitation and satisfaction with life in adults with childhood-onset of end-stage renal disease. Pediatr Nephrol 2005;20:1288-94. DOI: http://dx.doi. org/10.1007/s00467-005-1952-3
11. Mitsnefes MM, Khoury P, McEnery PT. Body mass index and allograft function in pediatric renal transplantation. Pediatr Nephrol 2002;17:535-9 DOI:http://dx.doi.org/10.1007/ s00467-002-0863-9
12. Baker JL, Olsen LW, Sørensen TIA. Childhood body-mass index and the risk of coronary heart disease in adulthood. N Engl J Med 2007;357:2329-37. DOI: http://dx.doi.org/10.1056/ NEJMoa072515
13. de Onis M, Onyango AW, Borghi E, Siyam A, Nishida C, Siekmann J. Development of a WHO growth reference for school-aged children and adolescents. Bull World Health Organ 2007;85:660-7. DOI: http://dx.doi.org/10.2471/ BLT.07.043497
14. World Health Organization. Training course on child growth assessment. WHO Child Growth Standards. Module C: interpreting growth indicators. Geneva: World Health Organization; 2008.
15. KDOQI Work Group. KDOQI Clinical Practice Guideline for Nutrition in Children with CKD: 2008 update. Executive summary. Am J Kidney Dis 2009;53:S11-104.
16. Ellis D. Growth and renal function after steroid-free tacrolimus-based immunosuppression in children with renal transplants. Pediatr Nephrol 2000;14:689-94. DOI: http:// dx.doi.org/10.1007/s004670000335
17. Schwartz GJ, Haycock GB, Edelmann CM Jr, Spitzer A. A simple estimate of glomerular filtration rate in children derived from body length and plasma creatinine. Pediatrics 1976;58:259-63. PMID: 951142
18. Delucchi A, Ferrario M, Varela M, Cano F, Rodriguez E, Guerrero JL, et al. Pediatric renal transplantation: a single center experience over 14 years. Pediatr Transplant 2006;10:193-7. DOI: http://dx.doi.org/10.1111/j.1399-3046.2005.00423.x 19. Franke D, Thomas L, Steffens R, Pavičić L, Gellermann J, Froede
K, et al. Patterns of growth after kidney transplantation among children with ESRD. Clin J Am Soc Nephrol 2015;10:127-34. DOI: http://dx.doi.org/10.2215/CJN.02180314
20. North American Pediatric Renal Trials and Collaborative Studies. 2010 Annual Transplant Report. Boston: North American Pediatric Renal Trials and Collaborative Studies; 2010 [internet] [cited 2015 mar 08]. Available from: https:// web.emmes.com/study/ped/annlrept/2010_Report.pdf
21. Harambat J, Cochat P. Growth after renal transplantation. Pediatr Nephrol 2009;24:1297-306. DOI: http://dx.doi. org/10.1007/s00467-008-0787-0
22. Englund MS, Tydén G, Wikstad I, Berg UB. Growth impairment at renal transplantation-a determinant of growth and final height. Pediatr Transplant 2003;7:192-9. DOI: http://dx.doi. org/10.1034/j.1399-3046.2003.00068.x
23. Maxwell H, Haffner D, Rees L. Catch-up growth occurs after renal transplantation in children of pubertal age. J Pediatr 1998;133:435-40. DOI:http://dx.doi.org/10.1016/S0022-3476(98)70283-5
24. Fine RN, Ho M, Tejani A; North American Pediatric Renal Trasplant Cooperative Study (NAPRTCS). The contribution of renal transplantation to final adult height: a report of the North American Pediatric Renal Transplant Cooperative Study (NAPRTCS). Pediatr Nephrol 2001;16:951-6. DOI:http:// dx.doi.org/10.1007/s004670100002
25. Delucchi A, Valenzuela M, Lillo AM, Guerrero JL, Cano F, Azocar M, et al. Early steroid withdrawal in pediatric renal transplant: five years of follow-up. Pediatr Nephrol 2011;26:2235-44. DOI: http://dx.doi.org/10.1007/s00467-011-1934-6
26. Jabs K, Sullivan EK, Avner ED, Harmon WE. Alternate-day steroid dosing improves growth without adversely affecting graft survival or long-term graft function. A report of the North American Pediatric Renal Transplant Cooperative Study. Transplantation 1996;61:31-6. PMID: 8560569 DOI:http:// dx.doi.org/10.1097/00007890-199601150-00008
27. Wu Y, Cheng W, Yang XD, Xiang B. Growth hormone improves growth in pediatric renal transplant recipients - a systemic review and meta-analysis of randomized controlled trials. Pediatr Nephrol 2013;28:129-33. DOI: http://dx.doi. org/10.1007/s00467-012-2208-7
28. Hanevold CD, Ho PL, Talley L, Mitsnefes MM. Obesity and renal transplant outcome: a report of the North American Pediatric Renal Transplant Cooperative Study. Pediatrics 2005;115:352-6. PMID: 15687444 DOI: http://dx.doi. org/10.1542/peds.2004-0289
29. Brasil. Ministério do Planejamento, Orçamento e Gestão. Instituto Brasileiro de Geografia e Estatística - IBGE. Diretoria de Pesquisas Coordenação de Trabalho e Rendimento. Pesquisa de Orçamentos familiares 2008 - 2009. Antropometria e Estado Nutricional de Crianças, Adolescentes e Adultos no Brasil. Rio de Janeiro: IBGE; 2010.