Nutritional requirements of the critically ill patient
Necessidades nutricionais do doente crítico
INTRODUCTION
Critically ill patients comprise a non-homogeneous sample of individuals who, due to diferent acute conditions, require complex care and constant monitoring. herefore, these patients generally require hospitalization in an intensive care unit (ICU).(1)
he nutritional status of hospitalized patients has a signiicant impact on their clinical outcome.(2) According to Logan and Hildebrandt,(3) protein-energy malnutrition is a prevalent problem and afects 30 to 60% of hospitalized patients. Many of these patients lose weight during the hospitalization, and such phenomena have multifactorial origins (e.g., the severity of the illness and the lack of adequate nutritional support).(4)
Nuno André de Almeida Costa1, Aníbal Defensor Marinho2, Luciana Ribeiro Cançado3
1. Master’s Program in Medicine, Abel Salazar Institute of Biomedical Sciences, Universidade do Porto - UP - Porto, Portugal.
2. Intensive Care Unit 1, Centro Hospitalar do Porto - CHP - Porto, Portugal.
3. Graduate Course in Clinical Nutrition, School of Food and Nutritional Sciences, Universidade do Porto - UP - Porto, Portugal.
ABSTRACT
Objective: Given the inaccessibility of indirect calorimetry, intensive care units generally use predictive equations or recommendations that are established by international societies to determine energy expenditure. he aim of the present study was to compare the energy expenditure of critically ill patients, as determined using indirect calorimetry, to the values obtained using the Harris-Benedict equation.
Methods: A retrospective observational study was conducted at the Intensive Care Unit 1 of the Centro Hospitalar do Porto. he energy requirements of hospitalized critically ill patients as determined using indirect calorimetry were assessed between January 2003 and April 2012. he accuracy (± 10% diference between the measured and estimated values), the mean diferences and the limits of agreement were determined for the studied equations.
Results: Eighty-ive patients were assessed using 288 indirect calorimetry
measurements. he following energy requirement values were obtained for the diferent methods: 1,753.98±391.13 kcal/ day (24.48 ± 5.95 kcal/kg/day) for indirect calorimetry and 1,504.11 ± 266.99 kcal/day (20.72±2.43 kcal/kg/day) for the Harris-Benedict equation. he equation had a precision of 31.76% with a mean diference of -259.86 kcal/day and limits of agreement between -858.84 and 339.12 kcal/day. Sex (p=0.023), temperature (p=0.009) and body mass index (p<0.001) were found to signiicantly afect energy expenditure.
Conclusion: he Harris-Benedict equation is inaccurate and tends to underestimate energy expenditure. In addition, the Harris-Benedict equation is associated with signiicant diferences between the predicted and true energy expenditure at an individual level.
Keywords: Indirect calorimetry; Diet therapy; Nutritional therapy; Energy metabolism; Respiration, artificial; Intensive care units
This study was conducted at the Polyvalent Intensive Care Unit I, Centro Hospitalar do Porto - Porto, Portugal.
Conflicts of interest: None.
Submitted on June 8, 2012 Accepted on August 30, 2012
Corresponding author: Nuno André de Almeida Costa
Rua Loteamento do Castanhal, 341 - Brufe Zip Code: 4760-830 - Vila Nova de Famalicão - Portugal
his problem is even more prominent in critically ill patients given that they are in a state of clinical
hypermetabolism and hypercatabolism,(5,6) exhibit
hemodynamic instability and, occasionally, lack an available enteral route. hese states ultimately prevent early nutritional support. Moreover, the problem of nutritional support for these patients is aggravated by the fact that energy expenditure (EE) is conditioned by certain medical and pharmacological procedures, thus promoting a reduction in the metabolic response.(7)
In this scenario, which can easily lead to malnutrition, an estimation of EE is recommended, and this estimation should be as accurate as possible. he early institution of nutritional support (NS) is also recommended. Guidelines from diferent societies for enteral and parenteral nutrition recommend NS for all critically ill patients who have no prospect of ingesting a complete oral diet within the irst 3 days of admission to the ICU. Ideally, this NS should be initiated within the irst 24 to 48 hours following hospitalization.(8)
herefore, the accurate determination of EE in these patients is mandatory to guarantee that their energy requirements are met and to avoid the multiple deleterious consequences that are associated with hyperalimentation or caloric restriction.(9-14)
Many methods have been described to assess EE in critically ill patients; however, all these methods have limitations. Indirect calorimetry (IC) is a noninvasive method that determines energy requirements and substrate
utilization rates based on oxygen consumption (VO2)
and carbon dioxide production (VCO2). hese values are
obtained through the analysis of the inspired and expired air from the lungs.(15) his method is currently considered to be the gold standard for determining total EE(16) despite its well-known technical limitations, such as the requirement for trained personnel, the requirement for an inspired oxygen fraction that is lower than 0.6 and the high cost of the necessary equipment.(15)
In addition to the use of equations, other methods with easier applicability have been more commonly used to estimate EE to optimize nutritional support, including the clinical recommendations of the American Society for Parenteral and Enteral Nutrition (ASPEN) and the European Society for Clinical Nutrition and Metabolism
(ESPEN).(8) Over 200 equations have been documented
for predicting EE,(17) although the most widely examined and used in clinical practice(18) is the Harris-Benedict (HB) equation.(19) However, these predictive methods are often considered to be inaccurate,(6,20-22) and thus no method has gained universal acceptance.
he primary aim of the present study was to evaluate the EEs of critically ill patients as measured using IC, comparing these measurements (i) to values that were calculated using the HB predictive equation and (ii) to ESPEN’s recommendations for nutritional support. Moreover, an attempt was made to identify the parameters that could inluence energy intake.
METHODS
Study design
A retrospective observational analytical study was conducted at the Intensive Care Unit 1 of the Centro Hospitalar do Porto - CHP. All the critically ill patients with a minimum of 3 days of hospitalization, who were subjected to IC, whose anthropometric data were recorded and who were hospitalized between January 2003 and April 2012 were included in the study.
he exclusion criteria included the absence of data that would allow for the use of the HB equation for estimating EE (i.e., weight, height and age) and individuals who were younger than 18 years of age. IC measurements that revealed respiratory quotients (RQs) <0.6 or >1.25 or an inspired oxygen fraction >0.6 were considered to be
low-quality measurements and thus were excluded.(23) No
admitting diagnoses were excluded.
he study was approved by the CHP’s Health Ethics Committee, with no requirement for informed consent forms. he demographic data, the type of admission (e.g., neurosurgical pathology, medical, transplants, urgent surgery and scheduled surgery), the Sequential Organ Failure Assessment (SOFA) severity index, the albumin levels, the serum prealbumin levels, the C-reactive protein (CRP) levels, the total leucocyte count (TLC) and the 24-hour urea and creatinine clearance were recorded.
Weight and height data were obtained on admission by asking the patient or the closest family member (preadmission weight) or by consulting the patient’s recent primary care medical records. he patients’ body mass indices (BMIs) were grouped into ive classes based on the World Health Organization (WHO) classiication system:(24) <18.5 (malnutrition), 18.5 to 24.99 (eutrophia), 25 to 29.99 (overweight), 30 to 34.99 (class I obesity) and ≥35 (classes II and III obesity). Given that BMI alone does not relect the nutritional diagnosis of critically ill patients, the WHO’s deinitions were adapted to the following limits: <18.5 (underweight), 18.5 to 24.99 (normal weight), 25 to 29.99 (overweight), 30 to 34.99 (class I obesity) and ≥35 (classes II and III obesity).
IC. All the measurements were performed by a single individual from the institution. his individual had experience using the technique, thereby limiting operator-dependent errors. he data were collected from all the measurements that were made beginning on the second day of hospitalization onwards, respecting the criteria for inclusion in the study.
All the patients were continually assessed for a minimum of 25 minutes during mechanical ventilation while lying in bed in supine position. he patients made minimal movements and were maintained in a thermoneutral environment. Only one measurement was performed per day, and a speciic time was not established for this purpose.
he RQ, VO2 and VCO2 values, as well as catecholamine administration, the patient’s temperature and the presence or absence of sedation were recorded for each IC measurement.
he metabolic monitor DeltatractTM II (Datex-Ohmeda,
Finland) was used for the IC measurements. his device was calibrated (gas and pressure) prior to each measurement
according to the manufacturer’s recommendations.(25)
he EE values are given in kcal/day and kcal/kg/day. he measurements were obtained while maintaining continuous nutrition once NS was established.
he albumin levels, the leucocyte counts and the CRP and SOFA scores were also obtained for each patient on the day of the irst IC measurement. he prealbumin levels and the 24-hour urea and creatinine clearance were obtained on subsequent days as close as possible to the irst IC measurement.
he baseline EE (kcal/day) was calculated using the HB predictive equation for males [66.47 + (13.75 x weight) + (5.003 x height) - (6.775 x age)] and for females [655.09 + (9.563 x weight) + (1.85 x height) - (4.676 x age)], where weight was expressed in kilograms, height in centimeters and age in years. Stress/activity factors were not applied to the equation, as these factors are believed to introduce an empirical character to the estimates.
Statistical analysis
he Statistical Package for the Social Sciences (SPSS) program, version 17, was used for the analysis and treatment of statistical data; statistical signiicance was considered to be p<0.05 for all the tests. he results are given as the mean ± standard deviation (SD).
he mean IC readings for each patient were used for statistical comparisons with the values that were obtained using the HB equation. Pearson’s correlation coeicient was calculated to assess the relationship between the EEs that were obtained using the HB equation and those that were obtained using IC. he correlation measured the
strength and the direction of the relationship; this value (r) ranges from 0 (no correlation) to 1 (perfect correlation). (26) Bland & Altman’s method allows for the description of
the agreement between the two quantitative measurements that measure the same characteristic on the same scale.(27) his method was used to assess the agreement between the values that were obtained by the two methods. here is no probative value to describe the agreement, which is based on the concept that the diference between the two measurements is compared to the average of the two measurements. It is recommended that 95% of the data included is within ±1.96 SD of the mean diference(26) and that the bias is close to 0.
he degree of precision of the HB equation was calculated and expressed by the percentage of the results that fell within ±10% of the values that were obtained using IC. When the estimated values were outside this range,
they were considered to be inaccurate.(6) HB
equation-derived values that were <90% of the values that were measured using IC were classiied as caloric restriction, and values that were >110% of the IC values were classiied as hyperalimentation.
he mean diference of the EE that was obtained using the HB equation, and IC was also calculated for all the measurements and grouped according to BMI. he results were expressed as kcal/day and as 95% conidence intervals of the mean diference. he HB equation was considered to coincide with IC if this conidence interval included the value 0.
he relationships between the true EE per kilogram of body weight and the following parameters were assessed: sex, age, sedation, the administration of amines, patient temperature, type of admission and SOFA score.
Regression models were used to compare the continuous variables. Student’s t-test and an analysis of
variance (ANOVA) were used to compare the continuous and categorical variables and the dichotomous and polychotomous variables, respectively.
RESULTS
Figure 1 - Pearson’s correlation for energy expenditure as measured using indirect calorimetry and estimated using the Harris-Benedict equation.
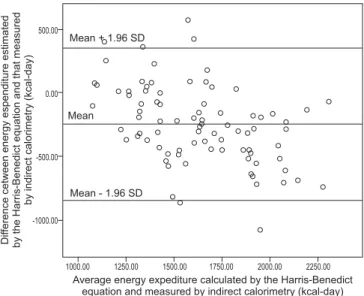
Figure 2 - Graph of the Bland-Altman method for comparing energy expenditure as measured using indirect calorimetry and estimated using the Harris-Benedict equation. SD - standard deviation.
he average RQ that was obtained for each IC measurement was 0.77±0.16. Of the total sample, 30.4% of the patients underwent therapy with catecholamines, 65.9% were under sedation and 34.8% had temperatures ≥38°C. With respect to the biochemical data, the following means were highlighted: CRP of 112.60±106.82 mg/L, SOFA score of 5.46±3.02, prealbumin levels of 141.83±72.05 mg/L, 24-hour urea clearance of 25.53±14.19 g per day and 24-24-hour creatinine clearance of 1,139.08±536.99 mg per day.
he examined patients had an average BMI of 25.84±5.13. his metric was distributed as follows: 5.9% (n=5) had a BMI < 18.5 (underweight), 38.8% (n=33) had a BMI between 18.5 and 24.99 (normal weight), 36.5% (n=31) had a BMI between 25 and 29.99 (overweight), 15.3% (n=13) had a BMI between 30 and 34.99 (class I obesity) and 3.5% (n=3) had a BMI ≥ 35 (classes II and III obesity).
Two hundred and eighty-eight measurements were made using IC, with an average of 3.38±2.18 measurements per patient and a mean duration of 12.12±9.43 hours. he mean EE was 1,753.98±391.13 kcal/day.
he mean EE obtained by the HB equation was 1,504.11±266.99 kcal/day. With respect to the daily kcal per kilogram of body weight, the average IC-determined value was 24.48±5.95 and the HB estimated a value of 20.72±2.43, as opposed to the 25-kcal daily recommendation that is made by ESPEN (2009).(8) herefore, the HB equation indicated an EE that corresponded to an average of 85.75% of that measured using IC. he HB equation predicted adequate energy supply in only 31.8% of the patients (n=58). he HB equation predicted caloric restriction (predicted value <90% of measured
value) in 60% (n=27) of the patients and hyperalimentation (value >110%) in 8.24% (n=7) of the patients.
Pearson’s correlation coeicient revealed a signiicant (p<0.001; n=85) but moderate(26) (r=0.627) correlation between the EE that was obtained by the HB equation and the EE that measured using IC (Figure 1).
Figure 2 shows the representation of the Bland–Altman method. It should be noted that 6/85 (7.06%) points are beyond the ± 1.96 SD cutofs. he mean diference between the two methods was -259.86±305.60 kcal/day and the limits of agreement ranged from -858.84 (mean -1.96 SD) to 339.12 (mean +1.96 SD).
he HB equation did not coincide with IC values when considering the total measurements (95% conidence interval: -315.78 to -183.95) but only coincided in the patients with class II or III obesity (Table 1). he HB equation underestimated the true EE for the majority of the measurements and for all BMI classes. he mean diference was higher for normal-weight individuals (-356.08 kcal/ day) and lower for patients with class II or III obesity (-78.03 kcal per day). he accuracy of the equation was observed to be lower in patients with low body weights (20%) and increased in patients with class II or III obesity (66.67%). he mean correction factor of the HB equation to IC (i.e., the value that should be multiplied by the HB-derived value to predict the IC-HB-derived value) was 1.17.
he statistical relationships between the diferent variables and EE were sought. It was noted that the EE was signiicantly greater in males (p=0.023), with mean values of 24.66±6.38
Table 1 - The comparison between the Harris-Benedict equation and indirect calorimetry for total measurements, stratified according to body mass index
Accuracy* (%)
Correction factor **
Limits of agreement (kcal/day)
Difference between the values that were obtained by the HB equation and IC Mean (kcal/day) 95% CI
Total measurements 31.76 1.17 -858.84 to 339.12 -259.86 -315.78 to -183.95
Underweight 20.00 1.27 -621.43 to -46.79 -334.11 -516.13 to -152.09
Normal weight 30.30 1.25 -915.86 to 203.70 -356.08 -457.35 to -254.81
Overweight 32.26 1.10 -781.93 to 467.07 -157.43 -274.30 to -40.56
Class I obesity 30.77 1.12 -842.93 to 427.15 -207.89 -403.69 to -12.11
Classes II and III obesity 66.67 1.04 -416.35 to 260.29 -78.03 -506.83 to 350.76***
HB - Harris–Benedict equation; IC - indirect calorimetry; 95% CI - 95% confidence interval. * The percentage of cases in which the value that was estimated by the Harris–Benedict equation was within a ± 10% interval of the value that was measured using IC; ** the factor that should be multiplied by the baseline energy expenditure, using the Harris–Benedict equation, to obtain the total energy expenditure as measured using IC (considering BMI only). *** Includes the 0 value.
Figure 3 - An error graph representing the 95% confidence intervals of the mean energy expenditure, per kilogram of body weight, as measured using indirect calorimetry for each of the established body mass index classes.
BMI - body mass index.
Figure 4 - A graph depicting the 95% confidence intervals for the mean energy expenditure values (given as kilograms of body weight) for the different types of admission.
Table 2 - Type of admission according to body mass index class
BMI Type of admission
Neurosurgical (%)
Medical (%)
Transplants (%)
Urgent surgery (%)
Scheduled surgery (%)
Underweight 60 20 0 20 0
Normal weight 51.5 9.1 18.2 12.1 9.1
Overweight 45.2 16.1 0 22.6 16.1
Class I obesity 53.8 30.8 0 7.7 7.7
Classes II and III obesity 66.7 33.3 0 0 0
BMI - body mass index.
Individuals with body temperature ≥38ºC had a signiicantly greater EE (26.29±7.23 kcal/kg/day; p=0.009) when compared to those with lower body temperature (23.68±6.69 kcal/kg/day). Reduced energy requirements were observed (ANOVA, p<0.001) in classes with higher BMIs, with the true EEs ranging from 30.54±9.31 kcal/kg/day for individuals with BMI <18.5 to 16.72±1.86 kcal/kg/day for individuals with BMI ≥35 (Figure 3). No signiicant diferences were detected in EE with the administration of amines (p=0.167) or sedation (p=0.328), nor were diferences observed with respect to the
SOFA severity index (p=0.778). Moreover, we noted a decrease in EE with age (linear regression, p<0.001, r=0.371).
DISCUSSION
he HB equation was observed to be inaccurate (31.76% accuracy), biased and to have wide limits of agreement, ranging from -858.84 to 339.12 kcal/day. According to Frankenield et al.,(28) accuracy values < 50% do not appear to be adequate from a clinical perspective. herefore, the practical usefulness of the HB equation is limited. Our results indicate inadequately estimated nutritional support in 68.24% of the patients, which is consistent with the literature. Kross et al.(20) observed an inaccuracy rate of 68.7% (inadequate nutrition) when using the HB equation in 927 critically ill patients. Pirat et al.(6) reported that this equation resulted in a 58% rate of inadequate nutrition (29% for both caloric restriction and hyperalimentation) in 34 critically ill patients with cancer. Boullata et al.(22) observed a 57% rate of inefective predictions in 395 patients.
he present study demonstrated a signiicant correlation of only 62.7% between the EE that was obtained by the HB equation (1,504.11 kcal/day) and the value that was measured using IC (1,753.98 kcal/day; p<0.001). herefore, this equation induces caloric restriction (the equation predicted, on average, only 85.75% of the nutritional support required). he methods exhibited a mean diference of -259.86 kcal/day, corresponding to a consistent and relatively better predictive power for this equation than has been assigned by several past studies. For
example Frankenield et al.(28) reported mean diferences
that ranged from -250 to -900 kcal/day; however, Kross et al. observed much lower mean diferences, at -150 kcal/
day(20) Although we did not initially deine unacceptable
diferences, as did Boullata et al.,(22) we considered that errors >250 kcal/day are not clinically acceptable, can induce states of caloric restriction or hyperalimentation and have deleterious consequences. Considering the average daily underestimation of 259.86 kcal and the mean hospital stay of 13.42 days, the cumulative bias would be approximately -3,487 kcal, emphasizing the inaccuracy of the estimation.
Unlike what was shown by Kross et al.,(20) the
underestimation of the HB equation that was observed in the present study did not appear more pronounced in obese individuals. In contrast, the mean diference appeared smaller for these individuals (-207 kcal/day for class I obesity and -78.03 kcal/day for patients with classes
II and III obesity versus -249.86 kcal/day for
normal-weight individuals). However, this diference between the studies may have been due to the small number of obese individuals that were included in the present study (18.8%), whereas 43.3% of the sample was obese in by Kross et al.(20) Nevertheless, these results are consistent with
Reid’s study(18) and suggest that the HB equation (with no correction factors) is a good predictor of EE in individuals with BMI ≥ 35 (100% accuracy).
he presence of a correlation between the HB equation and IC is consistent with the results that were reported by Boullata et al.;(22) however, once again, this correlation was not relected in the accuracy of the equation or in the lack of acceptable diferences, which are more clinically useful than the strength of correlation. In summary, the present study corroborates several results that have been previously published in the literature that indicate (i) the inefectiveness of predictive equations(20,22,28,29) and (ii) that the HB equation tends to underestimate the true nutritional requirements.(20,30) However, the results of other authors indicate that the HB equation in an acceptable substitute for IC.(31,32)
he latest ESPEN guidelines(8) recommend that, in the
absence of IC, the critically ill patient should receive 25 kcal/kg per day and that this value should reached over 2 to 3 days after the beginning of NS. By verifying the average energy requirements of 24.48 kcal/kg/day, our results indicated that overall, the value that is recommended by the European society is suitable for the overall requirement of patients in this ICU, although a slight hyperalimentation may occur, particularly in obese individuals. his result is
even more relevant given the recent recommendations(33)
that suggest the adoption of a hypocaloric (11 to 14 kcal/ kg per day of current weight) and a high protein diet for obese patients who have no contraindications. Stucky et al.(34) even recommend the use of hypocaloric diets for all patients who are admitted to the ICU.
Long et al.(35) introduced the use of activity/stress factors as correction values to the estimates that are made by the HB equation. hese factors were introduced for speciic metabolic conditions of critically ill patients, ranging from 0.7 if the patient is hungry to 2.1 if the patient is a burn victim. hese factors are now considered to be unreliable in practical terms(28) given that several parameters, some of which are undetermined, contribute to the total EE and vary according to the universality of these parameters in an ICU. We therefore only present the correction value of HB to IC (i.e., 1.17), as we believe that without a concrete understanding of all of the variables that justify a correction value, it is only possible to determine such a factor retrospectively and to provide only a description of the overall state of metabolic stress.
REFERENCES
1. Moreno R, Vincent JL, Matos R, Mendonça A, Cantraine F, Thijs L, et al. The use of maximum SOFA score to quantify organ dysfunction/failure in intensive care. Results of a prospective, multicentre study. Working Group on Sepsis related Problems of the ESICM. Intensive Care Med. 1999;25(7):686-96. 2. Fontoura CS, Cruz DO, Londero LG, Vieira RM. Avaliação nutricional de
paciente crítico. Rev Bras Ter Intensiva. 2006;18(3):298-306.
3. Hildebrant LA, Logan S. The use of prealbumin to enhance nutrition-intervention screening and monitoring of the malnourished patient. Nutr Today. 2003;38(4):134-8.
4. McWhirter JP, Pennington CR. Incidence and recognition of malnutrition in hospital. BMJ. 1994;308(6934):945-8.
5. Villet S, Chiolero RL, Bollmann MD, Revelly JP, Cayeux R N MC, Delarue J, et al. Negative impact of hypocaloric feeding and energy balance on clinical outcome in ICU patients. Clin Nutr. 2005;24(4):502-9.
6. Pirat A, Tucker AM, Taylor KA, Jinnah R, Finch CG, Canada TD, et al. Comparison of measured versus predicted energy requirements in criticcally ill cancer patients. Respir Care. 2009;54(4):487-94.
7. Amirkalali B, Hosseini S, Heshmat R, Larijani B. Comparison of Harris-Benedict and Mifflin-ST Jeor equations with indirect calorimetry in evaluating resting energy expenditure. Indian J Med Sci. 2008;62(7):283-90.
8. Singer P, Berger MM, Van den Berghe G, Biolo G, Calder P, Forbes A, Griffiths R, Kreyman G, Leverve X, Pichard C, ESPEN.ESPEN Guidelines on Parenteral Nutrition: intensive care. Clin Nutr. 2009;28(4):387-400. 9. Hill AG, Hill GL. Metabolic response to severe injury. Brit J Surg.
1998;85(7):884-90.
10. Rubinson L, Diette GB, Song X, Brower RG, Krishnan JA. Low caloric intake is associated with nosocomial bloodstream infections in patients in the medical intensive care unit. Crit Care Med. 2004;32(2):350-7.
11. Klein S, Kinney J, Jeejeebhoy K, Alpers D, Hellerstein M, Murray M, et al. Nutrition support in clinical practice: review of published data
vasoactive amines increase the EE,(36) this association was not observed in the present study. However, no sedation scale was used to quantify the level of sedation in these patients.
Furthermore, the present study demonstrated no relationship between the true EE and the disease severity as assessed using the SOFA score. However, the true EE was signiicantly greater in individuals with body temperature ≥38ºC. hese indings support the conclusions that were made by Bruder et al.,(37) where body temperature was the greatest determinant of EE in sedated subjects.
We must not neglect to mention the study’s limitations, including the fact that the study was retrospective and was conducted on a nonrandom sample of patients. hus, our conclusions may not be generalizable to all critically ill patients. Another limitation is the fact that only the necessary energy requirements were considered and not those that were efectively administered; therefore, a considerable discrepancy is possible.(38)
Given that IC is recognized as a reference method for measuring EE in critically ill patients under mechanical ventilation, its accompanying limitations have encouraged the use of equations, such as the HB equation, and recommendations from nutrition societies. hese methods are among the more commonly used techniques to estimate the EE in clinical practice. Despite the limitations of these methods, our results conirm the requirement to develop or improve the most commonly used methods for predicting EE and to support the maintenance of IC as the most reliable method for its determination.
CONCLUSION
he HB equation is inaccurate and tends to underestimate EE, resulting in signiicant diferences between the predicted and true EEs at an individual level.
RESUMO
Objetivo: As unidades de terapia intensiva recorrem às equações preditivas, para determinar o gasto energético, ou às recomendações estabelecidas por sociedades internacio-nais, devido à inacessibilidade da calorimetria indireta. O objetivo deste trabalho foi comparar o gasto energético de pacientes críticos, por calorimetria indireta, aos calculados por meio da equação de Harris-Benedict.
Métodos: Estudo retrospectivo observacional realizado no Serviço de Cuidados Intensivos 1 do Centro Hospitalar do Porto. Foram avaliadas as necessidades energéticas, des-de janeiro des-de 2003 até abril des-de 2012, dos pacientes críticos internados em que foi realizada calorimetria indireta. Pro-cedeu-se ao cálculo da precisão (intervalo de ±10% entre os valores medidos e estimados), da diferença média e dos limites de concordância e da equação estudada.
Resultados: Foram avaliados 85 pacientes, em que se efetuaram 288 medições por calorimetria indireta. Valores obtidos para necessidades energéticas em diferentes mé-todos: calorimetria indireta 1.753,98±391,13 kcal ao dia (24,48±5,95 kcal/kg ao dia), equação de Harris-Benedict 1.504,11±266,99 kcal ao dia (20,72±2,43 kcal/kg ao dia). A precisão da equação foi de 31,76%, a diferença média de -259,86 kcal ao dia, com limites de concordância entre -858,84 a 339,12 kcal ao dia. O gênero (p=0,023), a tem-peratura (p=0,009) e o índice de massa corporal (p<0,001) revelaram-se fatores com impacto significativo no gasto energético.
Conclusão: A equação de Harris-Benedict não é preci-sa na determinação do gasto energético, subestimando-o e apresentando diferenças significativas para predizer, a nível individual, o gasto energético real.
and recommendations for future research directions. Summary of a conference sponsored by the National Institutes of Health, American Society for Parenteral and Enteral Nutrition, and American Society for Clinical Nutrition. Am J Clin Nutr. 1997;66(3):683-706.
12. Doekel RC Jr, Zwillich CW, Scoggin CH, Kryger M, Weil JV. Clinical semi starvation: depression of hypoxic ventilatory response. N Engl J Med. 1976;295(7):358-61.
13. Good RA, Lorenz E. Influence of energy levels and trace metals on health and life span. JPEN J Parenter Enteral Nutr. 1990;14(5 Suppl):230S-6. 14. Mechanik JI, Brett EM. Nutrition and the chronically critically ill patient.
Curr Opin Clin Nutr Metab Care. 2005;8(1):33-9. Review.
15. Basile Filho A, Martins MA, Antoniazzi P, Marchini JS. A calorimetria indireta no paciente em estado crítico. Rev Bras Ter Intensiva. 2003;15(1):29-33. 16. MacDonald A, Hildebrandt L. Comparison of formulaic equations to
determine energy expenditure in the critically ill patient. Nutrition. 2003;19(3):233-9.
17. Ireton-Jones CS, Jones JD. Should predictive equations or indirect calorimetry be used to design nutrition support regimens? Nutr Clin Pract. 1998;13(3):141-3.
18. Reid CL. Poor agreement between continuous measurements of energy expenditure and routinely used prediction equations in intensive care unit patients. Clin Nutr. 2007;26(5):649-57.
19. Harris JA, Benedict FG. A biometric study of basal metabolism in man. Washington: Carnegie Institution of Washington; 1919.
20. Kross EK, Sena M, Schmidt K, Stapleton RD. A comparison of preditive equations of energy expenditure and measured energy expenditure in critically ill patients. J Crit Care. 2012;27(3):321.e5-12.
21. Hoffer LJ. Protein and energy provision in critical illness. Am J Clin Nutr. 2003;78(5):906-11.
22. Boullata J, Williams J, Cottrell F, Hudson L, Compher C. Accurate determination of energy needs in hospitalized patients. J Am Diet Assoc. 2007;107(3):393-401.
23. da Rocha EE, Alves VG, da Fonseca RB. Indirect calorimetry: methodology, instruments and clinical application. Curr Opin Clin Nutr Metab Care. 2006;9(3):247-56. Review.
24. Obesity: preventing and managing the global epidemic. Report of a WHO consultation. World Health Organ Tech Rep Ser. 2000;894:i-xii, 1-253. 25. Deltatrac II MBM-200 Metabolic Monitor Operator’s Manual. Datex. 1994. 26. Chan YH. Biostatistics 104: correlational analysis. Singapore Med J.
2003;44(12):614-9.
27. Bland JM, Altman DG. Statistical methods for assessing agreement between two methods of clinical measurements. Lancet. 1986;1(8476):307-10. 28. Frankenfield D, Hise M, Malone A, Russell M, Gradwell E, Compher C;
Evidence Analysis Working Group. Prediction of resting metabolic rate in critically ill adult patients: results of a systematic review of the evidence. J Am Diet Assoc. 2007;107(9):1552-61.
29. Xiao GZ, Su L, Duan PK, Wang QX, Huang H. [Comparison of measuring energy expenditure with indirect calorimetry and traditional estimation of energy expenditure in patients in intensive care unit]. Zhongguo Wei Zhong Bing Ji Jiu Yi Xue. 2011; 23(7):392-5. Chinese
30. Lev S, Cohen J, Singer P. Indirect calorimetry measurements in the ventilated critically ill patient: facts and controversies – the heat is on. Crit Care Clin. 2010;26(4)e1-9.
31. Alexander E, Susla GM, Burstein AH, Brown DT, Ognibene FP. Retrospective evaluation of commonly used equations to predict energy expenditure in mechanically ventilated, critically ill patients. Pharmacotherapy. 2004;24(12):1659-67.
32. Cheng CH, Chen CH, Wong Y, Lee BJ, Kan MN, Huang YC. Measured versus estimated energy expenditure in mechanically ventilated critically ill patients. Clin Nutr. 2002;21(2):165-72.
33. Mesejo A, Sánchez Álvarez C, Arboleda Sánchez JA; Metabolism and Nutrition Working Group of the Spanish Society of Intensive Care Medicine and Coronary units. Guidelines for specialized nutritional and metabolic support in the critically-ill patient: update. Consensus SEMICYUC-SENPE: obese patient. Nutr Hosp. 2011;26 Suppl 2:54-8. Review.
34. Stucky CC, Moncure M, Hise M, Gossage CM, Northrop D. How accurate are resting energy expenditure prediction equations in obese trauma and burn patients? JPEN J Parenter Enteral Nutr. 2008;32(4):420-6. 35. Long CL, Schaffel N, Geiger JW, Schiller WR, Blakemore WS. Metabolic
response to injury and illness: estimation of energy and protein needs from indirect calorimetry and nitrogen balance. JPEN J Parenter Enteral Nutr. 1979;3(6):452-6.
36. Chioléro R, Revelly JP, Tappy L. Energy metabolism in sepsis and injury. Nutrition. 1997;13(9 Suppl):45S-51. Review.
37. Bruder N, Raynal M, Pellissier D, Courtinat C, François G. Influence of body temperature, with or without sedation, on energyexpenditure in severe head-injured patients. Crit Care Med.1998;26(3):568-72.