Monitoring of the degradation of concrete structures in environments
containing chloride ions
q
Pedro Romano
a, Paulo S.D. Brito
a,b,⇑, Luiz Rodrigues
aaC3i – Interdisciplinary Centre for Research and Innovation, Polytechnic Institute of Portalegre, Lugar da Abadessa, Apartado 148, 7301-901 Portalegre, Portugal bC-MADE, Centre of Materials and Building Technologies, Portugal
h i g h l i g h t s
Monitoring of steelEcorrand RPL allow an understanding of degradation of reinforced concrete structures stages.
Initiation phase detection of the degradation process could be achieved on the basis of polarization resistance monitoring. Monitoring of the concrete resistivity enables an effective knowledge of reinforced concrete structures degradation stages.
a r t i c l e
i n f o
Article history: Received 4 January 2013
Received in revised form 16 April 2013 Accepted 4 May 2013
Keywords: Monitoring Concrete
Coated reinforcement Chlorides
a b s t r a c t
This study aims to develop a methodology for evaluating the degradation of concrete structures subjected to aggressive environments containing chloride ions based on the use of monitoring systems with sensors permanently installed within the structures.
Assays were performed on specimens subjected to controlled media in the laboratory. Measurements of linear polarization resistance (LPR), ionic resistivity of the concrete and corrosion potential of embed-ded rebars and of chloride content in the concrete probes were made.
Analysis of the results based on Evans diagrams, allowed the development of a model based on the simultaneous monitoring over time of the corrosion potential of the steel reinforcement and its LPR could the identification of the various phases of the degradation process of concrete structures, particularly in the initiation phase.
Ó2013 The authors. Published by Elsevier Ltd. All rights reserved.
1. Introduction
The degradation of concrete structures subject to environments containing chloride ions, particularly marine structures and pota-ble water and wastewater treatment plants, poses major propota-blems in economic and environmental terms. Indeed, the action of these media on reinforced concrete structures causes serious degrada-tion problems after some time which involves very high costs in terms of repair and may in some situations jeopardize the stability of parts of the structure. With a view to minimizing repair costs, several monitoring techniques have been developed and imple-mented in various structures throughout the world [1–3]. The monitoring of the degradation of this type of structure allows esti-mates of degradation rates and lifetimes of structures and thus
timely maintenance interventions at significantly lower costs can be ensured[4].
It is generally accepted that the degradation of reinforced con-crete structures by chloride ions action results from the fact that these trigger a process of corrosion of reinforcing steel pitting. Within sound concrete, steel finds an environment favourable to its chemical passivation, however, when chloride ions reach the passive reinforcement by diffusion from exterior, the pitting pro-cess starts, breaking the passivation film in a very localized man-ner, and thus starting oxidation of iron. Through the water content present, the oxidation of the metal can lead to hydrolysis of the iron ions formed so that there is an increase in the acidity of the concrete near the metal surface, which prevents repassiva-tion of the steel. Then, as oxidarepassiva-tion products, mainly hydroxides, precipitate with a volume greater than the iron that gave rise to it, it causes the appearance of internal stresses in the material and cracking of the concrete covering layer that facilitates direct contact of rebars with the aggressive environment[5,6].
This degradation mechanism only becomes visible when, in a phase of frank progression, ferroginous run-off appears on the sur-faces of the structures. The detection of corrosion problems only
0950-0618/$ - see front matterÓ2013 The authors. Published by Elsevier Ltd. All rights reserved. http://dx.doi.org/10.1016/j.conbuildmat.2013.05.042
q
This is an open-access article distributed under the terms of the Creative Commons Attribution License, which permits unrestricted use, distribution, and reproduction in any medium, provided the original author and source are credited. ⇑ Corresponding author at: C3i – Interdisciplinary Centre for Research and Innovation, Polytechnic Institute of Portalegre, Lugar da Abadessa, Apartado 148, 7301-901 Portalegre, Portugal. Tel.: +351 961473079.
E-mail address:[email protected](P.S.D. Brito).
Contents lists available atSciVerse ScienceDirect
Construction and Building Materials
when the structure clearly shows these types of disorders usually gives rise to very costly repairs. From the standpoint of a project owner, there is an interest in being able to have information about the states of initiation of degradation processes to carry out repairs at reduced costs. Several papers have been published on the use of monitoring systems that allow obtaining online information on the kinetics of degradation processes, with particular attention to the stages of initiation of the corrosion process of the reinforcement and its dependence on the variations in corrosivity of the concrete over time[7,8].
Several techniques have been proposed and implemented in this type of monitoring, including several magnetic, electromag-netic and electrochemical techniques, in particular X-ray Radiogra-phy, Computerized TomograRadiogra-phy, Surface Penetrating Radar, Magnetic Field Disturbance, Electrochemical Noise, Linear Polari-zation Resistance – LPR, Electrochemical Impedance Spectroscopy – EIS, Localized Electrochemical Impedance Spectroscopy – LEIS, Galvanostatic Pulse Method – GPM, Bar Electrical Resistance – BER, Surface Potential Survey, Concrete Resistivity, and Galvanic Cell among others[3–5,9]. In parallel to this type of more specific techniques for corrosion measurements, other parameters such as temperature and relative humidity of the concrete can also com-plement the characterization of the corrosion process[4]. Electro-chemical techniques have the greater success as monitoring techniques due to their relative low cost of installation and opera-tion, as well as from the fact that the techniques share the same nature as the corrosion process itself, i.e., they are electrochemical in nature.
Most studies dealing with monitoring system application do not use only a single technique, but rather combinations of various evaluation techniques applied in a continuous or occasional way to gather information on the condition of the concrete and of the reinforcement corrosion situation. Combination of determinations of corrosion potentials of the steel reinforcement, based on LPR or EIS techniques, to assess the corrosion rate, with other concrete parameters, in particular its resistivity, have been applied[10].
The corrosion potential of the metal reinforcement is a mixed potential, resulting from the combination of the kinetics of at least two processes: the process of anodic oxidation of the iron and the reduction of dissolved oxygen. The ASTM C-876 standard recog-nizes that the iron is in a state of passivation, with a 5% probability of occurrence of corrosion when the potential of the rebars, as determined with the aid of a Cu/CuSO4reference electrode, is
situ-ated at values higher than 200 mV. If the potential is between 350 mV and200 mV, there is a 50% probability of corrosion of the reinforcement, and for values less than350 mV the likelihood of corrosion is of about 95%[11].
In the presence of a mixed process, the combination of the value of the corrosion potential of the reinforcement with measurements its corrosion rate allows a more specific evaluation of the early stages of the corrosion process. Of the various techniques which al-low the study of electrochemical corrosion kinetics, the linear polarization resistance (LPR) technique is one of the most used due to the ease of the interpretation of its results and its high reproducibility [12]. The polarization resistance,Rpol, which
dis-plays an inverse proportionality to the corrosion current,icorr, is
de-fined by Eq. (1), as the slope of the plot polarization (departure of the metal probe potential, E, from its equilibrium value, Ecorr)
against the applied current, IE, close to the corrosion potential
(Ecorr):
Rpol¼ lim
E!Ecorr EEcorr
IE
¼ babc
2:3AicorrðbaþbcÞ
ð1Þ
whereAis the local area of the reinforcement to be inspectedbaand bbare, respectively, the socalled Tafel parameters of the anodic and
cathodic process,babb/2.3/(ba+bb) ranging from 26 mV, for clearly corroding metal, and 52 mV for passive reinforcement[6].
The ionic resistivity of concrete has been used to determine the level of its contamination by ions, in particular by chloride ions
[13]. The ionic resistivity of a porous concrete depends, firstly, on the mobility and concentration of ‘‘free’’ ions, the charge carriers, in the solution which fills the concrete porosity. The ion mobility is an intrinsic characteristic of a chemical species depending mainly on temperature However, the ‘‘free’’ ion concentration de-pends on the moisture content within the pores, the degree of con-tamination by external agents and the solubility of the different salts present in the aqueous solution that fills the concrete pores. It is generally accepted that the concrete with resistivities above 20Xcm entails a very low risk of reinforcement corrosion, and for values less than 5Xcm this risk is very high[13].
In this study it is intended to develop an approach to evaluating the risk of corrosion of the reinforcement of a concrete structure subjected to environments containing high levels of chloride, par-ticularly in the early stages of the process, based on the simulta-neous analysis of the evolution of the potential and the corrosion rate of the steel reinforcement and of the ionic resistivity of the concrete, using sensors installed permanently inside concrete probe provided with steel reinforcement samples.
2. Experimental phase
Laboratory tests were conducted using three replicas of concrete prisms speci-mens with dispeci-mensions of 403015 cm3. Each specimen was provided with a mesh made by crossing perpendicularly two sets of three corrugated steel rods of 10 mm diameter, separated by 10 cm from each other, performing a total surface area of 193.2 cm2. The reinforcement was placed in the middle of the specimen to ensure a covering layer of 5 cm. The specimens were made of concrete C30/37 D16 XC3(P) Cl 0.2 S2 in accordance to the NPEN 206-1 Standard, incorporating 340 kg/m3of cement CEM II/AL 42.5 R, and 3.4 kg/m3Chrysoplast 775 plasticizer. The aggregates used was constituted of fine sand (302 kg/m3), coarse sand (506 kg/m3) and crushed sand (1016 kg/m3). Water was incorporated (170 kg/m3) to reach a W/C ratio of 0.5. After curing for 28 days in a humidified atmosphere at 25°C, the test specimens were subjected to an aging process, for about 9000 h, by contacting one of the largest surfaces of the prismatic probe with a solution of 3% NaCl maintained in a closed polymethylmethacrylate (PMMA) container with cover, but without the bottom.
Two types of sensors were embedded in the concrete of each of the test speci-mens to allow the collection of a set of electrochemical parameters, namely the po-tential and the corrosion rate of the reinforcement and the ionic conductivity of the concrete at the depth at which the steel reinforcement was set.
MonIcorrPat.Pend(seeFig. 1) sensors were used in the determination of corrosion rates of the reinforcement bars. The set of sensors allows the determination of (a) corrosion rate of the reinforcement steel by LPR technique and (b) galvanic current between a mild steel and stainless steel (SS) rods and the conductivity of the con-crete between the two SS rods. The LPR tests were performed with a variation of ±10 mV around the corrosion potential with a scan rate of 0.1 mV/s. In each con-crete probe, the concon-crete resistivity was determined at a depth of 1.5 cm from the exposed surface, applying an alternating electric field (172 Hz) is created be-tween two SS discs located at the same depth.
The data was collected periodically with the aid of an digital control and data acquisition systems.Fig. 2shows the photos of the electrochemical probes used.
The chloride ion profiles were also made, by extracting concrete powder at dif-ferent depths of the reinforcement covering layer and determining the concentra-tion by X-ray fluorescence spectroscopy (XRF). For the determinaconcentra-tion of free chloride and pH value of the pore solution a leaching procedure with distilled water was used, mixing 5 g of the sample in 50 ml of distilled water in a decantation flask with lid. After a vigorous stirring during 5 min and a resting period of 24 h, the mix-ture was filtered and finally the pH value of the filtrate was measured using a pH meter. The filter cake was then washed several times with distilled water and dried in an oven for 24 h at 100°C and, again, its chloride content was determined by XRF. The percentage of free chloride in the original mass was obtained by difference be-tween the two measurements.
3. Results and discussion
3.1. Corrosion process of the steel reinforcement
Figs. 3–5 show the variation of corrosion potential (Ecorr) and
for concrete specimens S1–S3. The first general observation that can be made is that the behaviour of the various tests performed under the same conditions, replicas, is undoubtedly very similar which is not very common with specimens of concrete, due to the heterogeneities that is characteristic of this material, even when prepared under high control. The evolution of the various magnitudes allows the identification of three phases: an initial phase, until about 200 days, when a decrease in corrosion potential and an increase in the polarization resistance of steel, i.e., a de-crease in the corrosion rate is noticed. From 200 days onwards, a simultaneous decrease in the polarization resistance and a steeper decrease in the corrosion potential are perceived. Finally, a third phase emerges from 400 days onwards when a drastic decrease
of the values of both parameters is registered, pointing out to the depassivation of the steel reinforcement. During this period, we also observed a tendency for the occurrence of repassivation of the steel surface, manifested by the simultaneous increases in the polarization resistance and the corrosion potential of the steel. Similar results were obtained by other authors[1–4].
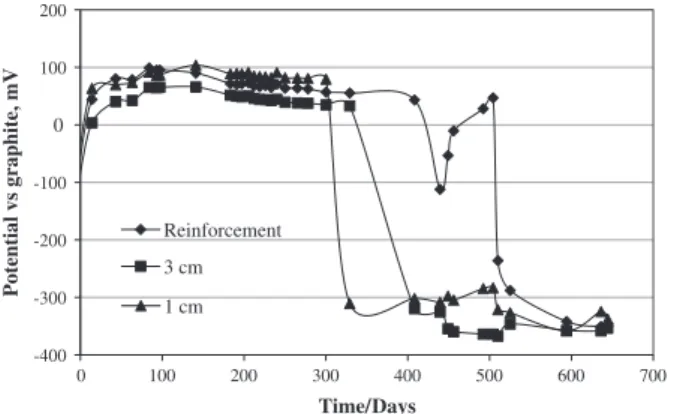
In the assays steel sensor probes of the same type as that of the reinforcement were placed at depths of 1 and 3 cm in the covering layer. Fig. 6shows the temporal variation ofEcorrfor the sensor
probes embedded in test specimen S1. It can be seen that the pac-ing of both curves is quite similar, the only differences bepac-ing the time of begin of the acceleration phase of the corrosion process. Evidently, probes placed at lower depths will suffer a generalized Working (iron)
electrode
Reference electrode
Concrete Cable
Box
4 cm 3 cm 1,5 cm
Reinforcement Counter electrode
Connection to the reinforcement
Resin
Fig. 1.Schematic representation of the MonIcorrPat.corrosion monitoring system used in the tests.
corrosion attack sooner than those that are placed at greater depths. These results clearly show that the placement of sensor probes at different depths in covering concrete layer may be a good strategy to monitor, not only the degradation of reinforced con-crete structures, but also enables acquisition of information on the kinetics of the transport processes of aggressive species[1].
To obtain data which allows the monitoring of the degradation processes of reinforced concrete structures in saline environments, it is important to obtain information related to the initial phase of the corrosion process due to the action of the chloride ions, i.e., of the initiation phase corresponding to the pitting attack[1]. It is known that, due to the high pH value of about 12.5 of the solution contained in the concrete pores, steel reinforcements are naturally passivated inside concrete. However, the passivation layer that protects the steel reinforcements can be destroyed by corrosion when the chloride ion concentration in this solution reaches a min-imal threshold value, critical chloride concentration. The ability to detect the time of the onset of the corrosion widespread to the en-tire surface of the rod may allow, in practice, the implementation of corrective actions, such as chloride ions electro-extraction and realkalinisation or even localized repairs, at costs that are consid-erably lower than those required when the corrosion process is more advanced[6]. Tuutti[14]was the first to put forward a spe-cific model to describe the corrosion of reinforcement within the concrete. The model comprises two distinct periods in the progress of the corrosion process: the initial phase, when the concrete undergoes chemical changes due to infiltration of chloride ions and carbonate ions and their diffusion to the surface of the rein-forcement bars, causing depassivation of the steel; and the propa-gation phase that extends from the start of reinforcement corrosion until the interruption of works for safety reasons. Other authors have applied this model in the search for a better charac-terization of the propagation phase[14]. The results obtained in this study are consistent with a model that shows the corrosive process comprising an initial period of activation of pitting, the second phase observed during the assays, and a period of general corrosion corresponding to zone 3 ofEcorrtime plots presented
inFigs. 3–5.
In view of the results of an analysis based on Evans diagrams, it was assumed that the corrosive process results from the conjuga-tion of the cathodic reacconjuga-tion of oxygen reducconjuga-tion and the anodic oxidation reaction of the iron in the reinforcement bars.Fig. 7a and b shows the process in schematic Evans diagrams. The initial phase of the corrosion process, when there is a decrease inEcorr
and an increase inRpcan be explained assuming that the process
undergoes a cathodic polarization concentration due to a gradually increasing difficulty of oxygen to reach the rebar surface as a sequence of the natural shrinkage and the reduction in the con-crete porosity (compare with Fig. 7a). Oxygen reaches the reinforcement bar through the side walls and from the bottom of the specimens exposed to ambient air. When the chloride ions
-525 -450 -375 -300 -225 -150 -75 0 75 150
0.00 0.20 0.40 0.60 0.80 1.00 1.20 1.40 1.60 1.80
0 100 200 300 400 500 600 700
Potential vs graphite, mV
ΩΩ
Rp
Potential
Fig. 3.Variation of polarization resistance,Rp, and corrosion potential of the steel reinforcement installed in specimen S1 during the immersion in saline solution.
-525 -450 -375 -300 -225 -150 -75
0
75 150
0.00 0.20 0.40 0.60 0.80 1.00 1.20 1.40 1.60 1.80
0 100 200 300 400 500 600 700
Potential vs graphite, mV
Rp
Potential
Fig. 4.Variation of polarization resistance,Rp, and corrosion potential of the steel reinforcement installed in specimen S2 during the immersion in saline solution.
-525 -450 -375 -300 -225 -150 -75 0 75 150
0.00 0.20 0.40 0.60 0.80 1.00 1.20 1.40 1.60 1.80
0 100 200 300 400 500 600 700
Potential vs graphite, mV
Rp
Potential
Fig. 5.Variation of polarization resistance,Rp, and corrosion potential of the steel reinforcement installed in specimen S3 during the immersion in saline solution.
-400 -300 -200 -100 0 100 200
0 100 200 300 400 500 600 700
Potential vs graphite, mV
Reinforcement
3 cm
1 cm
Fig. 6.Variation of the potential of the steel probes embedded in specimen S1 at different depths, during immersion in saline solution.
(a)
(b)
E E
log i log i
begin to reach the reinforcement surface in sufficient amounts to initiate the pitting process (when the critical chloride concentra-tion is reached), there will be a gradual depolarizaconcentra-tion of the ano-dic process accompanied by a decrease in the potential for pitting onset, as shown inFig. 7b), which leads, evidentently, to a decrease inRp(increased rate of corrosion) andEcorr.
BothEcorrandRpare very useful parameters to monitor the
deg-radation of concrete structures subjected to saline environments, and there is a close relationship between both magnitudes[8]. This relationship allows the identification of different of perfectly de-fined passivation and corrosion domains in aEcorrvs. Rp
represen-tation. Fig. 8, which shows the relation between the values of
EcorrandRpread simultaneously in the steel test probes embedded
in specimen S1.1. In this plot it is possible to identify a passivity zone, for high values ofEcorrandRp, and another active corrosion
prevails, for low values of these two parameters. However, as al-ready mentioned, a more detailed analysis of the results seems to show that regular determination ofRpvalues alone may allow
gather more information on all phases of the process, in particular to detect the initiation of the pitting process.
3.2. Chloride penetration
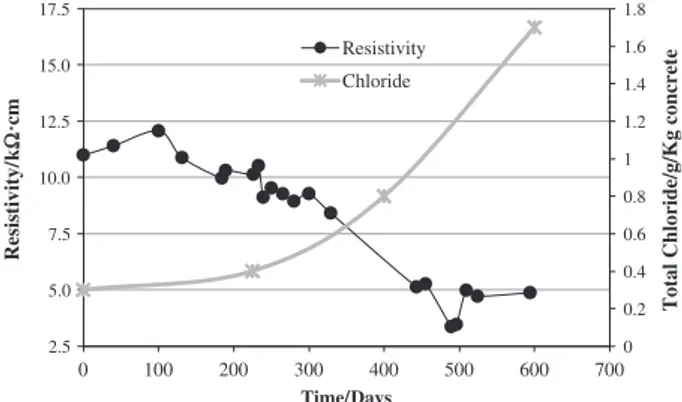
Fig. 9shows the evolution of the concrete resistivity and that of the total chlorides concentration inside the concrete at reinforce-ment level, for specimen S1. It appears that the resistivity of con-crete decreases progressively almost linearly as the concentration of chloride ions and other ions within the concrete increases. In fact, considering that the moisture content is constant, given the conditions of concrete specimen during the testing period, the de-crease in resistivity of the concrete must be attributed to the in-crease in ion concentration, first of all, due to the incorporation of chloride and sodium ions, which assures the electroneutrality within the concrete pores.
As already mentioned, since the critical chloride concentration is important for the initiation of the rebar corrosion inside the con-crete it is intended to use, of course, the concentration of chlorides as one of the key parameters for the monitoring of the degradation process. Several studies[4]refer to the great difficulty of knowing the critical chloride concentration, since this parameter depends on many operational factors and it is difficult to obtain a specific consensual value, although a value of about 1% of the cement mass is vastly accepted as a reference value. Indeed, the critical concen-tration of chloride depends on factors such as conditions of the steel-concrete interface and the steel surface itself, pH value of the solution in concrete pores, steel electrochemical potential,
nature of the binding material in the concrete, W/b relation, oxy-gen availability, temperature and humidity within the concrete, the concrete chemical composition and its level of hydration as well as its resistivity and furthermore the source of chloride ions and the nature of the counter cation[4]. Under the conditions of this study, and assuming that the process started between 250 and 300 days, it was determined that the critical concentration will be situated around the 0.6 g of total chlorides per kilogram of con-crete, clearly below the referred value.
Fig. 10shows a plot of theRpof the interface steel
rebars/con-crete against the conrebars/con-crete resistivity during the testing time. The figure shows that the phases of the degradation process identified previously, namely, initiation of pitting and the propagation of the corrosion to the entire rebar surface, largely coincide with the ranges of resistivity normally accepted as threshold for initiation of corrosion. That is, when the conductivity of the concrete be-comes high (resistivity values below 10 kXcm) the corrosion initi-ation phase is observed, on the other hand, when the conductivity becomes too high (resistivity values lower than 5 kXcm) corrosion spreads to complete steel surface. Thus, the results clearly validate the use of the concrete resistivity values for monitoring corrosive process in submerged steel reinforced structures or in structures where the moisture in the concrete pores is constantly high.
4. Conclusions
This study allows us to draw the following conclusions:
– that simultaneous monitoring of the variation, over time, of the corrosion potential of the steel reinforcement and the polariza-tion resistance of the interface steel/concrete enables the
0.00 0.20 0.40 0.60 0.80 1.00 1.20
-400.00 -300.00 -200.00 -100.00 0.00 100.00 200.00
Rp/k
ΩΩ
Ecorr/mV vs, graphite
Passivity
Fig. 8.Relationship between linear polarization resistance values, Rp, and the potential for corrosion of steel reinforcement in specimen S1, measured at the end of the same testing period.
0 0.2 0.4 0.6 0.8 1 1.2 1.4 1.6 1.8
2.5 5.0 7.5 10.0 12.5 15.0 17.5
0 100 200 300 400 500 600 700
Total Chloride/g/Kg concrete
·
cm
Resistivity
Chloride
Ω
Fig. 9.Change of the concrete resistivity and chloride concentration near the steel reinforcement installed in specimen S1.
2.5 5.0 7.5 10.0 12.5 15.0 17.5
0.00 0.20 0.40 0.60 0.80 1.00 1.20
0 100 200 300 400 500 600 700
Resistivity/
Time/
Rp
Resistivity
High conductivity
Very high conductivity
Rp/
Days
k
Ω kOhm cm
understanding of the different stages of corrosion of reinforced concrete structures, especially the early stages of the corrosive process, very relevant in real context;
– that the detection of the initiation phase of the degradation pro-cess can be conveniently achieved through the monitoring the polarization resistance of the interface steel/concrete, over time, and that the corrosion begins when the value of said quantity begins to have large oscillations;
– that monitoring of the concrete resistivity also enables effective monitoring of all phases of the corrosive process of reinforced concrete structures, whereas its variation accompanies either the potential and the polarization resistance value.
Acknowledgement
This study was financed by RITECA, ‘‘Red de Investigación Transfronteriza de Extremadura, Centro y Alentejo’’, (POCTEC – 0318_RITECA_4_E, 2008).
References
[1]Angst Ueli M, Elsener Bernhard, Larsen Claus K, Vennesland Øystein. Chloride induced reinforcement corrosion – electrochemical monitoring of initiation stage and chloride threshold values. Corros Sci 2011;53:1451–64.
[2]Raupach Michael, Schiessl Peter. Monitoring system for the penetration of chlorides, carbonation and the corrosion risk for the reinforcement. Constr Build Mater 1997;II(4):207–14.
[3]Birbilis N, Cherry BW. Alternative methodology for on-site monitoring of corrosion and remediation of reinforced concrete. Sci Technol 2004;39(4). [4]Angst Ueli M, Elsener Bernhard, Larsen Claus K, Vennesland Øystein. Critical
chloride content in reinforced concrete – a review. Cem Concr Res 2009;39:1122–38.
[5]Morris W, Vico A, Vázquez M. Chloride induced corrosion of reinforcing steel evaluated by concrete resistivity measurements. Electrochim Acta 2004;49: 4447–53.
[6]Angst Ueli M, Elsener Bernhard, Larsen Claus K, Vennesland Øystein. Chloride induced reinforcement corrosion - Rate limiting step of early pitting corrosion. Constr Build Mater 2011;25:54–60.
[7]Imran Rafiq M, Chryssanthopoulos Marios K, Onoufriou Toula. Performance updating of concrete bridges using proactive health monitoring methods. Reliab Eng Syst Safety 2004;86:247–56.
[8]Muralidharan S, Saraswathy V, Madhavamayandi A, Thangavel K, Palaniswamy N. Evaluation of embeddable potential sensor for corrosion monitoring in concrete structures. Electrochim Acta 2008;53:7248–54.
[9]Qiao Guofu, Liu Tiejun. Characterization of the reinforcing steel corrosion by potentialdynamic scan approach. J Wuhan Univ Technol-Mater Sci Ed 2012; June.
[10]Otieno Mike B, Beushausen Hans D, Alexander Mark G. Modelling corrosion propagation in reinforced concrete structures – a critical review. Cement Concr Compos 2011;33:240–5.
[11]ASTM C876–91. Annual book of ASTM Standards Vol. 04.02. ASTM, Philadelphia, PA; 1993. p. 440.
[12]Brito PSD, Rodrigues L, Cunha e P. Apresentação de um Sistema de Monitorização da Degradação de Estruturas de Betão Armado. Ingenium 2007;98.
[13]Andrade C, Castellote M, d’Andrea R. Measurement of ageing effect on chloride diffusion coefficients in cementitious matrices. J Nucl Mater 2011;412: 209–16.