Fault Location in an Electrical Energy Distribution Infrastructure with a
Wireless Sensor Network
C. Fortunato*, A. Casaca**, A. Grilo** and M. Santos*
* EDP – Energias de Portugal, Lisboa ** INESC-ID/ INOV/ IST, Lisboa
E-mail of contact author: [email protected] Portugal
.
Keywords: Fault Location, Wireless Sensor Network, Electrical Energy Distribution Infrastructure.
Abstract
This paper presents a detailed analysis of the applicability of wireless systems in the localization of faults in the energy distribution network. The hardware and software architectures of the envisaged sensor solution will also be described and finally, the integration of this system into Smart Grids will be discussed in terms of automatic fault analysis.
A pilot system has been tested in a subset of the Portuguese energy distribution infrastructure operated by EDP Energias de Portugal. It presents a new approach to a fault locator system for the power network. The purpose is to obtain faster and more reliable information about the disruptions in the power distribution network and their location.
Furthermore, the wireless sensors allow remote detection of medium and low voltage (MV/LV) power transformer hotspots in order to identify emerging malfunction as well as detection of intrusion in the MV/LV power transformers.
1 Introduction
Nowadays, the electrical energy distribution is considered a critical infrastructure in industrially developed societies and its protection regarding safety and security threats is being more and more used. The fact that this infrastructure is geographically spread across huge areas brings difficult technological challenges for the real-time prevention, detection and precise localization of anomalies. The protection and localization of faults in the electrical energy distribution is a key task for any operator of such an infrastructure. Securing the main infrastructure components through the deployment of secure wireless sensor networks (WSN) providing remote monitoring and alarm capabilities specifically in the detection of the fault location is an attractive option for achieving this goal.
This work considers the planned architecture and high-level implementation solutions for the WSN system, including a description of the protected equipments and the hardware and software architecture to be used to detect anomalies [1]. For their detection, the proposed approach in the case of the Medium Voltage (MV) overhead lines is based on the analysis of the increased current. A current transformer is used to measure its value and to drive a parasitic power source for the wireless sensor, eliminating the need for batteries and at the same time posing no power constraints on the wireless protocols. The sensors will be located in close relation with each tower and each of them monitors one power line.
We also use this wireless communication link to upload a video/image of the MV/LV power transformer of the network. At the same time an infrared thermo sensor attached to the camera sweeps the power transformer critical elements (such as the main switch board) for hotspots. The detection of a hotspot will trigger an alarm into the network. This feature improves the remote MV/LV power transformer physical security. Connected to this interface there will be also a switched on by movement camera to show access to the equipments by intruders.
2 Fault locator system
The fault detection systems are important tools for the improvement of the Service Continuity in an electrical network. They allow the reduction of the time lost in the search of defects and therefore, in the total time of the network break.
In addition to the benefits associated with the reduction of the energy interruption periods for the electrical companies and their clients, these systems have several virtues, enabling the reduction of the operation costs, the identification of the problematic network zones and the avoidance of the equipment deterioration related to the network reconnection over permanent defects during the traditional process of fault localization [2].
There are several methodologies for the detection and localization of faults used by the Electrical Companies. From systems based on the implementation of Fault Locator in the distribution networks, to the adoption of analytic methods supported by the Supervision Control And Data Acquisition (SCADA) systems.
Using analytic methods we can detect faults [3], through wave transmission, the high frequency components of the currents and tensions and the fundamental frequency of the currents and tensions, measured in the line terminals (also called Impedance Based Methods).
The Impedance Based Methods, consisting in the lines’ impedance calculation in their terminations and in the estimation of the distance to the defects are, due to the easiness of implementation, the most adopted by the Electrical Companies. These methods can use the measurements of one of the lines’ terminations or the measurements of the two lines’ terminations. The impedance based methods [4] have a precision of 2 to 3% of the total length of the line. The precision of this method is influenced by several factors, including the combined effect of the charge current and the resistance of the defect (reactance effect), the imprecision in the identification of the type of defect (phases in fault) and the uncertainty about the parameters of the lines, particularly the homopolar impedance [5].
Nowadays, MV protection units usually have the function of fault locator incorporated, which is a well established function for transmission networks. However, distribution networks have some differences that must be taken into consideration. The main factor is that distribution networks are radial and constituted by many branches, which may have different impedances. In that way, it is not possible to use this information as it is commonly used in higher voltage levels.
In High Voltage (HV) networks each line has a protection unit capable of comparing impedances of the line and fault and transmitting the fault’s location data. However, in MV networks that is not possible because, despite being radial, there are many ramifications with different electrical characteristics.
An option is to use the wireless sensors to communicate from the local network to the SCADA system, which processes the signals sent by the sensors, allowing the operator to know the location of the fault. For example, a sudden variation of current measurements is usually considered a fault indication. If, for a pair of sensor nodes that are adjacent in the same branch of the electricity distribution network, only one of them is able to measure that sudden variation, then there is a high probability that the fault is located precisely between those sensor nodes. This solution can be easily implemented with reduced costs.
3 Case study
The proposed approach was tested through a case study of a distribution line and MV/LV Power Transformer. This case study was made within the FP7 European project WSAN4CIP, which uses a WSN technology. Here, the faults can be located quickly, reducing the time of a power outage. A more complete view of the whole system deployed for fault location can be generically observed in Fig. 1. A picture of the MV Current Sensor prototype developed by INOV with the contribution of EDP can be seen in Fig. 2.
Fig.1. MV/LV electricity distribution infrastructure Fig.2 The prototype of the MV Current Sensor Basically there are sensors at the substation to monitor the status of the trip coils, the temperature of the transformers and the neutral resistor and at the power lines to monitor the current and detect and locate the faults. In the MV/LV power transformers placed in the secondary substation, there are also video sensors to detect intrusions and hotspots.
The WSN interacts with the SCADA system to allow a centralized monitoring and control of the protection system. A gateway node acts as a sink node to receive data from the sensors and provides the interface to the Supervision Station.
There is usually a line-of-sight between the towers with the indicated facilities installed. We used a combination of software and easily installed line mounted equipment that monitors the distribution network. The current sensors were installed on the three phases of the towers, which communicate between them via radio (Wi-Fi).
The sensors provide line current data, and are “self powered” via the magnetic field on the line, or alternatively by the on-board back-up battery when an outage occurs. The sensor board is remotely configurable; therefore it can be used as a fault/event detector load monitor with user configurable thresholds. All data may be accessed via a secure web-controller. This allows the user to view all available currents on the network.
The fault locator system operation is shown in Fig.3. It resumes the integration of a Wi-Fi intelligent fault locator system for the early detection of abnormalities in the network branches. The system is based on the use of several fault detectors (current sensors) in the network towers, which transmit information among them. This allows immediate user notification of the fault’s location.
Fig.3. Concept of the Fault Detection and Identification System
The video streaming scenario is the most demanding in terms of sensor network resources. Video is streamed multihop from MV/LV power transformer to the SCADA supervision station when a passive infrared motion detector detects an intrusion [5].
The human machine interface of the system is shown in Fig.4. With those outputs it is possible to see the status of the network of sensors, the alarms, the currents and the images of intrusion and hotspots.
Fig.4. Screens of the SCADA System
A database of all faults is created in the SCADA system; this way it is possible to analyze the location and type of faults over time, providing valuable information for intervention in the network’s maintenance.
In the WSAN4CIP project we focused into improving the dependability of the substation components, MV and LV power lines, and MV/LV power transformers in the secondary substations. We have defined solutions for the remote active monitoring of: i) substation circuit breaker trip coil status; ii) temperature of the substation power transformer oil, substation neutral reactance oil and substation neutral resistor coil box; iii) MV and LV power line current activity; iv) MV/LV power transformer hotspot detection; v) human activity in the secondary substation through the use of movement detectors and video cameras. All the monitored parameters and images are visualized at the SCADA system, through a special-purpose graphical user interface. The communication between the sensors is done through the IEEE 802.11g protocol (Wi-Fi).
The generic configuration of the system is shown in Fig. 5. The WSAN is integrated with the SCADA system by means of a SCADA/WSAN Gateway, in order to provide a unified power distribution infrastructure interface to the human operators.
Fig.5. Configuration of the WSAN based system
of 6-20 V DC. The Energy Unit in the board is able to harvest energy from the MV power-line, assuring the autonomy of the sensor nodes for a long time period, without need for maintenance.
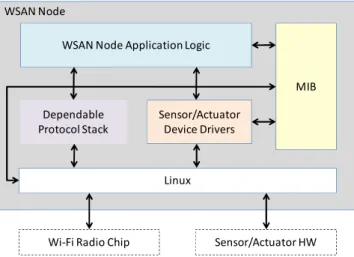
The software modules of the WSAN node are depicted in Fig. 6. The selected Operating System is Linux.
The main software modules of a generic WSAN4CIP node are the following:
• WSAN Sensor/Actuator Application Logic: Application logic of the WSAN node, managing sensors, actuators and communications.
• Dependable Protocol Stack: The Routing and Transport protocols. The transport layer consists of a secured version of the Distributed Transport for Sensor Networks (DTSN),
while routing consists of a secure version of the Routing Protocol for Low power and Lossy Networks (RPL),
• Sensor/Actuator Device Driver: Software that provides access to each type of sensor/actuator.
• Management Information Base (MIB): Configuration parameters of the WSAN nodes.
WSAN Node
WSAN Node Application Logic
Dependable Protocol Stack
Sensor/Actuator Device Drivers
MIB
Wi-Fi Radio Chip
Linux
Sensor/Actuator HW
Fig.6.Software architecture of the sensor node 4 Experimental results
Tests were conducted in the WSAN4CIP trial network in order to assess the performance of the supported services and compliance with the requirements provided by EDP.
For the current measurement tests, extra current was externally injected into the power lines by the EDP technicians and the sensor reports were confronted against the known current injection values.
For the intrusion and hotspot detection tests, the respective situations were simulated by the EDP and INOV team. The tests entailed the transmission of images from the MV/LV power transformer to the primary substation. For the hotspot detection, a soldering iron was placed in front of the camera, while for intrusion detection, a member of the EDP team simulated intrusions in the secondary substation.
The measurement precision test results are listed in Table 1 and Table 2. For the power line current measurements, the average error was 4.58% with peaks of 10.83%. This precision, although we are at a prototype level, is enough to detect breakdown spots in the power-lines as well as to provide coarse reports about the distribution of current consumption within the EDP network.
Table 1. Temperature and Current Precision Evaluation. Application Number of
Trials
Average Error
Maximum Error
Standard Deviation Power Line
Table 2. Event Precision Evaluation.
Application Number of Trials Measurement Errors Success Rate
Intrusion Detection 11 0 100 %
Hotspot Detection 10 0 100 %
The delay performance results are listed in Table 3.
Table 3. Delay Evaluation. Application Average
Delay
Standard Deviation (%)
Delay Bound Requirement Power Line Current
Measurement (1 hop) 21.5 ms 5.1 ms < 10 s
Power Line Current
Measurement (5 hops) 120.2 ms 10.0 ms < 10 s
Intrusion Detection 2.1 s 1.1 s < 10 s
Hotspot Detection 2.2 s 0.4 s < 10 s
The power-line sensing delay was measured at two different nodes, located at 1 hop and 5 hops from the SCADA/WSAN Gateway. At 5 hops, the delay was still a small fraction of the allowed maximum. Intrusion and hotspot detection figures are relative to the sensor node located at the secondary substation, which was positioned at approximately 7 hops from the SCADA/WSAN Gateway. Regarding packet losses, no packets were lost during these scalar sensor tests.
The results of the video performance evaluation tests are listed in Table 4. Results are presented for two transport protocols: DTSN [7][8] and UDP, in both cases running over the IP protocol. UDP is currently the de facto transport protocol for delay-sensitive multimedia data, although it provides no reliability support, while DTSN provides optimized retransmission-based reliability.
As can be seen, both UDP and DTSN present similar delay and jitter performance, being able to comply with the requirements defined by EDP. DTSN achieves lower frame losses due to its error recovery mechanism, while achieving slightly lower delay. Although neither of the tested transport protocols is able to provide the required channel capacity of 768 Kbit/s, both are able to support the required resolution at a frame rate that is even higher than the one defined therein. The difference towards the required channel capacity is also not too significant, being respectively 11.5% and 12.5% for UDP and DTSN.
Table 4. Video Streaming Evaluation.
Transport Protocol Parameter Average Standard Deviation Requirement
UDP
Delay 183 ms 35 ms < 10 s
Jitter 10 ms 4 ms < 200 ms
Throughput 233 Kbit/s - -
Video frames lost 0.83% 2% < 2%
Channel capacity 680 Kbit/s 191 Kbit/s 768 Kbit/s
DTSN
Delay 176 ms 37 ms < 10 s
Jitter 11 ms 5 ms < 200 ms
Throughput 243 Kbit/s - -
Video frames lost 0.00% 0.00% < 2%
Channel Capacity 672 Kbit/s 188 Kbit/s 768 Kbit/s
5 Conclusions
System. The signals acquired from the electrical grid are processed in the server to identify the kind and location of fault. To identify the faulty operation it will be used the program to detect the towers in which the faults exist. In order to confirm the proposed approach several test results for different situations have been presented.
This paper has presented the planned architecture and high-level implementation solutions for the WSN system, including a description of the protected equipments, the hardware and software architecture. We can conclude that it is possible pre-fault detection, which will prevent some damages in major equipments, minimizing the impact on clients; the faults can be located quickly, reducing the time of a power outage.
The WSAN4CIP project fits in the Smart Grid EDP project and it is a proof of concept and a step forward in fault and pre-fault detection.
This Project can also be included in the Distribution Automation (DA), which is a key component of the smart grid. The sensors, on the other hand, could transmit the signals of fault location in order to correct it via the switch in MV mixed networks.
Acknowledgment
The research leading to these results has received funding from the European Community’s Seventh Framework Programme under grant agreement no. 225186. Consortium: Eurescom, IHP Microelectronics, NEC Europe, INOV, EDP Energias de Portugal, Budapest University of Technology and Economics, INRIA, Lulea University of Technology, Sirrix, Tecnatom, University of Malaga and FWA.
References
[1] A. Grilo, A. Casaca, M. Nunes, C. Fortunato, “Wireless Sensor Networks for the Protection of an Electrical Energy Distribution Infrastructure”, in IFIP AICT 328, IFIP TC11 International Conference CIP 2010, Springer, ISSN 1868-4238, pp. 373-383, September 2010
[2] Krajnak D. J., Faulted Circuit Indicators and System Reliability, Rural Electric Power Conference, ISBN: 0-7803-5905-4, 2000
[3] Saha M., Das R., Verho P., Novosel D., Review of Fault Location Techniques for Distribution Systems, Power Systems and Communications Infrastructures for the future, Beijing, September 2002
[4] Tang Y., Wang H. F., Aggarwal R. K., Johns A. T., Fault Indicators in Transmission and Distribution Systems, International Conference on Electric Utility Deregulation and Restructuring and Power Technologies, April 2000
[5] IEEE Guide for the Application of Faulted Circuit Indicators for 200 / 600 A, Threephase Underground Distribution, IEEE Power Engineering Society, IEEE Std 1610TM-2007, May 2008
[6] Paulo Rogério Pereira, José Gonçalves, António Grilo, Carlos Fortunato, Mário Serafim Nunes, Augusto Casaca, Energy and Quality of Service Management in Wireless Multimedia Sensor Networks, 11a Conferência sobre Redes de Computadores (CRC'2011), pp. 87-94. ISBN: 978-989-96001-6-4. Coimbra, Portugal, 17-18 November 2011
[7] B. Marchi, A. Grilo, and M. Nunes, "DTSN: Distributed Transport for Sensor Networks," Proceedings of the IEEE Symposium on Computers and Communications (ISCC'07), Aveiro, Portugal, IEEE, ISBN 978-1-4244-1520-5, 1-4 July 2007, pp.165-172.