ISSN 1546-9239
© 2006 Science Publications
Corresponding Author: T. Benslimane, Research Laboratory of Electrification in Industrial Enterprises, University of Boumerdes, Algeria
1979
Choice Of Input Data Type Of Artificial Neural Network To Detect Faults In Alternative
Current Systems
1
T. Benslimane, 2 B. Chetate and 3 R. Beguenane 1, 2
Research Laboratory of Electrification in Industrial Enterprises, University of Boumerdes, Algeria 3
Groupe ERMETIS, Département des sciences appliquées, Université du Québec à Chicoutimi, Canada
Abstract: This paper present a study on different input data types of ANN used to detect faults such as over-voltage in AC systems (AC network , induction motor). The input data of ANN are AC over-voltage and current. In no fault condition, voltage and current are sinusoidal. The input data of the ANN may be the instantaneous values of voltage and current, their RMS values or their average values after been rectified. In this paper we presented different characteristics of each one of these data. A digital software C++ simulation program was developed and simulation results were presented.
Keywords: Diagnosis, Learning Data type, AC voltage and current, instantaneous value, RMS value, Average value.
INTRODUCTION
AC systems (AC network , induction motor) may be exposed to different kinds of faults (over-voltage, single phasing, under-voltage, unbalance state). These faults need to be detected and identified rapidly in order to take the appropriate procedure to protect the AC system. That is possible by using the artificial neural network. This former need input data in its conception and to be used after that. The input data must be significantly sensible to all faults that happen.
Choice of data type (mathematical models and simulation results)
The simulation is done by using the software programmation language C++ with following parameters: Vrms = 115.45 V & 220 V , 50 Hz ,
Sample time T=0.0001 seconds.
Sinusoidal instantaneous value of voltage and current AC systems diagnosis may be presented by the following scheme :
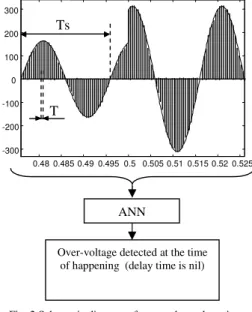
In the following part, we will simulate the over-voltage and thus we will consider only the voltage signal as an input of the ANN. Voltage is acquired in sample time of T (fig. 2). Then, It is filtered to get the sinusoidal fundamental component which will be introduced to the ANN to detect the fault type.
In this case, if Ts is the signal period and T is the simple time, there will be ((Ts/T)+1) per period value that will be introduced to faults detection ANN to conceive it. By the other hand, when the ANN model is completed, the fault detection (for example over-voltage) is done
instantaneously (without delay time). This data type is sensible to all kinds of faults even very short time ones (pulses).
RMS value of Sinusoidal voltage RMS value per period
Numerical integration
In this case, RMS value of sinusoidal voltage is calculated and introduced to the ANN to detect the faults.
RMS value of sinusoidal signal of Ts as period can be calculated as follow:
V
(
t
)
dt
Ts
1
Vrms
2Ts
0
2
=
(1)Numerically, RMS value can be calculated by:
Vi
T
Ts
1
Vrms
2N
1 i 2
=
=
(2) Voltageand current
Filter ANN
Fault
type
Fig. 1 Schematic diagram of fault detection in AC system
ANN
Over-voltage detected at the time of happening (delay time is nil)
0.480.4850.490.4950.5 0.5050.510.5150.520.525
-300 -200 -100 0 100 200 300
T Ts
1980 where:
Vi is the voltage at time t=i, T is the sampling time,
N is the number of sample voltage values taken per period:
1
T
Ts
N
=
+
(3)The RMS value of sinusoidal voltage is always given at the end of each period (fig 3). The voltage V is defined like follow:
(4)
After calculating its RMS value using this method, we get:
(5)
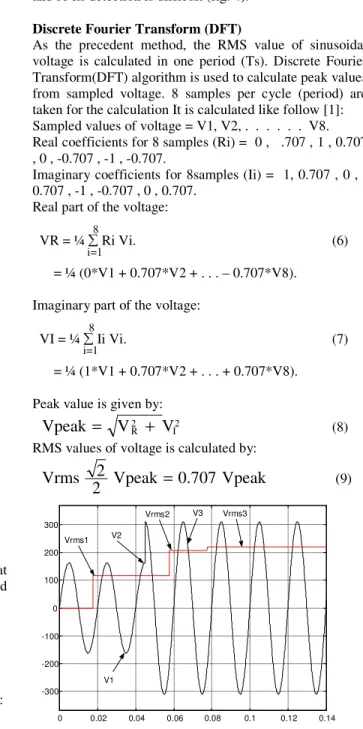
As said before, it is clear that the RMS value of the voltage is always got at the end of each period. When an
over-voltage occurs at a any time between nTs and (n+1)Ts, there will be an increase in the RMS value that is recovered at (n+1)Ts with a varying delay time between 0 and Ts. This delay time, wasted in calculation of RMS value, added to the time of execution of the ANN program increase the time between the fault and its detection. This data type is sensible to all kinds of faults but more the fault is shorter in time (pulses) more its influence is limited and so its detection is difficult (fig. 4).
Discrete Fourier Transform (DFT)
As the precedent method, the RMS value of sinusoidal voltage is calculated in one period (Ts). Discrete Fourier Transform(DFT) algorithm is used to calculate peak values from sampled voltage. 8 samples per cycle (period) are taken for the calculation It is calculated like follow [1]: Sampled values of voltage = V1, V2, . . . V8. Real coefficients for 8 samples (Ri) = 0 , .707 , 1 , 0.707 , 0 , -0.707 , -1 , -0.707.
Imaginary coefficients for 8samples (Ii) = 1, 0.707 , 0 , -0.707 , -1 , --0.707 , 0 , -0.707.
Real part of the voltage:
VR = ¼ Ri Vi. (6) = ¼ (0*V1 + 0.707*V2 + . . . – 0.707*V8). Imaginary part of the voltage:
VI = ¼ Ii Vi. (7) = ¼ (1*V1 + 0.707*V2 + . . . + 0.707*V8). Peak value is given by:
2
I 2
R
V
V
Vpeak
=
+
(8)RMS values of voltage is calculated by:
Vpeak
0
.
707
Vpeak
2
2
Vrms
=
(9)The voltage V is defined like follow:
(10) V1 0<t<2Ts
V = V2 2Ts<t<3Ts V3 3Ts<t<6Ts
0 0<t<Ts Vrms1 Ts<t<2Ts Vrms = Vrms1 2Ts<t<3Ts Vrms2 3Ts<t<4Ts Vrms3 4Ts<t<5Ts Vrms3 5Ts<t<6Ts
0 0.02 0.04 0.06 0.08 0.1 0.12 0.14
-300 -200 -100 0 100 200 300
V1 V2
V3
Vrms1
Vrms2 Vrms3
Ts 2Ts 3Ts 4Ts 5Ts 6Ts
Fig. 3 Simulation result of over-voltage influence on RMS value of voltage calculated by numerical
integration method i=1
8
i=1 8
0 0.02 0.04 0.06 0.08 0.1 0.12 0.14
-300 -200 -100 0 100 200 300
V1
Vrms1 V2
V3
Vrms2 Vrms3
Fig. 5 Simulation result of over-voltage influence on RMS value of voltage calculated by Discrete Fourier
Transform method (DFT)
V1 0<t<0.04 V = V2 0.04<t<0.06 V3 0.06<t<0.12
Fig. 4 Simulation result of sensibility of RMS value of voltage calculated by numerical
integration method
0 0.01 0.02 0.03 0.04 0.05 0.06 0.07 0.08 0.09 0.1
-300 -200 -100 0 100 200 300
1981 After calculating its RMS value using this method, we get:
(11)
It is clear that the RMS value of the voltage is always got at ((7*Ts/8)+(n*Ts)) (fig. 5). When an over-voltage occurs at a any time between ((7*Ts/8)+(n*Ts)) and ((7*Ts/8)+((n+1)*Ts)), there will be an increase in the RMS value that is recovered at ((7*Ts/8)+((n+1)*Ts)) with a varying delay time between 0 and Ts. This delay time, wasted in calculation of RMS value, added to the time of execution of the ANN program increase the time between the fault and its detection.
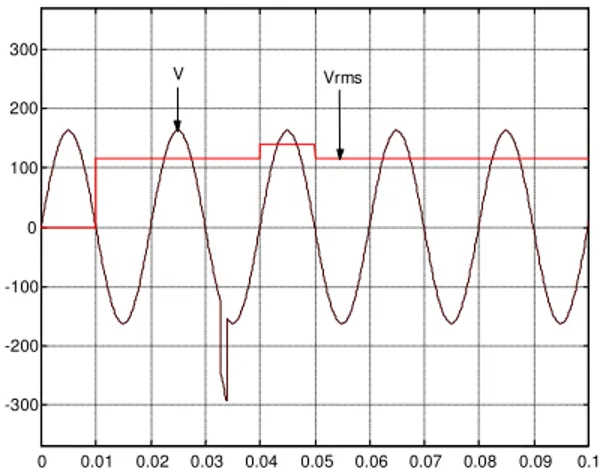
This data type is sensible to all kinds of faults unless very short time ones (pulses) that occurs between (n*Ts/8) and ((n+1)*Ts/8) because there will be no influence on the RMS value of the voltage calculated by DFT method (fig. 6).
RMS value per half period
By replacing Vi2 by Vicar in the expression (2) we get:
Vicar
T
Vcarave
Ts
1
Vrms
N
1 i
2
=
=
=
(12) Since Vicar is always positive (Vicar=Vi2) and according to last mathematical expression (12), it can be said that Vrms2 is the square of average value of the function Vicar that is the square of the function Vi. Hence, it is possible to calculate Vrms by calculating the average value of the function Vicar which has Ts/2 as period (Vicar=Vi2). So instead of calculation of RMS value of Vi along one period (Ts), it is preferable to calculate the average value of Vi2 along its period (Ts/2) and then we calculate its square root (fig. 7).
The voltage V is defined like follow:
(13)
After calculating its RMS value using this method, we get:
(14)
As said before, it is clear that the RMS value of the voltage is always got at the end of each half period of V (Ts/2) (fig. 8). When an over-voltage occurs at a any time between (nTs/2) and ((n+1)Ts/2), there will be an increase in the RMS value that is recovered at ((n+1)Ts/2) with a varying delay time between 0 and Ts/2.
This data type is sensible to all kinds of faults but more the fault is shorter in time (pulses) more its influence is limited and so its detection is difficult (fig. 9).
0 0<t<7*Ts/8
Vrms1 7*Ts/8<t<7*Ts/8+2Ts Vrms= Vrms2 7*Ts/8+2Ts<t<7*Ts/8+3Ts Vrms3 7*Ts/8+3Ts<t<7*Ts/8+4Ts Vrms3 7*Ts/8+4Ts<t<7*Ts/8+5Ts
0 0.01 0.02 0.03 0.04 0.05 0.06 0.07 0.08 0.09 0.1
-300 -200 -100 0 100 200 300
V Vrms
Fig. 6 Simulation result of sensibility of RMS value of voltage calculated by Discrete Fourier
Transform method (DFT)
0 0.01 0.02 0.03 0.04 0.05 0.06
-5 0 5 10 15 20
Vi * Vi
Vi
Vrms * Vrms = Vcarave
Vrms
Fig. 7 Simulation result of RMS value of voltage Vi and average value of Vi2
V1 0<t<0.04 V = V2 0.04<t<0.05 V3 0.05<t<0.10
0 0<t<0.01 Vrms = Vrms1 0.01<t<0.05 Vrms2 0.05<t<0.06 Vrms3 0.06<t<0.1
0 0.01 0.02 0.03 0.04 0.05 0.06 0.07 0.08 0.09 0.1
-300 -200 -100 0 100 200 300
V1
V2 V3
Vrms1
Vrms2 Vrms3
Fig. 8 Simulation result of over-voltage influence on RMS value of voltage based on the average value of
1982 In figure 10 are compared the sensibilities of RMS values of voltage calculated by different methods. It’s cleat that the RMS value of voltage based on the average value of its square calculated by numerical integration method (Vrms NI(Ts/2)) is the most sensible to short variations. While the RMS value of voltage calculated by numerical integration method (Vrms NI(Ts)) is less sensible and the
RMS value of voltage calculated by DFT method (Vrms (DFT)) is the least sensible to short time variations. Average value of rectified voltage
In this case, voltage is filtered and rectified. The average value of output signal of the rectifier is calculated and introduced to the ANN to detect the fault (fig. 12) [2].
The rectifier may be realized hardly or softly.
The mathematical expression that allows the calculation of the average value of rectified voltage is:
dt
)
t
(
V
2
Ts
1
Vave
2 / Ts
0
=
(15)Numerically, this average value can be calculated by:
Vi
T
2
/
Ts
1
Vave
' N
1 i=
=
(16)where :
Vi is the voltage at time t=i, T is the sampling time,
N’ is the number of sample voltage values taken per half period:
1
T
2
/
Ts
'
N
=
+
(17)The mathematical expression linking this average value to the maximal value is:
π
=
2
V
max
Vave
(18)0 0.01 0.02 0.03 0.04 0.05 0.06 0.07 0.08 0.09 0.1
-300 -200 -100 0 100 200 300
V Vrms
Fig. 9 Simulation result of sensibility of RMS value of voltage based on the average value of its square
calculated by numerical integration method
Fig. 10 Simulation result of comparison of sensibilities of RMS values of voltage
calculated by different methods
0 0.01 0.02 0.03 0.04 0.05 0.06 0.07 0.08 0.09 0.1 -300
-200 -100 0 100 200 300
V
Vrms(DFT) Vrms(NI (Ts)) Vrms(NI (Ts/2))
Fig. 12 Schematic diagram of fault detection in AC system based on average value of
rectified voltage Voltage
and current
Filter
Fault
type Rectifier
ANN
Fig. 13 Simulation result of over-voltage influence on average value of rectified voltage
0 0.01 0.02 0.03 0.04 0.05 0.06 0.07 0.08 0.09 0.1
-300 -200 -100 0 100 200 300
V
Vrectified Vave
0 0.01 0.02 0.03 0.04 0.05 0.06 0.07 0.08 0.09 0.1
-300 -200 -100 0 100 200 300
Vrms(NI (Ts/2))
Vrms(NI (Ts)) Vrms(DFT)
Fig. 11 Simulation result of comparison of over-voltage influence on RMS values of over-voltage
1983 As said before, it is clear that the average value of the rectified voltage is always got at the end of each half period of V (Ts/2) (fig. 13). When an over-voltage occurs at a any time between (nTs/2) and ((n+1)Ts/2), there will be an increase in the average value that is recovered at ((n+1)Ts/2) with a varying delay time between 0 and Ts/2. This data type is sensible to all kinds of faults but more the fault is shorter in time (pulses) more its influence is limited and so its detection is difficult (fig. 14).
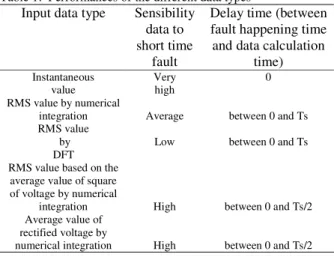
The following table, recapitulate the performances of each one of the data types mentioned before.
Table 1: Performances of the different data types
Input data type Sensibility data to short time
fault
Delay time (between fault happening time and data calculation
time) Instantaneous
value
Very high
0
RMS value by numerical
integration Average between 0 and Ts RMS value
by DFT
Low between 0 and Ts
RMS value based on the average value of square of voltage by numerical
integration High between 0 and Ts/2 Average value of
rectified voltage by
numerical integration High between 0 and Ts/2
CONCLUSION
In this paper, are presented the different data inputs of ANN used to detect faults (over-voltage) in AC systems. These data are compared at different levels such as sensibility to fault and delay time of influence of fault on the data. The ANN input data is selected according to the application.
REFERENCES
1. S. R. Kolla and L. Varatharasa, 2000 “Identifying three-phase induction motor faults using artificial neural networks,” ISA Transactions, Vol. 39, pp. 433-439
2. Mesure de tension efficace vrai 2005 (true rms _ root-mean-square), crête et moyenne, Actualités du test, de la mesure et de l’électronique-le journal T&M électronique gratuit du net.
0 0.01 0.02 0.03 0.04 0.05 0.06 0.07 0.08 0.09 0.1
-300 -200 -100 0 100 200 300
Vrectified Vave
V
Fig. 14 Simulation result of sensibility of average value of rectified voltage calculated by numerical