*Correspondence: Abdul Baquee Ahmed. Girijananda Chowdhury Institute of Pharmaceutical Science. Hathkhowapara, Azara. Guwahati-781017, India. E-mail: baquee1977@gmail.com, rupasengupta222@rediffmail.com
Article
vol. 51, n. 2, apr./jun., 2015 http://dx.doi.org/10.1590/S1984-82502015000200024
Atorvastatin calcium loaded chitosan nanoparticles:
in vitro
evaluation and
in vivo
pharmacokinetic studies in rabbits
Abdul Baquee Ahmed
1,*, Ranjit Konwar
1, Rupa Sengupta
21Girijananda Chowdhury Institute of Pharmaceutical Science, Azara, Guwahati, India, 2ROFEL, Shri G.M.Bilakhia College of
Pharmacy, Vapi, Gujarat, India.
In this study, we prepared atorvastatin calcium (AVST) loaded chitosan nanoparticles to improve the oral bioavailability of the drug. Nanoparticles were prepared by solvent evaporation technique and evaluated for its particle size, entrapment eficiency, zeta potential, in vitro release and surface morphology by scanning electron microscopy (SEM). In addition, the pharmacokinetics of AVST from the optimized formulation (FT5) was compared with marketed immediate release formulation (Atorva®) in rabbits. Particle size of prepared nanoparticles was ranged between 179.3 ± 7.12 to 256.8 ± 8.24 nm with a low polydispersity index (PI) value. Zeta potential study showed that the particles are stable with positive values between 13.03 ± 0.32 to 46.90 ± 0.49 mV. FT-IR studies conirmed the absence of incompatibility of AVST with excipient used in the formulations. In vitro release study showed that the drug release was sustained for 48 h. Results of pharmacokinetics study showed signiicant changes in the pharmacokinetic parameter (2.2 fold increase in AUC) of the optimized formulation as compared to marketed formulation (Atorva®). Thus, the developed nanoparticles evidenced the improvement of oral bioavailability of AVST in rabbit model.
Uniterms: Atorvastatin calcium/oral bioavailability/experimental study. Atorvastatin calcium/in vitro release. Atorvastatin calcium/pharmacokinetics. Nanoparticles/drugs bioavailability.
No presente estudo, preparamos nanopartículas de quitosana com atorvastatina cálcica (AVST) para melhorar a biodisponibilidade oral do fármaco. As nanopartículas foram preparadas pela técnica de evaporação de solvente, avaliando-se a granulometria, a eiciência de encapsulamento, o potencial zeta, a liberação in vitro e a morfologia da superfície, por meio da microscopia eletrônica de varredura (MEV). Além disso, a farmacocinética da formulação otimizada de AVST (FT5) foi comparada com a formulação comercial, de liberação imediata, comercializada (Atorva®), em coelhos. O tamanho das das nanopartículas variou na faixa de 179,3 a 256,8 ± 7,12 ± 8,24 nm, com baixo índice polidispersibilidade (PI). O estudo do potencial Zeta mostrou que as partículas são estáveis, com valores positivos entre 13,03 ± 0,32 a 46,90 ± 0,49 mV. Os estudos de FT-IR conirmaram a ausência de incompatibilidade de AVST com o excipiente utilizado nas formulações. O estudo de liberação in vitro mostrou que liberação sustentada do fármaco por 48 horas. Os resultados do estudo farmacocinético mostraram alterações signiicativas nos parâmetros (aumento de 2,2 vezes na ASC) da formulação otimizada em relação à comercializada (Atorva® ). Assim, o desenvolvimento de nanopartículas evidenciou a melhora da biodisponibilidade oral de AVST em coelhos.
INTRODUCTION
O r a l i n g e s t i o n i s t h e m o s t c o n v e n i e n t a n d commonly employed route of drug delivery due to its ease of administration, high patient compliance, cost
effectiveness, least sterility constraints and lexibility in
the design of dosage form. However, the major problem with the design of oral dosage forms lies with their poor bioavailability. The oral bioavailability depends on several factors including aqueous solubility, drug permeability,
dissolution rate, irst pass metabolism and susceptibility to eflux mechanisms. The most frequent causes of low
bioavailability are attributed to poor solubility and low permeability (Yellela, 2010).
Nanoparticles (NP) are a type of colloidal drug delivery system comprising particles with a size range from 10 to 1000 nm in diameter. Nanoparticles may or may not
exhibit size-related properties that differ signiicantly from those observed in ine particles or bulk materials (Buzea,
Pacheco, Robbie, 2007). The uptake of nanoparticulate systems (NPSs) through the gastrointestinal tract (GIT) is today a well-known and accepted phenomenon, NPS uptake from the gut can provide an additional drug administration route; each system has its own
pharmacokinetic parameters and speciic drug-carrying
ability. The bioactive molecule is transported into the GIT by carriers whose physicochemical characteristics must be taken into account, although the physicochemical and pharmacological characteristics of the drug remain intact (Kreuter, 1991; Hussain, Jaitely, Florence, 2001; Florence, Hussain, 2001; Nishioka, Yoshino, 2001; Hans, Lowman, 2002).
Peyer’s patches are the most important structural units of the gut associated with lymphoid tissue (GALT); they are characterized by M-cells that overlie the lymphoid tissue and are specialized for endocytosis and transport into intraepithelial spaces and adjacent lymphoid tissue. Nanoparticles bind to the apical membrane of M-cells, after which they are rapidly internalized and “shuttled” to the lymphocytes. The lymphatic absorption of a drug via the GALT has an advantage over the portal blood route, because it avoids presystemic metabolism by the liver
(hepatic irst-pass effect) (Florence, Hussain, 2001; Hans,
Lowman, 2002).
Nanoparticles were irst developed for the parenteral
route; more recently, they have also been studied as oral delivery vehicles. The major interest is in the lymphatic uptake of nanoparticles by Peyer’s patches in the GALT (Bala, Hariharan, Kumar, 2004). Microparticles remain in Peyer’s patches, while nanoparticles are disseminated systemically (Hans, Lowman, 2002). Clearly, a wide
variety of drugs can be delivered via the oral route using polymeric nanoparticulate carriers and much of the research has focused on the absorption enhancement of peptides proteins, and vaccine antigens (Delie, Blanco-Prieto, 2005).
Mucoadhesive ability can be conferred to NPSs by coating their surface with microadhesive polymers such as chitosan or Carbopol; action is more effective and
prolonged, conirming the usefulness of mucoadhesive
properties (Takeuchi, Yamamoto, Kawashima, 2001). Insulin entrapped in PACA nanospheres dispersed in an oily phase containing a surfactant produces prolonged hypoglycemia (Damge et al., 1997b). The fate of poly (isobutylcyanoacrylate) nanocapsules carrying insulin
administered to rats was monitored by luorescence and
transmission electron microscopy (TEM) and evidenced intestinal absorption through the epithelial mucosa (Pinto-Alphandary et al., 2003). A luminescent polymer was used as a visible tracer to monitor the oral fate of PLGA microspheres containing insulin (Li, Jang, Jin, 2004). The therapeutic effects of another peptide, octreotide, can be improved and prolonged on incorporation into PACA nanocapsules (Damge et al., 1997a).
AVST, (3R,5R)-7-[2-(4-fluorophenyl)-3-phenyl- 4-(phenylcarbamoyl)-5-propan-2-ylpyrrol-1-yl]-3,5-dihydroxyheptanoic acid, calcium salt (2:1) trihydrate, is a BCS class II drug used in the treatment of hypercholesterolemia. It is insoluble in aqueous solutions at pH 4 and below. It exhibits low oral bioavailability of 14% which is ascribed to the presystemic clearance in the gastrointestinal mucosa and extensive hepatic first pass metabolism. It acts by competitive inhibition of HMG-CoA reductase, hence; it prevents the conversion of HMG-CoA to mevalonate, an early rate-limiting step in the biosynthesis of cholesterol (Lennernas, 2003).
In this study, we prepared AVST loaded chitosan nanoparticles to improve the oral bioavailability of AVST. The usefulness of AVST loaded chitosan nanoparticles was evaluated by measuring its particle size and surface morphology, loading efficiency, drug release profile, and pharmacokinetics parameters in rabbits to fully characterize the system.
MATERIAL AND METHODS
Drug-excipient compatibility study by FT-IR spectroscopy (Ahmed, Nath, 2014)
F T- I R s p e c t r a w e r e r e c o r d e d o n a B r u k e r spectrophotometer (Model-220, Germany) using KBr discs in the range of 4000-450 cm-1. FT-IR analysis was
performed using sample of AVST with various excipients at 1:1 mass/mass ratio.
Preparation of drug loaded Chitosan nanoparticles
AVST loaded chitosan nanoparticles were prepared by the emulsion–diffusion–evaporation method (Yadav
et al., 2012) as per the composition shown in Table I. In
brief, 10 mg of AVST and 10-50 mg of chitosan (1:1 to 1:5, drug to polymer ratio) were dissolved in 20 ml of acetone-acetic acid mixture (1:2 ratio) at room temperature for 2 h. The organic phase was then added to 50 ml of an aqueous phase containing Pluronic F68 (4% w/v) as stabilizer. The resulting primary o/w emulsion was stirred at 1000 rpm for 1 h and subsequently homogenized at 24,000 rpm for 5 min using a high-speed homogenizer (IKA T25 digital Ultra Turrax, Germany). To this emulsion, water was added with
constant stirring to facilitate diffusion and inally evaporate
the organic solvent. This resulted in polymer precipitation and formation of nanoparticles. Free drug and surfactant were separated by centrifuging (REMI cooling centrifuge, Vasai) the drug loaded nanoparticles at 10,000×g for 20 min.
Characterization of nanoparticles
Particle size and zeta potential (Patil et al., 2009)
Hydrodynamic diameter and zeta potential of nanoparticles were determined using Zetasizer Nano ZS 90 dynamic light scattering equipment (Malvern Instruments Ltd. UK). Nanoparticles (~1 mg/mL) were dispersed in distilled water using sonication prior to particle size and zeta potential determinations. Mean hydrodynamic diameters were calculated based on size distribution by
TABLE I - Composition of AVST nanoparticles
F. No. AVST (mg) chitosan (mg) Pluronic F68 (mg) Acetone-acetic acid mixture
(1:2 ratio) mL
Distilled water (mL)
F1 10 10 2 20 50
F2 10 20 2 20 50
F3 10 30 2 20 50
F4 10 40 2 20 50
F5 10 50 2 20 50
weight, assuming a lognormal distribution, and the results
were expressed as mean ± S.D. of ive runs. Zeta potential
values were calculated from measured velocities, and
results were expressed as mean ± S.E.M. of ive runs.
Encapsulation efficiency (Zhu et al., 2010)
Loading of AVST in chitosan nanoparticles were determined by extracting 5 mg nanoparticles with 1 mL acetone for 6 h. From this solution 0.2 mL was diluted with phosphate buffer pH 6.8 and analyzed by UV spectrophotometer (Shimadzu UV-1800, Japan) at 264 nm against appropriate blank. Drug loading and encapsulation
eficiency were calculated by using equation Eq. (1) and
Eq. (2) respectively:
% Drug Loading =
Amount of drug in nanoparticles (mg)
Amount of nanoparticles (mg)
Eq. (1)
% Entrapment Ef ciency =
Amount of drug in nanoparticles (mg)
Initial mount of drug (mg)
Eq. (2)
In vitro release (Wilson et al., 2008)
Drug release from nanoparticles was determined in 0.1 N HCl and phosphate buffer pH 6.8 at 37 °C. Nanoparticle suspension (1 mg/mL, 0.5 mL) was placed in a dialysis tube (cellulose membrane, Sigma Chemical Company, USA) and immersed in 10 mL of the release buffer in a 15-mL centrifuge tube and shaken in an incubator shaker set at 100 rpm. At predetermined time intervals, 1 mL of the buffer solution was removed from the tube and analyzed for drug content by UV spectrophotometer (Shimadzu UV-1800, Japan) at 264 nm against appropriate blank.
Kinetic analysis of the release data
by various math ematical models described elsewhere (Ghosal; Ray, 2011). These models were applied taking into account the amount of drug released from 1 to 48 hours at different intervals as determined in release studies in-vitro. Various equations employed in this study
were zero-order model; irst order model, Higuchi square
root equation and Korsmeyer–Peppas model due to their simplicity and appli cability (Ghosal, et al., 2012; Li, et
al., 2006).
The mathematical expressions for the semi-empiri-cal models are as follows:
Qt = K0t + C0 Eq. (3)
Qt = KH√t + CH Eq. (4)
lnQt = ln Q0 + Kt Eq. (5)
where Qt is the cumulative percentage amount of drug released at time t, Q0 is the initial amount of drug in nanoparticles, K0, KH, Kt, are release rate constants, and C0, CH are the respective y-intercepts in the absorbance vs. time curve. Korsmeyer–Peppas model was used
speciically to explore release mechanisms and the fraction
of drug release (Eq. 6) (Korsmeyer et al., 1983).
(Mt/M∞) = ktn Eq. (6)
where k is a constant incorporating the structural and geometric characteristics of the matrix tablets, n is the release exponent, indicative of the drug release mechanism and (Mt/M∞) represents the drug dissolved fraction at time t. To clarify the release exponent for different formulations, the log value of the percentage drug released was plotted against log time according to Eq. (7).
Log (Mt/M∞) = log k + n log t Eq. (7)
During the Korsmeyer–Peppas model fitting, we obtained the value of the release exponent n, which conveys information on whether the release mechanism is Fickian, non-Fickian or case II transport mechanism. In this context, n=0.5 indicates Fickian release (diffusion controlled release) and n=1 indicates a purely relaxation-controlled delivery, which is referred to as case II transport. When the value of n is intermediate, it indicates an anomalous behaviour (non-Fickian kinetics corresponding to coupled diffusion/polymer relaxation). A value of n>1 indicates super case II kinetics.
Scanning electron microscopy (SEM) of nanoparticles
The shape and surface characteristics of the nanoparticles were observed by scanning electron
microscopy (SEM). The nanoparticle sample was thinly sprinkled onto a metal stub and vacuum coated with a thin layer of gold in an argon atmosphere. The SEM photomicrographs of the coated particles were obtained at 15 kV using a ZEISS, Germany, scanning electron microscope (Thangaraja, Savitha, Jegatheesan, 2010).
Pharmacokinetics studies
T h e s t u d y w a s c a r r i e d o u t t o c o m p a r e t h e pharmacokinetics parameters of AVST from a prepared nano formulation (F5) to a conventional commercially available immediate release tablet formulation (Atorva®, 10) following oral administration of doses 2.4 mg/kg in two groups of animals (five in each group). The study was approved by Institutional Animal Ethics Committee of Girijananda Chowdhury Institute of Pharmaceutical Science; vide no. 1372/c/10/CPCSEA.
The animals used for study were male albino rabbits weighing about 1.5-2 kg, obtained from Animal House of Girijananda Chowdhury Institute of Pharmaceutical Science, Guwahati, India. The animals were kept under standard laboratory conditions at a temperature of 25 ± 2 °C and relative humidity (55 ± 5%). The animals were divided into two groups as Group-I and Group-II. Each rabbit of Group- I was given marketed formulation dose (2.4 mg/kg) according to their weight using oral feeding needle. Same dose of nanoparticle suspension was administered to Group-II animals. About 0.5 mL of blood samples were collected from orbital sinus at interval of 0.5, 1, 1.5, 2, 2.5, 3, 4, 6, 8, 10, 12 and 24 hr into microfuse tube containing 15 µL Sodium Citrate (3.3% w/v) solution for each sample and centrifuged at 5000 rpm for 15 min at 4 ºC to separate plasma. The separated plasma samples were frozen at -20 ºC till analysis.
Plasma sample analysis
Then 200 µL of each plasma sample was taken into a 5 mL centrifuge tube and 50 µL of amlodipine besylate (AMDP) solution (50 µ g/mL) was added as an internal standard (IS) and the mixtures were vortexed for 30 s. After that, 2 mL acetonitrile was added into the mixture, vortexed for additional 2 min and centrifuged at 10,000 rpm for 10 min. The supernatant was transferred into a glass centrifuge tube and evaporated to dryness at 45 ºC under a stream of nitrogen. The residue was reconstituted with 200 µ L of reconstitution solvent (mobile phase).
The samples were iltered through 0.45 µm membrane
The HPLC system consisted of a Dual pump, (Model M515, Waters corp., USA) and UV-Visible detector (Model M2489, Waters corp., USA) set at a wavelength of 264 nm. The samples were chromatographed on a reverse phase NOVA-PAK HR C18 column (4 µm, 150 × 3.9 mm, Ireland). The mobile phase consisting of acetonitrile and 0.05 M ammonium acetate solution in the ratio of 45:55 (v/v) with an apparent pH 6.09 was filtered through a 0.45 µ m membrane filter and degassed under vacuum
before use. It was pumped at a low rate of 1.5 mL/min for
the run time of 10 min under these experimental conditions with an injection volume of 20 µL of the sample solution (Rheodyne Injector, Model 7725i) (Waters corp. USA). The amount of drug present in 200 µL of plasma [(quantity obtained from regression equation/200) x 1000)] was calculated.
Extraction efficiency and validation of bio-analytical methods
For recovery of drug from plasma different organic extraction solvents (ethyl acetate, acetonitrile and methanol) were tried in the experiment and acetonitrile was proved to be the most efficient in extracting AVST from rabbit plasma and had a small variation in extraction recoveries over the concentration range. Spiked plasma sample was prepared in triplicate at single concentration of 30 µg/mL of AVST and 50 µg/mL of IS, and assayed as described
above. The extraction eficiency of AVST was determined
by com- paring the peak areas measured after analysis of spiked plasma sample with those found after direct injection of non-biological (unextracted) samples into the chromatographic system at the same concentration levels.
The bio-analytical method was validated for specificity, recovery, linearity and precision. The
speciicity of the method was determined by comparing
the chromatograms obtained from the solution of AVST and IS with those from blank plasma. Linearity of the calibration curve was determined by taking nine different concentrations (0.2 -50 µ g/mL) of AVST with fixed concentration of IS (50 µ g/mL) in blank plasma. The calibration curve was plotted between the ratio of peak areas of AVST to IS and concentration of AVST. Both repeatability (within a day precision) and reproducibility (between days precision) were determined. Four quality control samples were subjected for the study. Five injections of each of the specified quality control samples were injected for analysis within the same day for repeatability, and over a period of 5 days for reproducibility. The relative standard deviations (RSD)
and percent coeficient of variation (%CV) were calculated
and used to predict the precision of the method.
Determination of pharmacokinetics parameters
The pharmacokinetic parameters were determined from the data of plasma drug concentration at different time points by using MS-Excel 2003 software according to the procedure described elsewhere (Jambhekar, Breen, 2009; Bourne, 2001).
Data and statistical analysis
Data are represented as mean ± SD (n=5). Statistical comparisons were made using one-way analysis of variance (ANOVA). A value of p<0.05 was considered
statistically signiicant. All data processing was performed
using the SPSS® statistical software program (SPSS® 14,
Microsoft, USA).
RESULTS AND DISCUSSION
FT-IR analysis of drug–excipients mixture
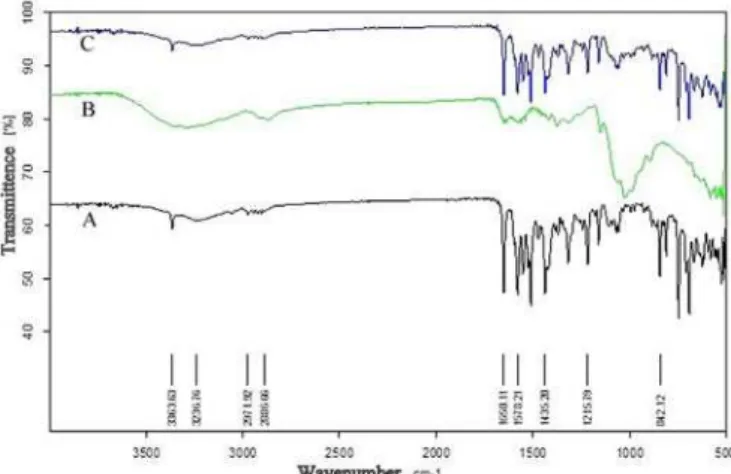
FT-IR spectroscopy study was carried out to test the compatibility of AVST with chitosan and Pluronic F68 used as polymer and stabilizer in the formulation. FT-IR spectra of AVST showed presence of characteristics band at 3362 cm-1for(-OH), 3236 cm-1 for (-NH), 2971 cm-1
for (-CH3), 2824 cm-1 for(-CH aromatic), 1649 cm-1 for
(C=O), 1578 cm-1 for (C-N), and 1432 cm-1 for (C-C)
functional groups. All these characteristics bands were also retained in 1:1 physical mixture of AVST-chitosan and AVST-Pluronic F68 showed in Figure 1. The results clearly revealed the incompatibility of drug with the excipients used in the formulation.
Physico-chemical characterization of AVST loaded nanoparticles
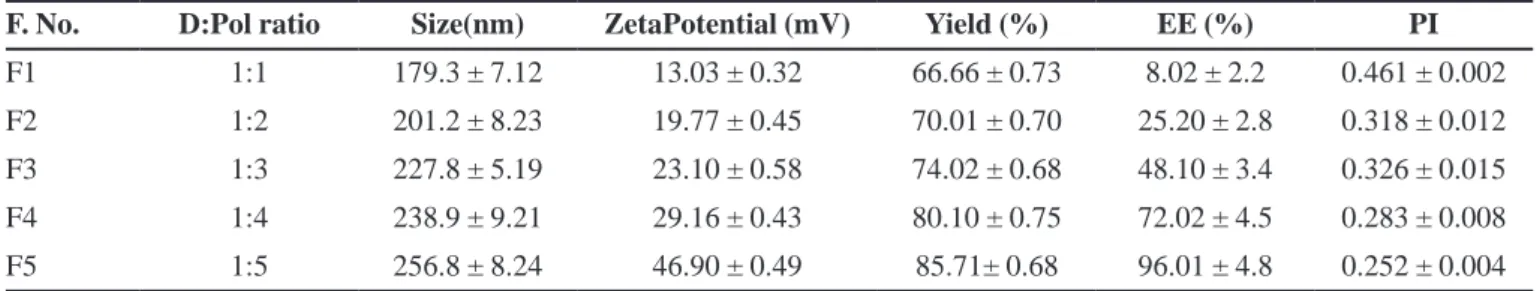
The Physico-chemical characteristics of AVST-loaded chitosan nanoparticles were summarized in Table II. The result showed the high yield of nanoparticle i.e. 66.66±0.73 to 85.71±0.68%. The average loading of AVST in nanoparticles were about 4±1.1%, 9±1.0%, 13±0.92%, 15±0.93%, 16±0.80% and encapsulation efficiency of 8.02±2.2%, 25.2 ± 2.8%, 48.10 ± 3.4%, 72.02 ± 4.5%, 96.01 ± 4.8% in formulation F1, F2, F3, F4, F5 respectively. The average loading and encapsulation
eficiency in the formulations were found to be increase
with increase in polymer concentration used in the formulations. A maximum of 16 ± 0.80% drug loading and 96.01±4.8% entrapment efficiency was observed at 1:5, drug to polymer ratio in formulation F5, the change in drug loading may be due to the poor aqueous solubility and high binding capacity of drug on polymer surface in organic solvent used in the nanoparticle formulation.
The result showed the average size of prepared nanoparticles varied from 179.3±7.12 to 256.8±8.24 nm with a polydispersity index (PI) in the range of 0.461±0.002 to 0.252±0.004 as shown in Table II. Size of nanoparticle was increased with increase in polymer concentration. Nevertheless, the PI was found to be always lower than 0.5, which is considered as an evidence of a homogeneous nanoparticle formulation. On the other hand, in all the AVST-loaded nanoparticles formulations had zeta potential value of 13.03±0.32 to 46.9±0.49 mV. The net positive surface charge of all formulations may be due to the use cationic polyelectrolyte (chitosan) and the addition of Pluronic F68 in the formulation aids to reduce aggregation of nanoparticles may results the stability of the formulations. The average droplet of the selected formulation F5 by dynamic light scattering determination was 46.9±0.49 mV (Figure 2).
TABLE II - Physico-chemical characterization of AVST-loaded chitosan nanoparticles
F. No. D:Pol ratio Size(nm) ZetaPotential (mV) Yield (%) EE (%) PI
F1 1:1 179.3 ± 7.12 13.03 ± 0.32 66.66 ± 0.73 8.02 ± 2.2 0.461 ± 0.002 F2 1:2 201.2 ± 8.23 19.77 ± 0.45 70.01 ± 0.70 25.20 ± 2.8 0.318 ± 0.012 F3 1:3 227.8 ± 5.19 23.10 ± 0.58 74.02 ± 0.68 48.10 ± 3.4 0.326 ± 0.015 F4 1:4 238.9 ± 9.21 29.16 ± 0.43 80.10 ± 0.75 72.02 ± 4.5 0.283 ± 0.008 F5 1:5 256.8 ± 8.24 46.90 ± 0.49 85.71± 0.68 96.01 ± 4.8 0.252 ± 0.004
Data expressed as the mean ± SD (n=3). EE: Encapsulation eficiency PI: Polydispersity Index D: Pol (Drug: Polymer).
FIGURE 2-AVERAGE zeta potential of the formulation F5 containing 1:5 ratio of drug to polymer measured by dynamic light scattering method.
FIGURE 3 - In vitro drug release proile for different formulations in 0.1 N HCl.
In vitro drug release studies
In vitro release profiles of AVST loaded chitosan
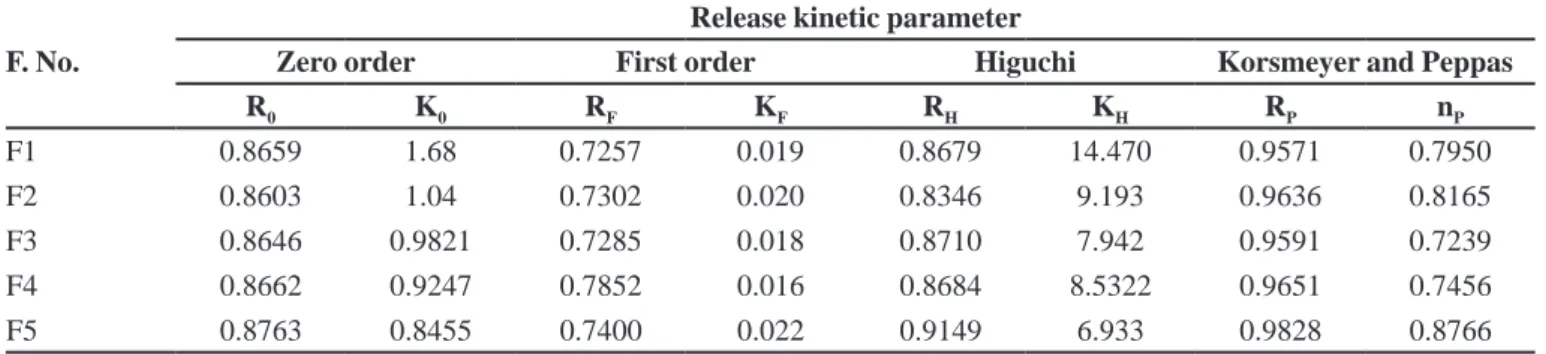
TABLE III - Comparative release kinetics parameter of all the batches of nanoparticles
F. No.
Release kinetic parameter
Zero order First order Higuchi Korsmeyer and Peppas
R0 K0 RF KF RH KH RP nP
F1 0.8659 1.68 0.7257 0.019 0.8679 14.470 0.9571 0.7950 F2 0.8603 1.04 0.7302 0.020 0.8346 9.193 0.9636 0.8165 F3 0.8646 0.9821 0.7285 0.018 0.8710 7.942 0.9591 0.7239 F4 0.8662 0.9247 0.7852 0.016 0.8684 8.5322 0.9651 0.7456 F5 0.8763 0.8455 0.7400 0.022 0.9149 6.933 0.9828 0.8766
FIGURE 4 - In vitro drug release proile for different formulations in Phosphate buffer pH 6.8.
due to the hydration ability of chitosan, which on coming in contact with dissolution media leads to the formation of gelatinous mass and act as retardant material for the drug to diffuse out. Thus a prolonged release of drug is attained and at the end of 48 hours, the cumulative % drug release from formulations F1, F2, F3, F4, F5 was 95.04±0.48, 64.6±0.52, 58.94±0.56, 52.54±0.52, 44.62±0.32 in 0.1N Hydrochloric acid and 95.24±0.38, 94.6±0.44, 88.54±0.54, 82.1±0.54, 74.12±0.28 in Phosphate buffer pH 6.8 respectively. Thus F5 formulation contained higher percentage of polymer (1:5, Drug: polymer ratio) was able to sustain the release of drug for long period of time (more than 48 h) compared to other formulations in 0.1 N hydrochloric acid medium.
Kinetics and mechanism of drug release
The in vitro drug release data was fitted into
appropriate equations, the correlation coeficient (R) and
the release rate constant was determined from the slope of the respective equations for all formulations (Table III).
Among all the formulations F5 found to be best itted in
Higuchi kinetics with RH value of 0.9149, followed by zero order (RO=0.8763) and irst order (RF=0.7400) kinetics.
This explains that drug release from the nanoparticle formulations followed primarily diffusion controlled
release mechanism. Further, to conirm the drug release
mechanism from the nanoparticle formulations the in
vitro drug release data at various time points were itted
into the Korsemayer-Peppas equation. The correlation
coeficient (Rp values) of 0.9571, 0.9636, 0.9591, 0.9651
and 0.9828 for the formulations F1, F2, F3, F4 and F5 respectively which showed good linearity between log cumulative amount of drug release versus log time, and the highest linearity was observed with F5, where drug to polymer concentration was maximum (1:5). The release exponents (nP values) were found to be 0.7950, 0.8165, 0.7239, 0.7456 and 0.8766 for the formulations F1, F2, F3, F4 and F5 respectively. The obtained nP values of all the formulations were greater than 0.5 and less than 1. Hence, it is revealed that the mechanism of drug release was a non-Fickian or anomalous diffusion.
Surface morphology
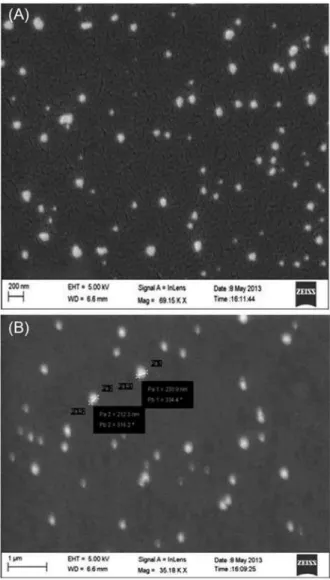
Particle images obtained by SEM from F5 samples, as shown in Figure 5, indicated that produced nanoparticles were spherical in shape with smooth surface and the size of particles varied from 212.3 nm to 230.9 nm. No agglomeration and uniformly distribution of the particles
conirmed the stability of formulation. Magniication of
a single particle showed the internal cage like structure where the drug molecules are dispersed uniformly throughout the polymer matrix. The drug appeared as white spots on the surface. It was observed that when a high energy electron beam were passed to scan the particles in SEM, the polymer burns out leaving the drug particles viewed as a cage like structure.
Extraction efficiency and bio-analytical methods
acetate and methanol respectively at all three concentration levels, which confirmed the extraction efficiency of the solvents. Among the solvents, acetonitrile showed maximum amount of drug recovery. Hence, acetonitrile
was selected as the extracting solvent. The recovery of IS was also found to be maximum in acetonitrile which was 96.23% ± 2.2 (w/w).
Under the described conditions of the bio-analytical methods, the retention time of AVST and AMDP was found 3.0 and 2.2 min respectively (Figure 6). Absence of the interfering peaks near the retention time of the AVST as well as IS indicating the specificity of the method. The chromatographic responses (ratio of peak area of AVST to IS versus AVST concentration) were found to be linear over an analytical range of 0.2–50 µg/mL with regression coefficient value of 0.9977, which showed reproducibility. The relative standard deviation (RSD) and
percent coeficient of variation (%CV) of intra-day assay
of the drug was ranged from 0.0098 to 0.0326 and 0.98 to 3.26%; for the inter-day assay was from 0.0049 to 0.0297 and 0.49 to 2.97% respectively (Table IV). The low RSD and % CV indicate the precision of the method.
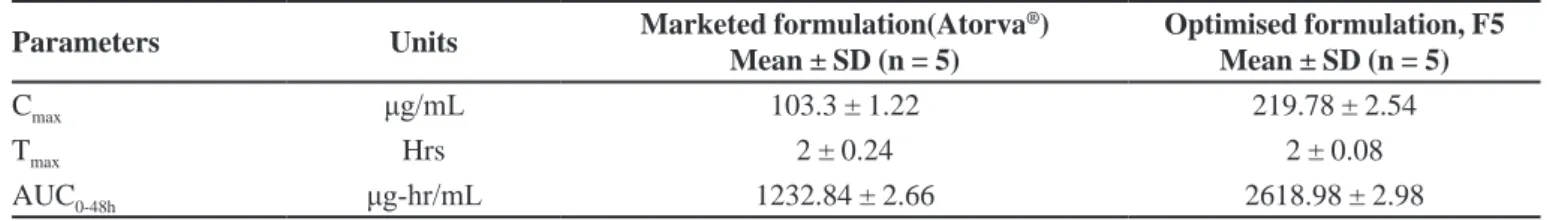
Pharmacokinetics parameters
The comparison of the different pharmacokinetic parameters was done by using a one-way analysis of variance (ANOVA). A value of p<0.05 was considered
statistically signiicant. The pharmacokinetics parameters
were derived from plasma drug concentrations versus
time proile of all the subjects and the results are shown
in Table V and Figure 7. From the pharmacokinetic study, it can be revealed that the optimised nanoparticle formulation, F5 showed better Cmax, Tmax and AUC than the marketed formulation (Atorva®) of drug. It was found that
the Cmax in plasma for optimised nanoparticle formulation
(219.78 μg/mL) represents greater improvement than the marketed formulations (103.3 μg/mL). It was
also observed that AUC0-48h of optimised nanoparticle
formulation was 2618.98 μg.hr/mL and thus the difference were highly signiicant (p<0.05) as compared to AUC0-48h
of marketed tablet suspension (Table IV) formulation.
The tmax of optimised nanoparticle formulation was
FIGURE 5 - SEM image of particles from F5 formulation
(A) Nanoparticles in spherical shape with smooth surface.
(B) Magniication of a single particle showed the internal cage
like structure of size 212.3 to 238.9 nm.
TABLE IV - Precision and accuracy of method for the estimation of AVST in rabbit plasma
Concentration (µg/mL)
Intra-day precision Inter-day precision
Mean ± SD (n = 5)
(µg/mL) RSD %CV
Mean ± SD (n = 5)
(µg/mL) RSD %CV
0.2 0.1988+0.0065 0.0326 3.26 0.1982+0.0059 0.0297 2.97 10 10.116+0.2060 0.0203 2.03 10.04+0.0894 0.0089 0.89 30 29.974+0.2962 0.0098 0.98 29.992+0.1392 0.0049 0.49 50 49.962+0.8064 0.0161 1.61 50.252+0.6157 0.0122 1.22
TABLE V – Pharmacokinetic parameters
Parameters Units Marketed formulation(Atorva
®)
Mean ± SD (n = 5)
Optimised formulation, F5 Mean ± SD (n = 5)
Cmax μg/mL 103.3 ± 1.22 219.78 ± 2.54
Tmax Hrs 2 ± 0.24 2 ± 0.08
AUC0-48h μg-hr/mL 1232.84 ± 2.66 2618.98 ± 2.98
FIGURE 6 - HPLC chromatogram of AVST and internal standard (AMDP) in rabbit plasma.
FIGURE 7 - Plasma concentration profiles of optimized
formulation (F5) and marketed formulation (Atorva®) after oral
administration in rabbits (mean ± SD, n = 5).
found to be similar when compared to tmax of marketed tablet suspension. The difference in Cmax of optimised
nanoparticle formulation was very signiicant (p<0.05)
when compared with the marketed tablet suspesion. It was also observed that AUC0-48h of optimised nanoparticle formulation was nearly 2.2 fold increase in the AUC for the nanoparticles as opposed to the pure drug (Atorva®).
Furthermore, this result suggested the iprovement of oral absorption of AVST in nanoparticle formulation, which may be due to the changes in gastrointestinal membrane
permeability of the drug and the inhibition of an apically
polarized eflux system.
CONCLUSION
In conclusion stable nanoparticles with positive zeta potential value between 13.03±0.32 to 46.90±0.49 mV and particle size range between 179.3 ± 7.12 to 256.8±8.24 nm of calcium atorvastatin was prepared successfully using solvent evaporation techniques. Nanoparticle size depends primarily on the excess of polymer added into the system and in vitro release study revealed the sustained release of drug for 48h. Results of pharmacokinetics study showed a
signiicant difference in the pharmacokinetics parameter
(2.2 fold increase in AUC) of the optimized formulation as compared to marketed formulation (Atorva®). Thus, the
developed nanoparticles evidenced the improvement of oral bioavailability of calcium atorvastatin in rabbit model.
ACKNOWLEDGEMENT
REFERENCES
AHMED, A.B.; NATH, L.K. Drug-excipients compatibility
studies of nicorandil in controlled release loating tablet. Int. J. Pharm. Pharm. Sci., v.6, n.2, p.468-475, 2014.
BALA, I.; HARIHARAN, S.; KUMAR, R. PLGA nanoparticles in drug delivery: the state of the art. Crit. Rev. Ther. Drug
Carrier Syst., v.21, n.5, p.387-422, 2004.
BOURNE, D.W. Pharmacokinetics. In: BANKER, G.S., RHODES, C.T. (Eds.). Modern pharmaceutics. 4. ed. New York: Marcel Dekker, 2001.
BUZEA, C.; PACHECO, I.; ROBBIE, K. Nanomaterials and nanoparticles: sources and toxicity. Biointerphases, v.2, n.4, p.MR17-MR71, 2007.
DAMGÉ, C.; VONDERSCHER, J.; MARBACH, P.; PINGET, M. Poly(alkyl cyanoacrylate) nanocapsules as a delivery system in the rat for octreotide, a long-acting somatostatin analogue. J Pharm Pharmacol., v.49, n.10, p.949-954, 1997a.
DAMGE, C.; VRANKX, H.; BALSCHMIT, P.; COUVREUR, p.Poly(alkylcyanoacrylate) nanospheres for oral administration of insulin. J Pharm Sci., v.86, n.12, p.1403-1409, 1997b.
DELIE, F.; BLANCO-PRIETO, M.J. Polymeric particulates to improve oral bioavailability of peptide drugs. Molecules, v.10, p.65-80, 2005.
FLORENCE, A.T.; HUSSAIN, n.Trancytosis of nanoparticle and dendrimer systems: evolving vistas. Adv. Drug Deliver.
Rev., v.50, p.S69-S89, 2001.
GHOSAL, K.; RAY, S.D. Alginate/hydrophobic HPMC (60M) particulate systems: new matrix for site-specific and controlled drug delivery. Braz. J. Pharm. Sci., v.47, n.4, p.833-844, 2011.
G H O S A L , K . ; C H A N D R A , A . ; R A J A B A L AYA , R.; CHAKRABORTY, S.; NANDA, A. Mathematical
modeling of drug release proiles for modiied hydrophobic
HPMC based gels. Pharmazie, v.67, n.2, p.147-155, 2012.
HANS, M.L.; LOWMAN, A.M. Biodegradable nanoparticles for drug delivery and targeting. Curr. Opin. Solid St.
Materials Sci., v.6, n.4, p.319-323, 2002.
HUSSAIN, N.; JAITELY, B.; FLORENCE, A.T. Recent advances in understanding the uptake of microparticulates across the gastrointestinal lymphatics. Adv. Drug Deliver
Rev., v.50, n.1-2, p.107-142, 2001.
JAMBHEKAR, S.S.; BREEN, P.J. Extravascular route of
drug administration in basic pharmacokinetics. London:
Pharmaceutical Press, 2009. p.106-126.
KORSMEYER, R.W.; GURNY, R.; DOELKER, E.; BURI, P.; PEPPAS, N.A. Mechanism of solute release from porous hydrophilic polymers. Int. J. Pharm., v.15, n.1, p.25-35, 1983.
KREUTER, J. Peroral administration of nanoparticles. Adv.
Drug Deliver Rev., v.7, n.1, p.71-86, 1991.
LENNERNAS, H. Clinical pharmacokinetics of Atorvastatin.
Clin. Pharmacokinet., v.42, n.13, p.1141-1160, 2003.
LI, S.; SHEN, Y.; LI, W.; HAO, X.A. Common profile for polymer-based controlled release and its logical interpretation to general release process. J. Pharm. Pharm.
Sci., v.9, n.2, p.238-244, 2006.
LI, Y.; JANG, H.L.; JIN, J.E. Bioadhesive fluorescent microspheres as visible carriers for local delivery of drugs. II: uptake of insulin-loaded PCEFB/PLGA microspheres by the gastrointestinal tract. Drug Deliv., v.11, n.6, p.335-340, 2004.
NISHIOKA, Y.; YOSHINO, H. Lymphatic targeting with nanoparticulate systems. Adv. Drug Deliver Rev., v.47, n.1, p.55-64, 2001.
PATIL, Y.; SADHUKHA T.; MA L., PANYAM, J. Nanoparticle-mediated simultaneous and targeted delivery of paclitaxel and tariquidar overcomes tumor drug resistance. J. Control.
Release, v.136, n.1, p.21-29, 2009.
PINTO-ALPHANDARY, H.; ABOUBAKAR, M.; JAILLARD, D.; COUVREUR, P.; VAUTHIER, C. Visualization of insulin loaded nanocapsules: in vitro and in vivo studies after oral administration to rats. Pharm. Res., v.20, n.7, p.1071-1084, 2003.
THANGARAJA, A.; SAVITHA, V.; JEGATHEESAN, K. Preparation and Characterisation of Polyethylene glycol coated silica nanoparticles for drug delivery application.
IJNA, v.4, n.1, p.31-38, 2010.
WILSON, B.; SAMANTA, MK.; SANTHI, K.; KUMAR, KPS.; PARAMAKRISHNAN, N.; SURESH, B. Targeted delivery of tacrine into the brain with polysorbate 80 coated poly (n-butylcyanoacrylate) nanoparticles. Eur. J. Pharm.
Biopharm, v.70, n.1, p.75-84, 2008.
YADAV, H.K.S.; NAGAVARMA, B.V.N.; AYAZ, A.; VASUDHA, L.S.; SHIVAKUMAR, H.G. Different techniques for preparation of polymeric nanoparticles- a review. Asian J. Pharm. Clin. Res., v.5, n.3, p.16-23, 2012.
YELLELA, S.R.K. Pharmaceutical Technologies for enhancing oral bioavailability of poorly soluble drugs. J. Bioequiv.
Availab., v.2, n.2, p.28-36, 2010.
ZHU, Z.; LI, Y.; LI, X.; LI, R.; JIA, Z.; LIU, B.; GUO, W.; WU, W.; JIANG, X. Paclitaxel loaded poly
(n-vinylpyrrolidone)-b-poly(ԑ-caprolactone) nanoparticles: Preparation and
antitumor activity in vivo. J. Control. Release, v.142, n.3, p.438-446, 2010.
Received for publication on 11th July 2014