ABSTRACT:Objective: To evaluate the changes in commuting to work and physical activity (PA) in the
population of three municipalities in the São Paulo region in 2000 and 2010. Methods: Cross-sectional study with a representative sample of 602 adults (62.3% men) carried out in the municipalities of Santo André, São Bernardo do Campo and São Caetano do Sul in 2000 (n = 304; 66.1% men) and 2010 (n = 298; 58.4% men). Physical activity was assessed by the International Physical Activity Questionnaire and participants were classiied into active (≥ 150 min/week) and insuiciently active (< 150 min/week). The commuting to work was classiied in active transport (walking and cycling), private (bike, car, vans and buses) and public (buses, vans, train or subway). Results: Average (min/week) PA walk (229.4 versus 190.6), moderate (449.1 versus 347.4), vigorous (354.4 versus 317.4) and total (552.3 versus 442.5) shows the participants were greater in 2010 than in 2000. The prevalence assets increased from 62.2 to 78.2%, respectively. A negative relationship was found between active transport and public with socioeconomic status; active transport and education level; public transport and age. Positive relationship was found only among private transport and socioeconomic status. The average of the total PA (min/week) was higher (p = 0.024; 32.2%) in 2010 than in 2000 for active transport. Conclusions: Surveillance data in full PA in the three municipalities of São Paulo indicate that the average active commuting to work increased after ten years, while public transport has decreased.
Keywords: Motor activity. Epidemiology. Health surveys. Risk factors. Developing countries.
Changes in commuting to work and physical
activity in the population of three municipalities
in the São Paulo region in 2000 and 2010
Mudanças no deslocamento para o trabalho e na atividade física da
população de três municípios da região de São Paulo nos anos de 2000 e 2010
Josivaldo de Souza LimaI,II, Gerson Luis de Moraes FerrariI, Tatiane Kosimenko FerrariI,
Timóteo Leandro AraujoI, Victor Keihan Rodrigues MatsudoI ORIGINAL ARTICLE / ARTIGO ORIGINAL
IStudy Center of the Physical Fitness Laboratory of São Caetano do Sul – São Caetano do Sul (SP), Brazil. IISchool of Medical Sciences, Santa Casa de São Paulo – São Paulo (SP), Brazil.
Corresponding author: Josivaldo de Souza Lima. Rua Heloísa Pamplona, 269, sala 31, Fundação, CEP: 09520-320, São Caetano do Sul, SP, Brasil. E-mail: [email protected]
INTRODUCTION
The maintenance of physical activity (PA) is responsible for an improvement in cardio-vascular health, providing protection against the development of comorbidities such as hypertension, diabetes, vascular and cardiac diseases, among others1. Worldwide, its absence
is estimated to contribute between 21 and 25% with the global burden of diseases such as breast and colon cancer; in even greater proportions, it contributes to diabetes (27%) and to ischemic heart disease (30%)2. In addition, 31% of the world’s adult population is estimated
not to have achieved the recommended PA for health3.
Considered as little susceptible to interventions from public policies in
domes-tic and work environments4 and stabilized for over two decades as being performed
during periods of free time5, strategies that promote the increase of PA time in the
transportation domain have been receiving increased attention over the world6,7. Also,
its increase in the transportation domain is noteworthy, contributing to an increase in its total time, collaborating so that adults meet the PA recommendations in terms of public health8.
Besides contributing to the increase of the total PA practice9, active transportation (by
bicycle or on foot) is also associated to other health aspects, such as the prevention and treat-ment of cardiovascular diseases, some types of cancer, mortality due to all general causes and body weight control10. On the other hand, the increasing use of passive transportation
(public: bus, subway, or train; private: car or motorcycle) as the main means of commuting
RESUMO:Objetivo:Veriicar as mudanças no deslocamento para o trabalho e na atividade física (AF) na população de três municípios da região de São Paulo nos anos 2000 e 2010. Métodos: Estudo de coorte transversal com amostra representativa de 602 adultos (62,3% homens), realizado nos municípios de Santo André, São Bernardo do Campo e São Caetano do Sul nos anos 2000 (n = 304; 66,1% homens) e 2010 (n = 298; 58,4% homens). A AF foi analisada pelo Questionário Internacional de Atividade Física e os participantes foram classiicados em ativos (≥ 150 min/ sem) e insuicientemente ativos (< 150 min/sem). O deslocamento para o trabalho foi rotulado em transporte ativo (a pé e bicicleta), privado (moto, carro, vans e ônibus) e público (ônibus, vans, trem ou metrô). Resultados:
As médias (min/sem) de AF de caminhada (229,4 versus 190,6), moderada (449,1 versus 347,4), vigorosa (354,4 versus 317,4) e total (552,3 versus 442,5) dos participantes foram maiores em 2010 do que em 2000. A prevalência de ativos aumentou de 62,2 para 78,2%, respectivamente. Foi encontrada relação negativa entre transporte ativo e público com nível socioeconômico; transporte ativo e grau de escolaridade; transporte público e faixa etária. Relação positiva foi veriicada somente entre transporte privado e nível socioeconômico. A média da AF total (min/sem) foi maior (p = 0,024; 32,2%) em 2010 do que em 2000 para o transporte ativo. Conclusão: Os dados de vigilância em AF total nos três municípios de São Paulo indicam que a média do transporte ativo para o trabalho aumentou após dez anos, enquanto o transporte público diminuiu.
has been causing serious problems in the urban transportation system, such as traic jams11,
air and sound polution12. Thus, active commuting has been considered a great alternative
to minimize such environmental11 and health problems12.
Brazil, as well as other emerging economies, has been fast changing in terms of urban-ization and transportation over the last few years13. In this context, one of the most notable
changes is the public and private means of transportation. As a result, there was an increase in the incidence of traic-related deaths, in the prevalence of respiratory diseases and in the levels of stress14,15. Another negative efect is the increased physical inactivity due to the
lower PA values obtained through transportation16.
The evidence available in low and medium income countries show that walking and cycling are more prevalent among men and low income groups17,18. In communities in the
United States, walking is more prevalent among women19. In Brazil, only 17% of people
use a bicycle as a means of transportation and only 8% consider it as their main means of transportation in the city20. Therefore, a better understanding of the prevalence of adults
using diferent means of transportation and of PA over the years is necessary, once that many initiatives are being developed, such as the city gym and the bike lane21. This study
aimed to verify the changes in commuting to work and PA of the population in three loca-tions in 2000 and 2010.
METHODS
Since 1984, the Research Institute of Universidade de São Caetano do Sul coordinates the ABC Socioeconomic Research for the regional group comprising the municipalities of Santo André (704,942 inhabitants), São Bernardo do Campo (811,489 inhabitants) and São Caetano do Sul (156,362 inhabitants), all located in the state of São Paulo. This research is conducted annually from a sampling survey of households22.
The article includes the results of the cross-sectional research for 2000 and 2010. For each survey, about 602 households were selected using the probabilistic random sampling technique. First, the postal codes (Códigos de Endereçamento Postal – CEP) of the municipal-ities were organized in ascending order. Next, the households were systemically selected. Finally, in each household selected, one resident older than 18 years of age was chosen using a random approach. All residents aged older than 18 years of age were initially con-sidered eligible. Individuals who were unable to answer to the questionnaire were excluded and, in all surveys, participants were approached in their households. The error estimated in each survey for the results obtained was 3.0% for a 95.5% conidence interval. In case of refusal of participation, the following household was selected for the research. Previously trained professionals performed all data collection. The project was approved by the Ethics Committee of Santa Casa Hospital, in São Paulo, under protocol 2015/06. The participants signed the Informed Consent.
women. In 2010, 349 (58.2%) residents took part in the questionnaire on means of commut-ing, 54.4% (190) men and 55.6% (159) women aged older than 18 years of age.
The instrument used to measure the PA of walking, at moderate and vigorous intensity, was the International Physical Activity Questionnaire (IPAQ), in its short version, duly tested and validated in the adult Brazilian population23. It was applied as an individual interview
with an explanation of all questions for better understanding. PA practice was measured based on the answers to the IPAQ questionnaire, which consisted of questions about the frequency and duration of the activities in diferent domains. For each one of the domains evaluated, scores were determined by multiplying the weekly frequency by the time of duration in days on which the PA was carried out. The questions in the questionnaire were related to walking at moderate and vigorous intensity for at least ten minutes the week prior to its application.
In the present study, participants were classiied into active and insuiciently active, based on the recommendation of PA for adults24. In order to be considered active, they should
carry out ≥ 150 min/week of PA; and in order to be considered insuiciently active, < 150 min/week.
As a means of commuting, we considered active (on foot or by bicycle), private (motor-cycle, car, van and bus, either carpooling or company car) and public transportation (bus, van, train or subway). The way of commuting to work (self-reported) of the participants of the research was known through their answer to the following question: What is the main means of transportation you use to go to work? This question was made for each of the means of transportation considered in the present study22.
The variables of gender, age range, socioeconomic level (SEL) and education were also considered for the analyses. The age range was categorized into four groups: 18 to 29, 30 to 44, 45 to 60 and > 60 years of age. The Brazilian Socioeconomic Classiication ques-tionnaire25 was used to classify the SEL. Brazil’s Economic Classiication Criterion takes
into account the score system and the education degree of the head of the household. The former identiied the possessions and the number of items considered “assets” in the household, those being between zero and four or more. The latter presents the education degree and goes from illiterate (zero points) and complete higher education (eight points). After scoring and identiication, the SEL is calculated and classiied between “A1” and “E”, according to the cutof points of Brazil’s Criterion25. Participants were classiied into three
groups: A+B (high), C (intermediate) and D+E (low). The degree of education was mea-sured according to: ≤ 8, 9 to 11 and ≥ 12 years of study. All questions were exactly the same within the diferent years of evaluation.
STATISTICAL ANALYSIS
In 2000 and 2010, the proportion and their respective 95% conidence interval (95%CI) was estimated for each means of commuting to work (active, private, and public trans-portation) according to age, SEL, education, gender, and PA. The variation between 2010 and 2000 was assessed by delta percentage (Δ%), the calculations were performed by the Statistical Package for the Social Sciences (SPSS) software, version 20.0, and the signiicance level adopted was p < 0.0526.
RESULTS
The sample analyzed included 602 participants, 375 (62.3%) males. The descriptive statis-tic of the results is presented in Table 1, and no signiicant diferences were found between the frequencies of gender and age in the periods evaluated (2000 and 2010). In both cases, most of the sample was male, aged between 10 and 34 years old and of intermediate socio-economic level. Regarding education, most of the sample had ≤ 8 years of study in 2000 and ≥ 12 in 2010 (Table 1).
The mean PA for walking at moderate and full intensity were statistically higher in 2010. Besides, the prevalence of active individuals showed a signiicant increase from 62.2% in 2000 to 78.2% in 2010 (Table 1).
In relation to commuting to work, the proportion of individuals using active transpor-tation increased from 17.8 to 24.2% in a 10-year period. On the other hand, the proportion using public transportation to go to work decreased from 35.9 to 23.8% (Table 1).
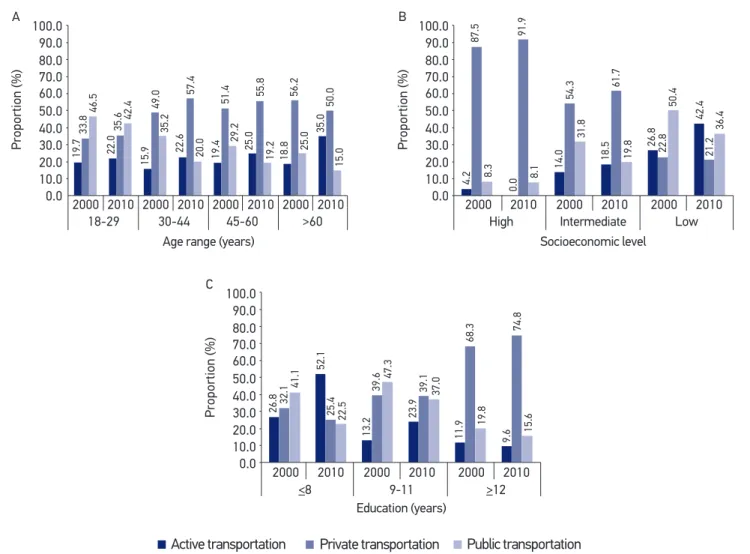
Figure 1 presents the diferent means of commuting to work according to age range, SEL and education.
In all age ranges, there was an increased proportion of individuals using active and pri-vate transportation, and decreased proportion of those using public transportation between 2000 and 2010. In the range of 18 to 29 years, most individuals used public transportation in 2000 and 2010. However, in other age ranges (30 to 44, 45 to 60 and > 60), the private transportation was the most often one used in both periods. In addition, the results showed a negative relation between age range and commuting to work via public transportation, considering that the older the individual is, the lesser it is used (Figure 1A).
Regarding education, an increase in the proportion of individuals using active trans-portation when commuting to work was observed among those with < 8 and 9 to 11 years of study, as well as a decrease among the ones with ≥ 12 years between 2000 and 2010. The use of private transportation recorded a decrease among those with < 8 and 9 to 11 years of study; and an increase between those with ≥ 12 years of study. The use of public transportation had an increase among those who had < 8 years of study and
Table 1. Descriptive analysis (mean [SD] or n [%]) of the sample according to the period evaluated: 2000 and 2010.
Variables 2000 (n = 304)
n (%)
2010 (n = 298)
n (%) p-value
Gender
Male 201 (66.1) 174 (58.4)
0.050*
Female 103 (33.9) 124 (41.6)
Age (years)
18 to 29 71 (23.4) 59 (19.8)
0.013*
30 to 44 145 (47.7) 115 (38.6)
45 to 60 72 (23.7) 104 (34.9)
> 60 16 (5.3) 20 (6.7)
Socioeconomic level
High 48 (15.8) 37 (12.4)
0.014* Intermediate 129 (42.4) 162 (54.4)
Low 127 (41.8) 99 (33.2)
Education (years)
≤ 8 112 (36.8) 71 (23.8)
0.001*
9 to 11 91 (29.9) 92 (30.9)
≥ 12 101 (33.2) 135 (45.3)
Physical activity min/week
Walking 190.6 ± 190.3 229.4 ± 192.6 0.045**
Moderate 347.4 ± 312.7 449.1 ± 341.0 0.003**
Vigorous 317.4 ± 293.6 354.4 ± 293.5 0.369**
Total 442.5 ± 328.3 552.3 ± 338.9 0.001**
Recommended physical activity
Active 189 (62.2) 233 (78.2)
< 0.001* Insuiciently active 115 (37.8) 65 (21.8)
Commuting to work
Active transportation 54 (17.8) 72 (24.2)
0.004** Private transportation 141 (47.4) 155 (52.0)
Public transportation 109 (35.9) 71 (23.8)
Figure 1. Proportion of participants who use diferent means of commuting to work according to age range, socioeconomic level and education in three municipalities in the region of São Paulo in 2000 and 2010.
Public transportation
Age range (years) Socioeconomic level
High Intermediate Low 18-29 30-44 45-60 >60
A Proportion (%) 100.0 90.0 80.0 70.0 60.0 50.0 40.0 30.0 20.0 10.0 0.0 C Proportion (%) 100.0 90.0 80.0 70.0 60.0 50.0 40.0 30.0 20.0 10.0 0.0 B Proportion (%) 100.0 90.0 80.0 70.0 60.0 50.0 40.0 30.0 20.0 10.0 0.0
Active transportation Private transportation
2000 2010 2000 2010 2000 2010 2000 2010 2000 2010 2000 2010 2000 2010
Education (years)
<8 9-11 >12 2000 2010 2000 2010 2000 2010
19.7 33.8 46.5 22.0 35.6 42.4 15.9 49.0 35.2 22.6 57.4 20.0 19.4 51.4 29.2 25.0 55.8 56.2
19.2 18.8 25.0
35.0 50.0 15.0 4.2 8.3 87.5 91.9 54.3 14.0 31.8 61.7 50.4 42.4 36.4 21.2 22.8 26.8 19.8 18.5 0.0 8.1 26.8 32.1 41.1 52.1 25.4 22.5 39.6 47.3 23.9 39.1 37.0 68.3 74.8 11.9 19.8 9.6 15.6 13.2
an increase among those who had 9 to 11 and ≥ 12 years of study. Moreover, results show a negative relation between education and the use of active transportation, once that the higher the education, the lesser the use (Figure 1B).
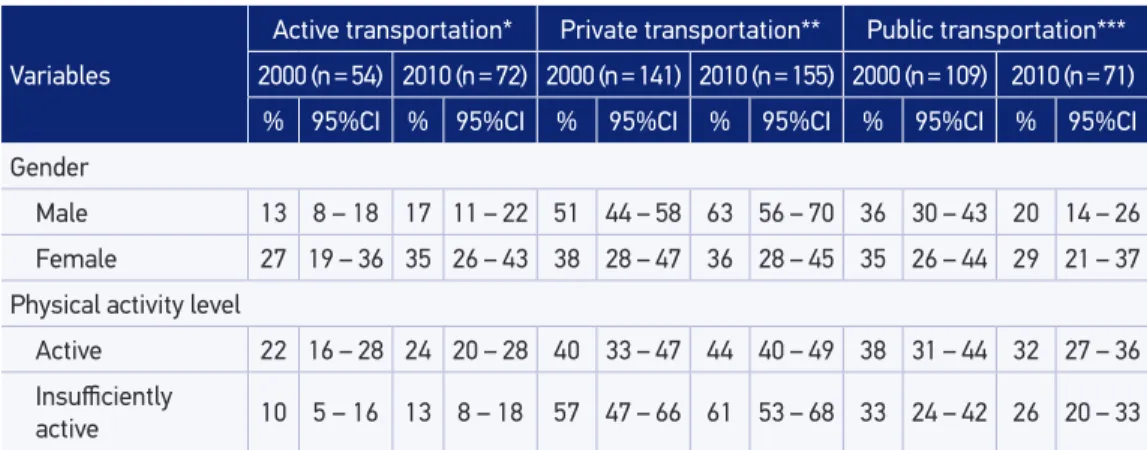
Table 2 describes the changes occurred in different means of commuting to work between 2000 and 2010 according to gender and PA level. Data show that, in the period analyzed, the use of active transportation increased proportionally and sim-ilarly in both genders (30.8% in males and 29.6% in females). Private transportation had an increase only among males, while the use of public transportation decreased for both genders.
As for PA levels, the proportions of active and insuiciently active individuals who used active and private means for commuting to work increased between 2000 and 2010. On the other hand, the proportion of active and insuiciently active people using public transpor-tation in commuting to work decreased between 2000 and 2010.
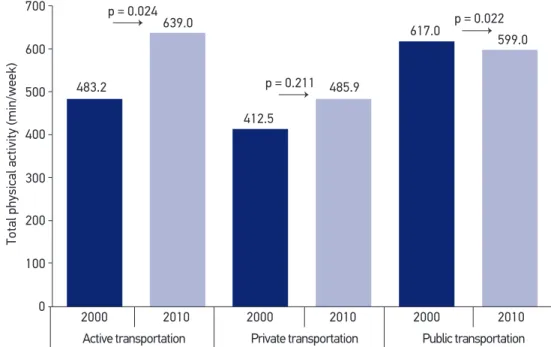
Figure 2 compares the changes in overall PA (min/week) according to the year evaluated (2000 and 2010) and the means of transportation used in commuting to work. The mean overall PA of the ones using active transportation has signiicantly increased (p = 0.024; 32.2%) in the period analyzed. No signiicant diferences were found between years 2000 and 2010 in private transportation. In public transportation, on the other hand, there was a signiicant decrease in the mean PA in min/week (-2.9%).
In 2000, the highest PA mean in min/week was among the ones who used public trans-portation when commuting to work. In 2010, it was among the ones who used active transportation.
Table 2. Proportion of participants who used diferent means of commuting to work (active, private and public transportation) according to gender, physical activity and year of assessment in three municipalities in the region of São Paulo in 2000 and 2010.
n: number of commuting to work in each period assessed; 95%CI: 95% conidence interval; *participants who went to work on foot or by bicycle; **participants who went to work by motorcycle, car, van and bus, carpooling or company
car; ***participants who went to work by bus, van, train or subway. Variables
Active transportation* Private transportation** Public transportation***
2000 (n = 54) 2010 (n = 72) 2000 (n = 141) 2010 (n = 155) 2000 (n = 109) 2010 (n = 71)
% 95%CI % 95%CI % 95%CI % 95%CI % 95%CI % 95%CI
Gender
Male 13 8 – 18 17 11 – 22 51 44 – 58 63 56 – 70 36 30 – 43 20 14 – 26
Female 27 19 – 36 35 26 – 43 38 28 – 47 36 28 – 45 35 26 – 44 29 21 – 37
Physical activity level
Active 22 16 – 28 24 20 – 28 40 33 – 47 44 40 – 49 38 31 – 44 32 27 – 36 Insuiciently
DISCUSSION
This study aimed to describe the main means of commuting to work and the PA among adults of three municipalities in the São Paulo region in 2000 and 2010. The use of active transportation has increased for both genders in the period analyzed, being higher among women. The use of private transportation had a growth among men and dropped among women. Public transportation has sufered a decrease for both genders, being lower among men. Between 2000 and 2010, the proportion of active and insui-ciently active individuals increased among those who commuted using active and private transportation, but decreased among those who used public transportation. The mean overall PA in min/week had a signiicant increase among those commuting with active transportation, and a signiicant decrease among the ones commuting with public trans-portation. In addition, the results show a negative relation between education, SEL and the use of active transportation, considering that the higher the education or SEL, the lesser the use of active transportation.
Active transportation is understood as commuting from one point to another by walking, running, cycling, skating, skateboarding, and using non-motorized wheelchairs. It ofers a number of beneits, such as promoting health through regular PA practice, improving social interactions, reducing traic jams, contributing to the reduction of the greenhouse and gas emission efects and saving money with fuel and parking27,28.
Figure 2. Changes in physical activity in minutes/week for the diferent means of commuting to work in three municipalities in the region of São Paulo in 2000 and 2010.
Total physical activity (min/week)
700
600
500
400
300
200
100
0
Active transportation
2000 2010
Private transportation
2000 2010
Public transportation
2000 2010
p = 0.024
p = 0.211
412.5
485.9
p = 0.022 617.0
599.0
483.2
A cross-sectional study which evaluated the type of transportation with adults in Sweden in years 2008 and 2009 shows that 63% of adults preferred using private transportation, while only 8.3% preferred using active transportation. However, despite using private trans-portation most of the time, the subjects reported performing PA during their free time29.
These data are diferent from the ones in the present study, in which 24.2% of the sample used an active means transportation, and 52.0% used private ones. The diference may be explained by many factors, such as culture, availability of built environments and, mainly, the distance to be covered.
A study carried out in Atlanta showed that 89.2% of the subjects interviewed used active transportation in the region, but only 2.6% of this sample met the recommenda-tions of PA for walking, since most of them would choose this kind of transportation due to living close to their destination and using private transportation when commut-ing to farther locations30. These data are diferent from the ones in the present study, in
which 22% met the recommended PA goals when using active transportation, proving that environmental and social factors may inluence it and therefore should be taken into account in such researches.
As for the total PA in min/week, the results of the present study are similar to the ones found in others, showing that adults who use active transportation when commuting to work have higher total PA values (min/week) when compared to those who choose pub-lic transportation31-33.
A survey carried out by the National Traic Department (Departamento Nacional de
Trânsito – DENATRAN) showed an improvement in car leet between 2000 and 2010, going from approximately 29 million to 64 million34. These data may be related to the results in
the present study, in which a decrease in the use of public transportation and an increase in private transportation was observed.
Throughout the period analyzed in this study, the ABC region went through some changes and the implementation of public policies for the promotion of PA practice. However, the increased commuting by active transportation is hard to be explained, since the present study did not analyze all the necessary variables. In the municipality of Santo André, for example, the city hall implemented bicycle lane projects and created the
program Santo André em Movimento (“Santo André on the Move”), with the objective of
ofering educational guidance on the conscious use of bicycles, skateboards and skates as
both means of commuting and leisure35. In São Caetano do Sul and Santo André, there
were some changes in built environments, such as widening of sidewalks and the con-struction of bike lanes36,37. In addition, it is noteworthy that all three municipalities are part
of the Regional Health Directorate 1 (Diretoria Regional de Saúde 1) – São Paulo (DRS 1) and are partners of the Programa Agita São Paulo (“Bustling São Paulo Program”), of the State Health Bureau of the state of São Paulo, which is committed to ighting a sedentary lifestyle and increasing PA levels in the population aged 14 years old or older, including students, elderly and workers38.
1. Reiner M, Niermann C, Jekauc D, Woll A. Long-term health beneits of physical activity--a systematic review of longitudinal studies. BMC Public Health 2013; 13: 813.
2. World Health Organization. Global health risks: Mortality and burden of disease attributable to selected major risks. Genebra: WHO; 2009.
3. Hallal PC, Andersen LB, Bull FC, Guthold R, Haskell W, Ekelund U, et al. Global physical activity levels: surveillance progress, pitfalls, and prospects. Lancet 2012 Jul 21; 380(9838): 247-57.
4. Brasil. Evaluation of Physical Activity Program Efectivity in Brazil. Brasília: Secretaria de Vigilância Sanitária em Saúde, Departamento de Análise de Situação em Saúde; 2013.
5. Hallal P, Knuth A, Reis R, Rombaldi A, Iser B, Bernal R. Tendências temporais de atividade física no Brasil. Rev Bras Epidemiol 2011; 14(1): 53-60.
6. Pucher J, Dill J, Handy S. Infrastructure, programs, and policies to increase bicycling: an international review. Prev Med 2010; 50: S106-25.
7. Carnall D. Cycling and health promotion: A safer, slower urban road environment is the key. BMJ 2000; 320(7239): 888.
8. Garber CE, Blissmer B, Deschenes MR, Franklin BA, Lamonte MJ, Lee I-M, et al. American College of Sports Medicine position stand. Quantity and quality of exercise for developing and maintaining cardiorespiratory, musculoskeletal, and neuromotor itness in apparently healthy adults: guidance for prescribing exercise. Med Sci Sports Exerc 2011; 43(7): 1334-59.
9. Teixeira I, Nakamura P, Smirmaul B, Fernandes R, Kokubun E. Fatores associados ao uso de bicicleta como meio de transporte em uma cidade de médio porte. Rev Bras Atividade Física Saúde 2013; 18(6): 698-710. 10. Gordon-Larsen P, Boone-Heinonen J, Sidney S, Sternfeld
B, Jacobs DR, Lewis CE. Active commuting and cardiovascular disease risk: the CARDIA study. Arch Intern Med 2009; 169(13): 1216-23.
11. Ogilvie D, Egan M, Hamilton V, Petticrew M. Promoting walking and cycling as an alternative to using cars: systematic review. BMJ 2004; 329 (7469): 763.
REFERENCES
PA levels; the assessment of just two periods in a 10-year gap, which may prevent the inter-pretation of the Evolution and the tendency of the results; and the lack of standardization in data collection regarding active transportation, which may hinder the comparison and discussion of the results.
CONCLUSION
12. Rojas-Rueda D, de Nazelle A, Tainio M, Nieuwenhuijsen MJ. The health risks and beneits of cycling in urban environments compared with car use: health impact assessment study. BMJ 2011; 343: d4521.
13. Comarú FA, Westphal M. Housing, urban development and health in Latin America: contrasts, inequalities and challenges. Rev Environ Health 2004; 19(3-4): 329-45. 14. Reynolds C, Harris MA, Teschke K, Cripton PA, Winters
M. The impact of transportation infrastructure on bicycling injuries and crashes: a review of the literature. Environmental Health 2009; 8(1): 47.
15. Dratva J, Phuleria HC, Foraster M, Gaspoz J-M, Keidel D, Künzli N, et al. Transportation noise and blood pressure in a population-based sample of adults. Environ Health Perspect 2012; 120: 50-5.
16. Brownson RC, Boehmer TK, Luke DA. Declining rates of physical activity in the United States: what are the contributors? Annu Rev Public Health 2005; 26: 421-43. 17. Cervero R, Sarmiento OL, Jacoby E, Gomez LF,
Neiman A. Inluences of built environments on walking and cycling: lessons from Bogotá. Int J Sustainable Transportation 2009; 3(4): 203-26.
18. Gomes GA, Reis RS, Parra DC, Ribeiro I, Hino AA, Hallal PC, et al. Walking for leisure among adults from three Brazilian cities and its association with perceived environment attributes and personal factors. Int J Behav Nutr Phys Act 2011; 8(1): 111.
19. Martinez SM, Arredondo EM, Roesch S, Patrick K, Ayala GX, Elder JP. Walking for transportation among Latino adults in San Diego County: who meets physical activity guidelines? J Phys Act Health 2011; 8(7): 898-906. 20. Confederação Nacional da Indústria I. Retratos
da sociedade brasileira: locomoção urbana. Brasil: Confederação Nacional da Indústria; 2011.
21. Malta DC, Morais Neto OL, Silva Junior JB. Apresentação do plano de ações estratégicas para o enfrentamento das doenças crônicas não transmissíveis no Brasil, 2011 a 2022. Epidemiol Serv Saúde 2011; 20(4): 425-38. 22. Romeiro MC. Pesquisa socioeconômica do ABC Sao
Paulo, Brazil. 2011; 20(4). [Internet]. Disponível em: http://repositorio.uscs.edu.br/handle/123456789/115 (Acessado em: 20 de abril de 2015).
23. Craig CL, Marshall AL, Sjostrom M, Bauman AE, Booth ML, Ainsworth BE, et al. International physical activity questionnaire: 12-country reliability and validity. Med Sci Sports Exerc 2003 Aug; 35(8): 1381-95.
24. World Health Organization. Global Recommendations on Physical Activity for Health. Genebra: World Health Organization; 2010.
25. Associação Brasileira de Empresas de Pesquisa. Critério de Classiicação Econômica Brasil. Brasil: Associação Brasileira de Empresas de Pesquisa; 2010. 4p. 26. Norusis MJ. SPSS for Windows Advanced Statistics
Release 6.0. 6ª ed. Engleewod Clifs: Prentice Hall; 1993.
27. Public Health Agency of Canada. What is Active Transportation? Canada: Federal Government; 2014. p. 1.
28. Giles-Corti B, Foster S, Shilton T, Falconer R. The co-beneits for health of investing in active transportation. N S W Public Health Bull 2010 May-Jun; 21(5-6): 122-7. 29. Thern E, Forss KS, Jogreus CE, Stjernberg L. Factors associated with active commuting among parents-to-be in Karlskrona, Sweden. Scand J Public Health 2015 Feb; 43(1): 59-65.
30. Lachapelle U, Frank LD. Transit and health: mode of transport, employer-sponsored public transit pass programs, and physical activity. J Public Health Policy 2009; 30 (Suppl 1): S73-94.
31. Fishman E, Bocker L, Helbich M. Adult active transport in the Netherlands: an analysis of its contribution to physical activity requirements. PLoS One 2015; 10(4): e0121871.
32. Larouche R, Saunders TJ, Faulkner G, Colley R, Tremblay M. Associations between active school transport and physical activity, body composition, and cardiovascular itness: a systematic review of 68 studies. J Phys Act Health 2014 Jan; 11(1): 206-27.
33. Wanner M, Gotschi T, Martin-Diener E, Kahlmeier S, Martin BW. Active transport, physical activity, and body weight in adults: a systematic review. Am J Prev Med 2012 May; 42(5): 493-502.
34. Brasil. Departamento Nacional de Trânsito. Frota de veículos. Brasil: Departamento Nacional de Trânsito; 2011. 100p.
35. André PMS. ‘Caminhando para a Saúde’ fecha 2013 com 1.517 inscritos. São Paulo; 2014. [Internet]. Disponível em: http://www2.santoandre.sp.gov.br/index.php/ component/k2/item/7918-caminhando-para-a-saude-fecha-2013-com-1-517-inscritos (Acessado em: 30 de agosto de 2015).
36. São Caetano do Sul. São Caetano do Sul - Cidades Ativas. 1: Construção e implementação de ruas de lazer, ciclofaixas e ciclovias]. São Caetano do Sul; 2013. [Internet]. Disponível em: http://www.saocaetanodosul. sp.gov.br/ (Acessado em: 16 de julho de 2015). 37. São Bernardo do Campo. Ciclovias e Ciclofaixas. São
Bernardo do Campo: Prefeitura; 2013. [Internet]. Disponível em: http://www.saobernardo.sp.gov.br/ home (Acessado em: 16 de julho de 2015).
38. Paulo PAS. Promoção de Atividade Física no Estado de São Paulo. São Paulo: Victor Matsudo; 1996. [Internet]. Disponível em: http://www.portalagita.org.br/pt/ agita-sp/o-agita-sp/o-que-fazemos.html (Acessado em: 16 de julho de 2015).
Received on: 09/18/2015
![Table 1. Descriptive analysis (mean [SD] or n [%]) of the sample according to the period evaluated:](https://thumb-eu.123doks.com/thumbv2/123dok_br/14937337.502503/6.829.128.700.301.960/table-descriptive-analysis-mean-sample-according-period-evaluated.webp)