203
O
ri
gi
na
l
a
rt
ic
le
s
Associations between meanings of old age and subjective well-being
indicated by satisfaction among the elderly
Efigênia Passarelli Mantovani1 Sérgio Roberto de Lucca1 Anita Liberalesso Neri2
1 Universidade Estadual de Campinas, Faculdade de Ciências Médicas, Programa de Pós-graduação em
Saúde Coletiva. Campinas, SP, Brasil.
2 Universidade Estadual de Campinas, Faculdade de Ciências Médicas, Programa de Pós-graduação em
Gerontologia. Campinas, SP, Brasil.
Correspondence
Efigênia Passarelli Mantovani E-mail: [email protected]
Abstract
Objectives: To investigate the meanings attributed by the elderly to healthy aging and to being happy in old age, and the associations between these meanings and the evaluations of the elderly individuals of their overall and domain-referenced satisfaction. Method: A cross-sectional and multicenter study was performed. The verbal utterances of representative samples of community-dwelling elderly persons (N=1,242, aged 65 years and older) registered in the databases of two Brazilian cities, were submitted to content analysis and compared with satisfaction indicators, considering gender, age and family income. Results: Four themes and 14 categories explained the two concepts: physical health and functioning (42.1% of utterances), psychological well-being (25.4%), interpersonal relationships (23.5%) and material resources and access to health services (9.0%). No significant differences were observed for the prevalence ratios between the categories of meaning and great satisfaction with life, with the exception of satisfaction and pleasure. Conclusion:The two concepts raised common meanings associated with positive aspects of old age and had an impact on satisfaction ratings, showing that healthy and happy aging is more than just being healthy, but also involves psychological well-being and interpersonal relationships.
Key words: Aging; Health
INTRODUCTION
Healthy aging is defined by subjective measurements, such as life satisfaction, feelings and state of mind, and objective measurements, such as morbidity, independence and mortality. From a biomedical point of view, the most prominent description for healthy aging involves three criteria: a low risk of illnesses and their associated disabilities; high levels of physical and mental activity; and active involvement in daily life.1
Emotional well-being is one of the most valuable dimensions from a psychosocial perspective. It has been correlated with a happy and satisfied life, and has been explained using two different models. The sociological model uses life satisfaction and the balance between positive and negative feelings as indicators. It interprets a subjective assessment of the global situation and does not decline with age. On the contrary, it seems to increase in old-age.2
The psychological model is based on the concept of seeking personal excellence, which leads to a sense of adjustment.3 According to Diener et al.,4
happiness and pleasure are parts of an ongoing experience of positive and negative emotions, the physiological and psychological effects of which act as regulatory provisions for behavior.
Studies of subjective well-being in old-age have gained an increasing amount of attention in the field of epidemiology, due to the accumulation of evidence that correlates this variable with positive health outcomes, including increased longevity,5
the adoption of healthy behavior6 and improved
immune responses.7
Personal satisfaction with life as a whole, or with different aspects of life, is the result of a comparison between people’s expectations and achievements, which are based on personal and socio-normative criteria and are influenced by positive and negative affects. These two variables integrate the concept of subjective well-being, which has long been used in disciplines such as psychology, sociology, demography, epidemiology and gerontology to study quality of life or successful
aging in objective and subjective terms, as well as the well-being of individuals and populations.4
Together with overall life satisfaction, domain-referenced satisfaction integrates the constructs of subjective well-being.4 The measurements
of domain-referenced satisfaction help clarify which elements control overall assessments of life satisfaction.
Life satisfaction has been described as a multi-dimensional and multi-directional concept, which can vary in accordance with several conditions. Of these, the most commonly studied are the variables of age, gender, education and marital status.8-10 According to Daig et al.,8 elderly women
exhibit less life satisfaction than elderly men, due to the fact that they experience more symptoms and illnesses. According to some authors, the elderly are more satisfied with life than non-elderly individuals, while other authors have claimed there is no correlation between age and life satisfaction.11
A low level of education and a low income seem to have been correlated with lower levels of satisfaction in a number of studies.2,10
Using a questionnaire containing 20 attributes of successful aging, Phelan et al.12 determined that
elderly North Americans (Caucasian and Japanese descent) selected the same attributes. Thirteen items were indicated as important: health; life satisfaction; attention from friends and relatives; social relationships; independence in decision-making; satisfaction related to their own needs; not feeling lonely; adapting to age-related changes; capacity for self-care until close to death; feeling good about oneself; facing the challenges of the coming years; an absence of chronic illnesses and acting in accordance with their inner values. These aspects are the most commonly cited by elderly individuals in most qualitative studies of the components of healthy or successful aging.13
A Brazilian study14 suggested that healthy
Meanings of old age and subjective well-being among the elderly 205
needs and the ability to change habits. According to the elderly participants of a study by Deponti & Acosta,15 a balance of multiple factors is required
for healthy aging to occur. These include biological, psychological and social factors. These individuals stated that they had active and busy social lives, regardless of whether they suffered from some form of physical or psychological limitation. Similarly, according to Cupertino et al.,16 several
dimensions were associated with healthy aging, including physical, social, emotional, economic and cognitive factors, among others. According to Martins et al.,17 the beliefs of the elderly concerning
old age are linked to the ideology of “a good age”, having “a young spirit”, staying active, staying healthy, having a good family relationship and following a religious faith.
There is no data available in Brazil concerning the correlations between meanings attributed by the elderly to concepts such as healthy aging, happiness in old age and the subjective well-being indicated by satisfaction. Understanding the meanings that men and women with different health conditions, salaries and education levels attribute to the concepts of happiness in old age and healthy aging is important, given that these ideas are linked to their motivation to perform activities and look after their health, both of which are important to successful aging.
The aims of the present study were: a) to identify and compare the meanings of the concept of healthy aging, as expressed by elderly residents in Belém-PA and the meanings of the concept of happiness in old age, as expressed by elderly individuals in Campinas-SP; b) to characterize the elderly individuals from the two cities in terms of overall life satisfaction and domain-referenced satisfaction (memory, ability to solve daily problems, friendships and family relationships, environment, access to health services and transportation) considering the variables gender, age and family income; and c) to investigate the correlations between the meanings attributed to the concepts of healthy aging and happiness in
old age and the assessments of global satisfaction and domain-referenced satisfaction.
METHODS
The present study was conducted using the data contained in the database of a study of frailty among elderly Brazilians (Fibra Unicamp study, 2008-2009), which was multicentric and cross-sectional in nature. The aim of the Fibra Unicamp study was to investigate frailty in terms of sociodemographic, biological and psychosocial variables, using elderly urban dwellers (65 years or more). The Fibra study involved samples of elderly individuals from seven Brazilian locations, which were selected based on convenience. In each location, a simple random sampling of urban census sectors was conducted using a quantity that corresponded to the ratio between the number of elderly individuals expected and the urban census tracts.18 The present study used
data from the cities of Belém-PA and Campinas-SP, both of which had a population in excess of one million at the time of the recruitment and data collection. Belém had a gross domestic product (GDP) of R$ 9793.00 per capita and Campinas had a GDP of R$ 29,731.00 per capita.19 This data confirms
that the cities are of similar size, but their respective populations are exposed to different conditions of economic development.
The present study used quantitative methods, despite the diferences in income and the levels of well-being in the two samples from the respective elderly populations. Analysis of content was used to analyze the qualitative data and to categorize the meanings of the concepts of healthy aging and happiness in old age.
The following eligibility criteria were used during recruitment: individuals aged 65 years or more; who had a permanent home address and census tract (93 in Belém and 90 in Campinas); with no severe impairments that affected their physical health, cognition, communication, feelings or mobility.20 At the end of the first
elderly individuals in Campinas and 721 in Belém and involved assessments of sociodemographic, clinical, anthropometric and frailty results, a new exclusion criterion was introduced: the score obtained by each elderly individual in the Mini Mental State Examination (MMSE), minus a standard deviation.21 Consequently, the samples
decreased to 689 individuals in Campinas and 571 in Belém. These individuals were interviewed about health and psychosocial variables, including those of interest to the present study.
All of the participants signed a Free and Informed Consent Form. The project received approval from the Research Ethics Committee of the Medical Sciences Faculty of Unicamp under protocol number 208/2007; CAAE 39547014.0.1001.5404. An addendum to the main project was approved under protocol number CAAE 01511146000-07.
Participants
The sample contained 1242 elderly individuals with no cognitive deficits suggestive of dementia, who answered an open question about the meaning of healthy aging (Belém: n=566) or an open question about the meaning of happiness in old age (Campinas: n=676). In both cities, questions about overall satisfaction and domain-referenced satisfaction were included. The interviewers literally noted the content of the answers and transcribed them in full for the subsequent analysis of content (Bardin).22 They also recorded the answers related
to the scales of satisfaction and the items that requested socioeconomic data.
Variables and measurements
1. Meanings attributed to the concept of healthy aging: What does healthy aging mean? This question was posed to the elderly participants in Belém, who answered it freely. The interviewers noted
down their responses word-for-word, and then transcribed them into a database for subsequent analysis of content (Bardin).22
2. Meanings attributed to the concept of happiness in old age: What does it mean to be happy in old age? This question was posed to the participants in Campinas.The interviewers noted down their responses word-for-word, and then transcribed them into a database for the subsequent analysis of content (Bardin).22
3. Overall life satisfaction and domain-referenced satisfaction:A single item was used to assess overall satisfaction, whereas six items were used to assess domain-referenced satisfaction: memory; capacity to solve daily problems; friendships and family relationships; environment (climate, noise, pollution, attractions and safety); access to health services and transportation.23 The items
were scalar, each with three levels of intensity (1= low, 2= moderate and 3= high).
4. Socioeconomic variables: a) gender (male or female); b) age in years completed since birth, grouped into four age groups (65-69, 70-74, 75-79, and >80 years or more); c) family income [salaries, pensions, retirement funds, social benefits, rent and interest received on a monthly basis by members of the family (gross values), which were converted into the corresponding number of minimum salaries (MS) at the time of the data collection (≤1; 1.1 to 3; 3.1 to 5; >5 MS)].
Data Analysis
Meanings of old age and subjective well-being among the elderly 207
could provide useful data for the phenomenon in question. Thus, qualitative analysis does not reject any form of quantification. 22
Working individually, and later together, two specialists conducted the pre-analysis, which involved a reading of the textual material obtained from the literal transcripts of the responses provided by the participants in Belém-PA. Each member of this pair performed independent analysis of the statements on the meaning of healthy aging, identifying similarities and differences.
Subsequently, these statements were grouped into themes and categories, or equivalence classes defined by the meanings recorded, based on the theories and micro-theories addressing psychological development in old age (Bardin).22
The data from the two observers was collated and submitted to reliability analysis, with a requirement of 100% agreement. Next, the statements on the concepts of happiness in old age (elderly participants in Campinas) were analyzed based on the categories derived from the concept of healthy aging. This analysis was performed by the same pair of researchers who analyzed the corpus from Belém. The results of their work were submitted to a panel of analysts, who confirmed that the themes and categories correlated with the concept of healthy aging
were repeated for the concept of happiness in old age.
Since no qualitative diferences were found between the themes and categories in relation to the content of the two concepts assessed in Belém and Campinas, it was decided to analyze the data from both cities together. The frequency of the themes and categories was counted and these were then submitted to statistical analysis.
For each city, the data related to overall satisfaction, domain-referenced satisfaction, gender, age and family income were submitted to analysis of frequency and the Chi-squared test. Subsequently, statistical analysis was conducted for the satisfaction variables and the correlations between them, as well as the meanings, considering the two cities separately. The Mann-Whitney test was used to compare men and women, whereas the Kruskal-Wallis test was used to compare age groups and income. Cox regression analysis was used to estimate the prevalence ratios for high, moderate and low overall satisfaction. The level of significance adopted for all statistical tests was 5%.
RESULTS
r
ev
. B
ra
s
. g
er
ia
tr
. g
er
On
tO
l
., r
iO
de
J
an
eir
O
, 2
01
6; 1
9(2
):2
03
-2
22
Chart 1. Statements in themes and respective categories, in response to the questions: What is healthy aging? and What does it mean to be happy in old-age? which were addressed to elderly individuals from Belém-PA and Campinas-SP. Fibra Unicamp study, 2008-2009.
Category Definition Examples n %
Theme 1. Health and functionality
1. Physical health Concerned with health status and looking after their own health. No illnesses. Maintains a healthy lifestyle (eating habits, physical exercise, controlled smoking and drinking). Responsible for a more active lifestyle and a consequent improvement in their health conditions.
“It’s when the person is healthy and able to do things. If you have your health, you have everything (B103); If you look after yourself, eat well, sleep early, keep busy during the day (B136); Avoid parties, don’t drink, don’t smoke, enjoy your leisure time (B48); Its being able to walk, work, stay healthy (C61); Making an effort to do physical exercise, getting on well with your family, not complaining about life, being happy (C174)”.
650 63.3
2. Activity Participation in daily activities related to the conservation of the body and health promotion, including social and community activities, work, leisure and entertainment.
“Being able to do everything at home and in work. Being able to practice physical activities, participate in the elderly choir. Staying close to your children and grandchildren is very pleasant (C30); Its having things to do. If we have nothing to do, we become nothing. You need something (C153); Staying active, staying healthy (B253)”.
192 18.7
3. Independence and autonomy
Physical capabilities intact; capacity to make one’s own decisions, management, self-determination, physical and mental capacity for an independent lifestyle.
“Being able to take a shower and perform activities independently, go to family events (C115); Having no illnesses, being able to walk where you want, travel, helping others (C180); Doing what you want, when you want, how you want. You only depend on yourself (C200); Being healthy, working, performing certain activities. Not depending on others (B27); Being able to organize your own life, without depending on others (B77)”.
160 15.5
4. Cognition Cognitive capabilities intact (problem-solving, decision-making, judgements, attention, good memory).
“A person who is healthy, has a good memory and good sight (B341); Having a healthy mind and knowing what you are doing (C298); Being healthy, with a good memory, knowing what you are doing (B250); Having the capacity to organize your own life without depending on others (B77)”.
26 2.5
Total statements 1.028 100.0
M
ea
nin
gs o
f o
ld a
ge a
nd s
ub
jec
tiv
e w
ell-be
ing a
m
on
g t
he e
lde
rly
209
Continuation of Chart 1.
Category Definition Examples n %
Theme 2. Psychological well-being
1. Satisfaction and pleasure
The individual recognizes that they have a good life, in accordance with their values and expectations, which makes them feel satisfaction, joy, pleasure and happiness. Emotional regulation.
“It’s being satisfied with life (C102); Being at peace, having a peaceful life. Living in harmony with your family (C370); Doing what you like until the last moment. Having friends, good company (C499); For me, its living your life. It’s all about happiness (C625); Staying active, a desire to live. Living well, with vitality (B110)”
337 54.3
2. Religiosity and spirituality
Resources used often by elderly individuals when faced with certain problems, particularly illnesses.
“Having faith in God, knowing how to live your life, knowing how to live... how to solve the problems and difficulties encountered in life (B20); It’s a person who is with God, who needs medicine and takes it. Being well (B192); Living in peace. Living in harmony with people that you like. Having God in your heart, not harming others (C509); God! Its having willpower! (C58)”.
98 15.8
3. Self-awareness and self-worth
A positive and realistic view of the aging process and personal attributes; a sense of self-worth (self-concept and self-esteem), realizing the possibilities to develop new interests and opportunities.
“Having a good life. Not everybody gets to where we are (C151); We accept it, what we have and have not, what we have achieved. We feel accomplished. You can’t keep saying ‘I did that, I didn’t do that’ (C435); You are happy with your life and with yourself. You understand people. You love without concern, you are at peace with yourself and your family. You enjoy doing things (B9)”.
80 12.9
4. Seeks personal excellence
Belief that guides goals and a sense of dominion, with self-improvement aspirations.
“Facing events – I do everything that is good for old age (B101); Staying true to my commitments (B245); Living at peace with yourself (C 114)”.
50 8.0
5. Sense of accomplishment
Recognizes and values the extent of adult roles in the family and in society; perception that they are capable of obtaining the results expected, with control over their own aging.
“Life awareness. Awareness of well-being, completing tasks without harming anybody. Everything you acquired was through achievements (C29); We are happy because we have already completed many activities. We have knowledge and experience and opportunities (C160); Its having a healthy life and solving my problems; - I still have many plans for my future (B183)”.
56 9.0
Total statements 621 100.0
r
ev
. B
ra
s
. g
er
ia
tr
. g
er
On
tO
l
., r
iO
de
J
an
eir
O
, 2
01
6; 1
9(2
):2
03
-2
22
Continuation of Chart 1.
Category Definition Examples n %
Theme 3. Interpersonal relationships
1. Harmonious family relationships
Valuing and recognizing that family relationships are a source of satisfaction and contentment and are free of conflict, or that the family members act positively to seek solutions.
“Affection from our children, not being outcast! My family is wonderful (C138); Being at peace with your family is enough to be happy (C83); Being happy with your relatives and family members, being comfortable, having friendships, sharing experiences, being happy with your family (B203)”.
279 48.6
2. Harmonious social relationships
Valuing and recognizing that social
relationships are a source of satisfaction and contentment and free of conflict, or that the individuals involved act positively to seek solutions when interpersonal conflicts occur.
“Having peace and friendship with others. Not hating anybody (C371); Having contact with friends, chatting (C447); Having friendships, good company. Always having somebody who advises us and makes us feel better (C449); Its being healthy, communicating with others, avoiding isolation and thinking positive thoughts (B331)”.
184 32.0
3. To be valued and respected
Positive attitudes related to other people, at home and socially, in relation to the elderly.
”Being at peace with your family, being well-treated by all (C343); Its having your health, being able to come and go on a daily basis, having the support of your family, not feeling abandoned, having affection and respect (B199)”.
62 10.8
4. To offer care and to be cared for
Offering and receiving material, instrumental and emotional assistance; exchange of assistance between generations.
“Being comfortable in your home, having the support of other elderly individuals and the respect of your family and society (B306); Having a peaceful spirit, being looked after when you need medicine, having children and a decent salary (C125); Having your health, being able to work and do things for others, doing your daily tasks (C412)”.
47 8.2
5. Good image Positive perceptions about their own appearance.
“It’s recognizing that a person keeps changing until they get old, you cannot be sad about it (C67); Its living well, feeling good, combing your hair, using perfume (B194)”.
02 0.4
Total statements 574 100
Theme 4. Financial resources/health services
1. Material resources Recognizing the importance of social opportunities, environmental conditions, materials, comfort and safety to well-being and independence.
“Having food in your house to eat, money to go out (C306); Having a decent life, being able to at least buy medicine and look after yourself, without disturbing anybody (C4); Not depending on your children, sustaining yourself. Being independent (C218); When you have a certain comfort, a good health insurance
Meanings of old age and subjective well-being among the elderly 211
Of the elderly individuals living in Campinas, 68.6% were female. In Belém, this figure was 69.4%. The mean age of the participants was 72.2(±5.5) years in Campinas and 72.9(±6.0) years in Belém (ranging from 65 to 90 years). Men in both cities had a significantly higher family income than women: in Belém, the mean was 4.1(+4.0) minimum salaries; in Campinas, the mean was 5.8 (+7.2) minimum salaries (p=0.038). However, the elderly residents in Belém had a significantly lower family income than those in Campinas. A significantly higher number of men in Campinas had an income of 10 minimum salaries (p=0.014), when compared with men in Belém (data not tabulated).
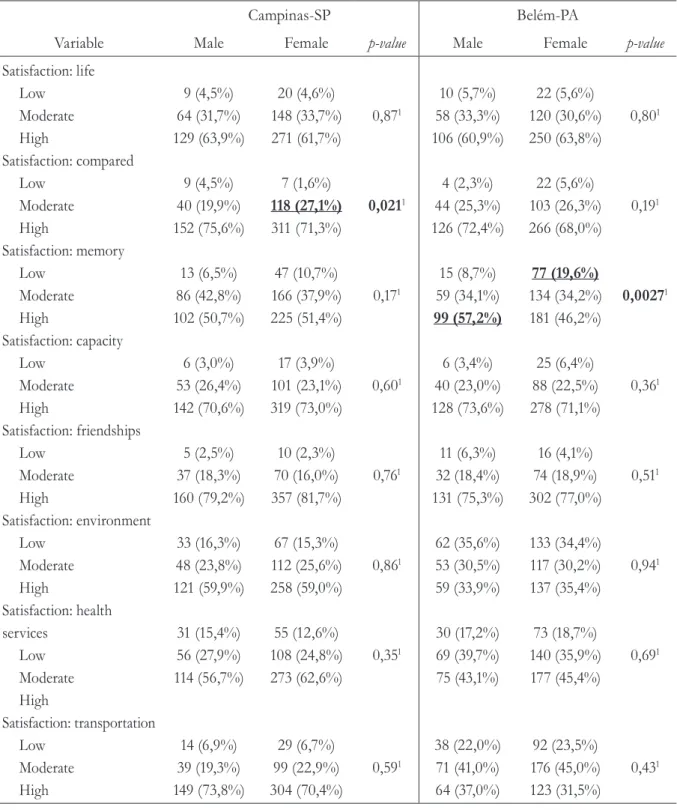
Most of the elderly participants claimed to be very satisfied with life, and more than 80.0% were highly satisfied with life when compared with people in other age groups. The high frequency of elderly individuals who were satisfied with friendships was similar in the two cities, as was their satisfaction for the capacity to solve problems. High satisfaction with the environment was reported by approximately half of the elderly individuals in both cities. In Campinas, almost 70.0% were very satisfied with transportation, although in Belém, this figure ranged from 30.6% to 37.2%. The percentage of elderly individuals satisfied with their memory was approximately 50.0% in Belém and 52.0% in Campinas. In Campinas, more women than men classified their health status as intermediate. This was also the case
when compared with other age groups. In Belém, men were significantly more satisfied with their memory than women. More women expressed a low level of satisfaction for this domain than men (Table 1).
No statistically significant diferences were found in the satisfaction assessments for age groups, as can be seen in Table 2.
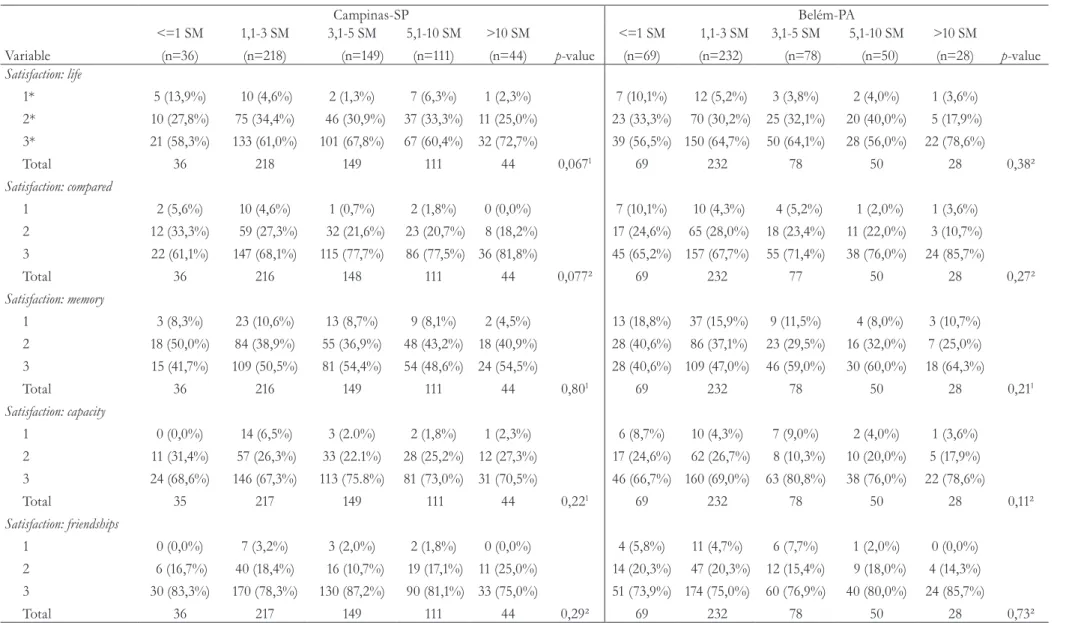
Table 3 contains data concerning the satisfaction assessments, according to family income. In Belém, there was a significantly higher percentage of elderly individuals who had an income higher than 10 minimum salaries and claimed to be very satisfied with transportation. No statistically significant diferences were recorded in either city for this variable.
Table 1. Men and women from Campinas-SP and Belém-PA, according to their overall life satisfaction and domain-referenced satisfaction. Fibra Unicamp study, 2008-2009.
Campinas-SP Belém-PA
Variable Male Female p-value Male Female p-value
Satisfaction: life
Low Moderate High Satisfaction: compared
Low Moderate High Satisfaction: memory
Low Moderate High Satisfaction: capacity
Low Moderate High Satisfaction: friendships
Low Moderate High Satisfaction: environment
Low Moderate High Satisfaction: health services
Low Moderate High Satisfaction: transportation
Low Moderate High
9 (4,5%) 64 (31,7%) 129 (63,9%)
9 (4,5%) 40 (19,9%) 152 (75,6%)
13 (6,5%) 86 (42,8%) 102 (50,7%)
6 (3,0%) 53 (26,4%) 142 (70,6%)
5 (2,5%) 37 (18,3%) 160 (79,2%)
33 (16,3%) 48 (23,8%) 121 (59,9%)
31 (15,4%) 56 (27,9%) 114 (56,7%)
14 (6,9%) 39 (19,3%) 149 (73,8%)
20 (4,6%) 148 (33,7%) 271 (61,7%)
7 (1,6%)
118 (27,1%)
311 (71,3%)
47 (10,7%) 166 (37,9%) 225 (51,4%)
17 (3,9%) 101 (23,1%) 319 (73,0%)
10 (2,3%) 70 (16,0%) 357 (81,7%)
67 (15,3%) 112 (25,6%) 258 (59,0%)
55 (12,6%) 108 (24,8%) 273 (62,6%)
29 (6,7%) 99 (22,9%) 304 (70,4%)
0,871
0,0211
0,171
0,601
0,761
0,861
0,351
0,591
10 (5,7%) 58 (33,3%) 106 (60,9%)
4 (2,3%) 44 (25,3%) 126 (72,4%)
15 (8,7%) 59 (34,1%)
99 (57,2%)
6 (3,4%) 40 (23,0%) 128 (73,6%)
11 (6,3%) 32 (18,4%) 131 (75,3%)
62 (35,6%) 53 (30,5%) 59 (33,9%)
30 (17,2%) 69 (39,7%) 75 (43,1%)
38 (22,0%) 71 (41,0%) 64 (37,0%)
22 (5,6%) 120 (30,6%) 250 (63,8%)
22 (5,6%) 103 (26,3%) 266 (68,0%)
77 (19,6%)
134 (34,2%) 181 (46,2%)
25 (6,4%) 88 (22,5%) 278 (71,1%)
16 (4,1%) 74 (18,9%) 302 (77,0%)
133 (34,4%) 117 (30,2%) 137 (35,4%)
73 (18,7%) 140 (35,9%) 177 (45,4%)
92 (23,5%) 176 (45,0%) 123 (31,5%)
0,801
0,191
0,00271
0,361
0,511
0,941
0,691
0,431
M ea nin gs o f o ld a ge a nd s ub jec tiv e w ell-be ing a m on g t he e lde rly 213
Continues on next page
Table 2. Elderly individuals from Campinas-SP and Belém-PA (different age groups), according to overall life satisfaction and domain-referenced satisfaction. Fibra Unicamp study, 2008-2009.
Campinas-SP Belém-PA
Variable 65-69 years
(n=235) 70-74 years (n=215) 75-79 years (n=121) >=80 years (n=70)
p-value 65-69anos
(n=220) 70-74 years (n=166) 75-79 years (n=114) >=80 years (n=66) p-value Family income (mean; sd)
4,4±3,8 (n=215) 5,5±7,3 (n=183) 4,6±4,0 (n=105) 3,7±3,5 (n=55) 3,0±2,7
(n=180)
4,3±7,2 (n=135) 3,8±4,0 (n=88) 4,5±4,4 (n=54)
Family income (median; min.-max.)
3,5 (0,4-24,1) 3,6 (0,0-57,8) 2,9 (1,0-24,1) 3,0 (0,8-21,5) 0,088¹ 2,1(0,2-19,4) 2,2(1,0-72,3) 2,4 (1,0-22,2) 2,5 (1,0-22,7) 0,15¹
r ev . B ra s . g er ia tr . g er On tO l ., r iO de J an eir O , 2 01 6; 1 9(2 ):2 03 -2 22
Continuation of Table 2
Campinas-SP Belém-PA
Variable 65-69 years
(n=235) 70-74 years (n=215) 75-79 years (n=121) >=80 years (n=70)
p-value 65-69anos
(n=220) 70-74 years (n=166) 75-79 years (n=114) >=80 years (n=66) p-value Renda familiar (média; dp)
4,4±3,8 (n=215) 5,5±7,3 (n=183) 4,6±4,0 (n=105) 3,7±3,5 (n=55) 3,0±2,7
(n=180)
4,3±7,2 (n=135)
3,8±4,0 (n=88) 4,5±4,4 (n=54)
Renda familiar mediana; min.-máx.)
3,5 (0,4-24,1) 3,6 (0,0-57,8) 2,9 (1,0-24,1) 3,0 (0,8-21,5) 0,088¹ 2,1(0,2-19,4) 2,2(1,0-72,3) 2,4 (1,0-22,2) 2,5 (1,0-22,7) 0,15¹
Satisfaction: friendships 1 2 3 Total Satisfaction: environment 1 2 3 Total
Satisfaction: health services
1 2 3 Total Satisfação: transportation 1 2 3 Total 8 (3,4%) 31 (13,2%) 195 (83,3%) 234 42 (17,9%) 54 (23,0%) 139 (59,1%) 235 35 (15,0%) 64 (27,5%) 134 (57,5%) 233 15 (6,4%) 47 (20,1%) 172 (73,5%) 234 4 (1,9%) 35 (16,4%) 175 (81,8%) 214 37 (17,4%) 56 (26,3%) 120 (56,3%) 213 32 (15,0%) 58 (27,1%) 124 (57,9%) 214 10 (4,7%) 48 (22,6%) 154 (72,6%) 212 1 (0,8%) 30 (24,8%) 90 (74,4%) 121 15 (12,4%) 35 (28,9%) 71 (58,7%) 121 12 (10,0%) 30 (25,0%) 78 (65,0%) 120 10 (8,4%) 29 (24,4%) 80 (67,2%) 119 2 (2,9%) 11 (15,7%) 57 (81,4%) 70 6 (8,6%) 15 (21,4%) 49 (70,0%) 70 7 (10,0%) 12 (17,1%) 51 (72,9%) 70 8 (11,6%) 14 (20,3%) 47 (68,1%) 69 0,13² 0,28² 0,27² 0,47² 11 (5,0%) 44 (20,0%) 165(75,0%) 220 79 (36,6%) 66 (30,6%) 71 (32,9%) 216 40 (18,3%) 89 (40,6%) 90 (41,1%) 219 55(25,1%) 97 (44,3%) 67 (30,6%) 219 7 (4,2%) 36 (21,7%) 123 (74,1%) 166 61 (36,7%) 53 (31,9%) 52 (31,3%) 166 34 (20,5%) 62 (37,3%) 70 (42,2%) 166 41 (24,7%) 70 (42,2%) 55 (33,1%) 166 8 (7,0%) 16 (14,0%) 90 (78,9%) 114 37 (32,7%) 32 (28,3%) 44 (38,9%) 113 15 (13,2%) 37 (32,5%) 62 (54,4%) 114 5 (13,3%) 56 (49,6%) 42 (37,2%) 113 1 (1,5%) 10 (15,2%) 55 (83,3%) 66 18(27,3%) 19 (28,8%) 29 (43,9%) 66 14 (21,5%) 21 (32,3%) 30 (46,2%) 65 19 (28,8%) 24 (36,4%) 23 (34,8%) 66 0,40² 0,56² 0,27² 0,17²
M ea nin gs o f o ld a ge a nd s ub jec tiv e w ell-be ing a m on g t he e lde rly 215
Continues on next page
Table 3. Elderly individuals from Campinas-SP and Belém-PA with different ages and family income levels, according to overall life satisfaction and domain-referenced satisfaction. Fibra Unicamp study, 2008-2009.
Campinas-SP Belém-PA Variable <=1 SM (n=36) 1,1-3 SM (n=218) 3,1-5 SM (n=149) 5,1-10 SM (n=111) >10 SM
(n=44) p-value
<=1 SM (n=69) 1,1-3 SM (n=232) 3,1-5 SM (n=78) 5,1-10 SM (n=50) >10 SM
(n=28) p-value
Satisfaction: life 1* 2* 3* Total Satisfaction: compared 1 2 3 Total Satisfaction: memory 1 2 3 Total Satisfaction: capacity 1 2 3 Total Satisfaction: friendships 1 2 3 Total 5 (13,9%) 10 (27,8%) 21 (58,3%) 36 2 (5,6%) 12 (33,3%) 22 (61,1%) 36 3 (8,3%) 18 (50,0%) 15 (41,7%) 36 0 (0,0%) 11 (31,4%) 24 (68,6%) 35 0 (0,0%) 6 (16,7%) 30 (83,3%) 36 10 (4,6%) 75 (34,4%) 133 (61,0%) 218 10 (4,6%) 59 (27,3%) 147 (68,1%) 216 23 (10,6%) 84 (38,9%) 109 (50,5%) 216 14 (6,5%) 57 (26,3%) 146 (67,3%) 217 7 (3,2%) 40 (18,4%) 170 (78,3%) 217 2 (1,3%) 46 (30,9%) 101 (67,8%) 149 1 (0,7%) 32 (21,6%) 115 (77,7%) 148 13 (8,7%) 55 (36,9%) 81 (54,4%) 149 3 (2.0%) 33 (22.1%) 113 (75.8%) 149 3 (2,0%) 16 (10,7%) 130 (87,2%) 149 7 (6,3%) 37 (33,3%) 67 (60,4%) 111 2 (1,8%) 23 (20,7%) 86 (77,5%) 111 9 (8,1%) 48 (43,2%) 54 (48,6%) 111 2 (1,8%) 28 (25,2%) 81 (73,0%) 111 2 (1,8%) 19 (17,1%) 90 (81,1%) 111 1 (2,3%) 11 (25,0%) 32 (72,7%) 44 0 (0,0%) 8 (18,2%) 36 (81,8%) 44 2 (4,5%) 18 (40,9%) 24 (54,5%) 44 1 (2,3%) 12 (27,3%) 31 (70,5%) 44 0 (0,0%) 11 (25,0%) 33 (75,0%) 44 0,0671 0,077² 0,801 0,221 0,29² 7 (10,1%) 23 (33,3%) 39 (56,5%) 69 7 (10,1%) 17 (24,6%) 45 (65,2%) 69 13 (18,8%) 28 (40,6%) 28 (40,6%) 69 6 (8,7%) 17 (24,6%) 46 (66,7%) 69 4 (5,8%) 14 (20,3%) 51 (73,9%) 69 12 (5,2%) 70 (30,2%) 150 (64,7%) 232 10 (4,3%) 65 (28,0%) 157 (67,7%) 232 37 (15,9%) 86 (37,1%) 109 (47,0%) 232 10 (4,3%) 62 (26,7%) 160 (69,0%) 232 11 (4,7%) 47 (20,3%) 174 (75,0%) 232
r ev . B ra s . g er ia tr . g er On tO l ., r iO de J an eir O , 2 01 6; 1 9(2 ):2 03 -2 22
Continuation of Table 3
Campinas-SP Belém-PA Variable <=1 SM (n=36) 1,1-3 SM (n=218) 3,1-5 SM (n=149) 5,1-10 SM (n=111) >10 SM
(n=44) p-value
<=1 SM (n=69) 1,1-3 SM (n=232) 3,1-5 SM (n=78) 5,1-10 SM (n=50) >10 SM
(n=28) p-value
Satisfaction: environment
1 2 3 Total
Satisfaction: health services
1 2 3 Total Satisfaction: transport. 1 2 3 Total 6 (16,7%) 10 (27,8%) 20 (55,6%) 36 6 (16,7%) 11 (30,6%) 19 (52,8%) 36 1 (2,8%) 9 (25,0%) 26 (72,2%) 36 35 (16,1%) 47 (21,6%) 136 (62,4%) 218 37 (17,1%) 54 (24,9%) 126 (58,1%) 217 20 (9,2%) 49 (22,6%) 148 (68,2%) 217 26 (17,4%) 34 (22,8%) 89 (59,7%) 149 17 (11,6%) 48 (32,7%) 82 (55,8%) 147 9 (6,0%) 29 (19,5%) 111 (74,5%) 149 14 (12,6%) 41 (36,9%) 56 (50,5%) 111 11 (9,9%) 32 (28,8%) 68 (61,3%) 111 8 (7,2%) 26 (23,4%) 77 (69,4%) 111 6 (13,6%) 11 (25,0%) 27 (61,4%) 44 8 (18,2%) 6 (13,6%) 30 (68,2%) 44 1 (2,3%) 7 (16,3%) 35 (81,4%) 44 0,231 0,231 0,591 28 (41,2%) 20 (29,4%) 20 (29,4%) 68 12 (17,4%) 31 (44,9%) 26 (37,7%) 69 14 (20,3%) 37 (53,6%) 18 (26,1%) 69 73 (31,9%) 81 (35,4%) 75 (32,8%) 229 43 (18,6%) 96 (41,6%) 92 (39,8%) 231 54 (23,4%) 110 (47,6%) 67 (29,0%) 231 31 (39,7%) 15 (19,2%) 32 (41,0%) 78 12 (15,4%) 26 (33,3%) 40 (51,3%) 78 17 (21,8%) 29 (37,2%) 32 (41,0%) 78 12 (24,0%) 16 (32,0%) 22 (44,0%) 50 9 (18,0%) 19 (38,0%) 22 (44,0%) 50 12 (24,0%) 14 (28,0%) 24 (48,0%) 50 8 (28,6%) 8 (28,6%) 12 (42,9%) 28 8 (28,6%) 5 (17,9%) 15 (53,6%) 28 3 (10,7%) 9 (32,1%) 16 (57,1%) 28 0,141 0,271 0,0101
M
ea
nin
gs o
f o
ld a
ge a
nd s
ub
jec
tiv
e w
ell-be
ing a
m
on
g t
he e
lde
rly
217
Continues on next page
Table 4. Prevalence ratios for high overall life satisfaction, when compared with moderate or low satisfaction, adjusted for gender, age and income, considering the frequency of statements (healthy and happy aging categories) made by the elderly individuals from Campinas-SP and Belém-PA. Fibra Unicamp study, 2008-2009.
Overall life satisfaction
Campinas-SP Belém-SP
Categories
High (n=400)
Low/ moderate
(n=241) p-value
p-value
PR (CI95%)
PR adjusted* (CI95%)
High (n=356)
Low/ moderate
(n=210) p-value PR (CI95%)
PR adjusted* (CI95%)
Physical Health
Yes 178 (44,5%) 114 (47,3%) 0,491 0,958 (0,787;1,167) 0,923(0,748;1,138) 218 (61,2%) 140 (66,7%) 0,201 0,918(0,742;1,136) 0,915(0,721;1,162)
Activity
Yes 64 (16,0%) 39 (16,2%) 0,951 0,995 (0,762; 1,300) 1,013 (0,763;1,346) 63 (17,7%) 26 (12,4%) 0,0931 1,152(0,878;1,513) 1,154(0,850;1,566)
Independence and autonomy
Yes 44 (11,0%) 31 (12,9%) 0,481 0,933 (0,682;1,276) 0,957 (0,693;1,322) 48 (13,5%) 37 (17,6%) 0,181 0,882(0,651;1,195) 0,823(0,583;1,162)
Cognition
Yes 3 (0,8%) 3 (1,2%) 0,68² 0,800 (0,257; 2,491) 0,634 (0,158;2,548) 14 (3,9%) 6 (2,9%) 0,501 1,118(0,655;1,907) 1,076(0,617;1,878)
Satisfaction and pleasure
Yes 121 (30,3%) 52 (21,6%) 0,0171 1,173 (0,948;1,452) 1,161 (0,923;1,462) 114 (32,0%) 50 (23,8%) 0,0371 1,155(0,924;1,443) 1,210(0,943;1,554)
Religiosity/Spirituality
Yes 48 (12,0%) 21 (8,7%) 0,191 1,130 (0,836;1,528) 1,164 (0,851;1,593) 23 (6,5%) 6 (2,9%) 0,0601 1,279(0,839;1,952) 1,192(0,739;1,922)
Self-awareness
Yes 33 (8,3%) 14 (5,8%) 0,251 1,136 (0,796;1,623) 1,043 (0,706;1,540) 22 (6,2%) 11 (5,2%) 0,641 1,064(0,691;1,638) 1,112(0,704;1,757)
Seeks personal excellence
r
ev
. B
ra
s
. g
er
ia
tr
. g
er
On
tO
l
., r
iO
de
J
an
eir
O
, 2
01
6; 1
9(2
):2
03
-2
22
Overall life satisfaction
Campinas-SP Belém-SP
Categories
High (n=400)
Low/ moderate
(n=241) p-value
p-value
PR (CI95%)
PR adjusted* (CI95%)
High (n=356)
Low/ moderate
(n=210) p-value PR (CI95%)
PR adjusted* (CI95%)
Sense of accomplishment
Yes 27 (6,8%) 24 (10,0%) 0,15² 0,837 (0,567;1,238) 0,915(0,617;1,356) 4 (1,1%) 1 (0,5%) 0,66³ 1,276(0,476;3,417) 1,220(0,453;3,291)
Harmonious family relationships
Yes 124 (31,0%) 63 (26,1%) 0,19² 1,091 (0,882;1,348) 1.084 (0.865;1.358) 53 (14,9%) 39 (18,6%) 0,251 0,901(0,673;1,207) 0,921(0,674;1,259)
Harmonious social relationships
Yes 77 (19,3%) 39 (16,2%) 0,33² 1,079 (0,841;1,383) 1,081 (0,829;1,411) 44 (12,4%) 24 (11,4%) 0,741 1,033(0,754;1,417) 0,971(0,680;1,387)
Valued and respected
Yes 22 (5,5%) 13 (5,4%) 0,95² 1,008 (0,656;1,549) 1,001 (0,630;1,590) 19 (5,3%) 8 (3,8%) 0,411 1,126(0,709;1,787) 1,119(0,675;1,854)
Offer care and be cared for
Yes 21 (5,3%) 10 (4,1%) 0,53² 1,090 (0,703;1,692) 1,060 (0,657;1,710) 8 (2,2%) 8 (3,8%) 0,281 0,790(0,392;1,593) 0,797 (0,376;1,688)
Good image
Yes - - 0,53² - 0,953 (0,731;1,244) 1 (0,3%) 1 (0,5%) 0,711 0,795 (0,112;5,655) 0,798(0,112;5,687)
Financial resources/health service
Yes 76 (19,0%) 54 (22,4%) 0,30² 0,922 (0,718;1,184) 0,953 (0,731;1,244) 52 (14,6%) 39 (18,6%) 0,211 0,893 (0,665;1,198) 0,906(0,655;1,254)
Meanings of old age and subjective well-being among the elderly 219
DISCUSSION
The decision to investigate the meaning of happiness in old age in the city of Campinas and healthy aging in Belém was random (it could have been the opposite). However, when planning the study in the two cities, we hypothesized that the responses to the two questions would be similar, since both represent a positive meaning for old age. This hypothesis was confirmed through the analysis of content, enabling us to aggregate the participants from the two samples in the subsequent quantitative analysis, despite the differences in income and well-being in the respective elderly populations.
The term mentioned most often for both ‘healthy aging’ and ‘happiness’ was “health”. Similar results have been recorded in earlier studies.17,24
Good health is the key to a long, satisfying and fulfilled life. A study of 11,523 elderly men and women (ELSA) showed that chronic illnesses were correlated with lower levels of happiness and well-being.25 In a context of decreasing
biological resilience, which is reflected in the increase of chronic illnesses and deficits in physical and cognitive function, it is clear that health and functionality are a great concern for the elderly population. Psychological resources are important health mechanisms, given that they lead to adaptable behavior and contribute to an understanding of the complex relationship between resources and personal behavior, thereby favoring successful aging throughout an individual’s life.6
Hea lt h demands i nteract w it h ot her environmental, family and social demands (and offers). In both cities, the participants claimed to be very satisfied with their family relationships and friendships, as well as their ability to solve day-to-day problems. Most of the elderly participants claimed to be satisfied with life, confirming the results obtained in a study by Rostampoor-Vajari et al.26
Carstensen et al.27 investigated the emotional
behavior of elderly individuals who, in old age, begin
to experience and show more intense emotions, avoiding negative stimulation and exhibiting less capacity to decode emotional expressions. This process is reflected in the following: a greater capacity to calibrate the effect of the intensity of events; a greater integration between cognition and affectivity; more mature defense mechanisms; more use of proactive strategies and greater life satisfaction.
As well as support, the elderly are interested in maintaining or achieving harmonious family and social relationships, as evidenced by the frequent mentions of these categories. The family seems to be of extreme importance to elderly individuals. Feeling loved by family members and friends has been correlated with a positive self-perception, happiness and healthy aging.28 Elderly individuals
who reduce their peripheral contacts, while maintaining significant emotional contact with people who are close to them, enjoy a greater subjective well-being than others.27
The participant statements showed that the elderly individuals did not isolate themselves at home. They were involved in active social community networks, where they shared friendships and exchanged support and care. Social involvement is perceived as the frequency of participation in activities that involve interactions between people. High levels of social involvement are a protective factor against physical and cognitive limitations.28
In addition, social participation has been correlated with more independent functioning in daily life, in activities and in the complex roles related to work, leisure, social life and community life. For many elderly individuals, offering support is more important than receiving support, since it involves productive social behavior that strengthens self-esteem.29
The least common theme to be mentioned was material resources, despite the fact that it has been strongly correlated with successful aging.2
The elderly recognize the relevance of money, social opportunities, environmental conditions, access to health services, comfort and safety to their well-being and independence. This may be due to the fact that they have become resistant to frustrations throughout their lives and have developed realistic aspirations, as well as the ability to control emotions. Thus, they can deal with the parsimony of these conditions in society more effectively than younger people.
Similar to earlier scientific studies, men had higher salaries than women in both cities, possibly due to educational, economic and employment disadvantages that accumulated throughout their lives. Consequently, in old age, most of the women assessed had less income than the men.
Women more often expressed a low level of satisfaction with their memory than men, confirming earlier data18 indicating that women
have a lower sense of self-efficacy for memory and cognition than men, and that their cognitive performance is indeed worse due to gender stereotypes and a lack of career opportunities.
Based on the correlations between the meanings of healthy aging and happiness in old age, it became clear that the elderly worry about staying active and independent. The oldest individuals value their independence greatly, particularly when faced with the possibility of depending on others.
Feeling happy and healthy is a reflection of the sum of an individual´s satisfaction, their physical and psychological equilibrium, their activity levels, values, the meaning of life, their perception of new possibilities and feelings, as well as their strength and active participation in society. Thus, the category satisfaction and pleasure was significantly correlated with life satisfaction, suggesting its relevance to our considerations of aging well. People who can manage their own life and determine when, where and how they
will engage in leisure activities, social events and work, consider themselves, and are considered by others, as healthy or successful. Studies indicate that 67.5% of the variations in happiness occur at an intrapersonal level, which in the case of the elderly, could be partly attributed to the time they spend performing different activites.30
The selection of elderly individuals with no cognitive deficits and the requirement for the elderly participants to make their own way to the data collection centers may have led to a survival bias in the present study. In other words, there was a strong possibility that only successful elderly individuals (in physical, emotional and cognitive terms) would participate in the research. Future studies should seek to obtain data from elderly individuals with other health conditions, based on recruitment in different contexts.
CONCLUSION
For the elderly participants of the present study, healthy aging meant more than simply being healthy. It also involved their psychological well-being and interpersonal relationships. The elderly understand healthy aging to be a process that is a consequence of the balance between their functional capacity, cognitive function, memory, happiness, autonomy, lifestyle and individual constructions, as well as affective and social dynamics.
Meanings of old age and subjective well-being among the elderly 221
REFERENCES
1. Rowe JW, Kahn RL. Successful aging. New York: Pantheon; 1998.
2. George LK. Still happy after all these years: research frontiers on subjective well-being in later life. J Gerontol Ser B Psychol Sci Soc Sci 2010;62(3):331-9. 3. Ryff CD. Beyond Ponce de Leon and life satisfaction:
new direction in quest of successful aging. Int J Behav Dev 1989;12(1):35-55.
4. Diener E, Suh EM, Lucas RE, Smith HL. ‘Subjective well-being: three decades of progress.’ Psychol Bull 1999;125(2):276-302.
5. Sadler ME, Miller CJ, Christsen K, McGue M. Subjective wellbeing and longevity: a co-twin control study. Twin Res Hum Genet 2011;14(3):249-56. 6. Sargent-Cox KA, Butterworth P, Anstey KJ. Role of
physical activity in the relationship between mastery and functional health. Gerontologist 2015;55(1):120-31. 7. Rymkiewicz PD, Heng YX, Vasudev A, Larbi A. The
immune system in the aging human. Immunol Res 2012;53(1-3):235-50.
8. Daig I, Herschbach P, Lehmann A, Knoll N, Decker O. Gender and age differences in domain-specific life satisfaction and the impact of depressive and anxiety symptoms: a general population survey from Germany. Qual Life Res 2009;18:669-78.
9. Baird BM, Lucas RE, Donnellan MB. Life satisfaction across the lifespan: findings from two nationally representative panel studies. Soc Indic Res 2010;99(2):183-203.
10. Meléndez JC, Tomás JM, Oliver A, Navarro E. Psychological and physical dimensions explaining life satisfaction among the elderly: a structural model examination. Arch Gerontol Geriatr 2009;48:291-95. 11. Schilling O. Development of life satisfaction in old
age: another view on the “paradox”. Soc Indic Res 2006;75:241-71.
12. Phelan EA, Anderson LA, LaCroix AZ, Larson EB. Older adults’ views of “successful aging”: How do they compare with researchers’ definitions? J Am Geriatr Soc 2004;52(2):211-6.
13. Oliveira INDAO, Neri AL. Envelhecimento bem-sucedido: uma meta no curso da vida. Psicol USP 2008;19(1):81-94.
14. Vilela ABA, Carvalho PAL, Araújo RT.
Envelhecimento bem-sucedido: representação de idosos. Rev Saúde Com 2006;2(2):101-14.
15. Deponti RN, Acosta MAF. Compreensão dos idosos sobre os fatores que influenciam no envelhecimento saudável. Estud Interdiscip Envelhec 2010;15(1):31-50. 16. Cupertino APFB, Rosa FHM, Ribeiro PCC. Definição
de envelhecimento saudável na perspectiva de indivíduos idosos. Psicol Reflex Crít 2007;20(1):81-6. 17. Martins MRC, Camargo VB, Biasus F. Representações
sociais dos idosos e da velhice de diferentes faixas etárias. Univ Psychol 2009;8(3):831-47.
18. Neri AL, Yassuda MS, Araújo LF, Eulálio MC, Cabral BE, Siqueira MEC, et al. Metodologia e perfil sociodemográfico, cognitivo e de fragilidade de idosos comunitários de sete cidades brasileiras: Estudo FIBRA. Cad Saúde Pública 2013;29(4):778-92. 19. Instituto Brasileiro de Geografia e Estatística. Síntese
de indicadores sociais: uma análise das condições de vida da população brasileira. Rio de Janeiro: IBGE; 2010 [acesso em 12 mai 2012]. (Estudos & Pesquisas: Informação demográfica e socioeconômica). Disponível em: www.ibge.gov.br.
20. Fried L, Tangen C, Walston J, Newman A, Hirsch C, Gottdiener J, et al. Frailty in older adults: evidence for a phenotype. J Gerontol Ser A Biol Sci Med Sci 2001;56:146-56.
21. Brucki S, Nitrini R, Caramelli P, Bertolucci P, Okamoto I. Sugestões para o uso do Mini-Exame do Estado Mental no Brasil. Arq Neuropsiquiatr 2003;61(3B):777-81.
22. Bardin L. Análise de conteúdo. Lisboa: Edições 70; 1970.
23. Neri AL. Bienestar subjetivo em la vida adulta y em la vejez: hacia una psicologia positiva em America Latina. Rev Latinoam Psicol 2002;34(1-2):55-74. 24. Doyle YG, McKee M, Sherriff M. A model of
successful ageing in British populations. Eur J Public Health 2012;22(1):71-6.
25. Wikman A, Wardle J, Steptoe A. Quality of life and affective well-being in middle-aged and older people with chronic medical illnesses: a cross-sectional population based study. PLoS One 2011;6(4):1-9. 26. Rostampoor-Vajari M, Abedini S, Pourjabali R. The
triangle, quality health and life satisfaction in elderly. J Sci 2012;1(3):55-8.
28. Thomas P. Is better to give or to receive?: Social support and the well-being of older adults. J Gerontol Ser B Psychol Sci Soc Sci 2011,65(3):351-7.
29. Park J, Kitayama S, Karasawa M, Curhan K, Markus HR, Kawakami N, et al. Clarifying the links between social support and health: culture,
stress, and neuroticism matter. J Health Psychol 2013;18(2):226-35.
30. Oerlemans WGM, Bakker AB, Veenhoven R. Finding the key to happy aging: a day reconstruction study of happiness. J Gerontol Ser B Psychol Sci Soc Sci 2011;66(6):665-74.