O
ri
gi
na
l
a
rt
ic
le
s
Analysis of methods for detecting sarcopenia in independent
community-dwelling elderly women
Jéssica Alves de Paula1
Eduardo Luiz Wamser1
Anna Raquel Silveira Gomes1
Silvia Regina Valderramas1
João Cardoso Neto2
Maria Eliana Madalozzo Schieferdecker1
1 Universidade Federal do Paraná, Setor de Ciências da Saúde, Hospital de Clínicas, Programa de Residência
Integral Multiprofissional em Atenção Hospitalar. Curitiba-PR, Brasil.
2 Universidade Federal do Paraná, Setores de Tecnologia e de Ciências Exatas, Programa de Pós-graduação
em Métodos Numéricos em Engenharia. Curitiba-PR, Brasil.
Correspondence
Maria Eliana Madalozzo Schieferdecker E-mail: [email protected]
Abstract
Introduction: Aging imposes changes in the body composition of individuals. One of the most striking changes during this period is the progressive loss of mass, strength and muscle function, known as sarcopenia. Objectives: To evaluate the presence of sarcopenia in healthy elderly women living in the community through a combination of different methods to assess muscle mass (MM) and physical performance, as well as analyzing whether there is correlation between the different methods of defining sarcopenia.
Methods: A cross-sectional study was performed of 37 older adults of the Universidade Aberta da Maturidade (Open University for Mature Persons). The parameters used to assess MM were calf circumference (CC) and skeletal muscle mass (SMM) through bioelectrical impedance (BIA) and the skeletal muscle index (SMI) Handgrip strength (HS) using a manual dynamometer, gait speed (GS) over 10m and the timed up and go (TUG) test for functional mobility were used to measure physical performance. To compare the sarcopenia diagnostic methods four different combinations were employed: C1= SMI+HS+GS; C2= SMI+HS+TUG; C3= CC+HS+GS and C4= CC+HS+TUG, according to European consensus proposals. To verify the differences between the methods the Kruskal-Wallis test and Multiple Comparisons for Unpaired Data were applied, and the weighted Kappa coefficient was used to assess the degree of agreement.
Results: The C1 and C2 combinations identified pre-sarcopenia, sarcopenia and severe sarcopenia. A close correlation between C1 and C2 was found (0.92), while C3 and C4 did not identify the presence of sarcopenia in the elderly women. Conclusion: CC used to evaluate MM was not precise in the detection of sarcopenia in overweight elderly women. However, there was a strong agreement between the two combinations using SMI and GS or TUG, suggesting that both can be effectively applied in clinical practice.
INTRODUCTION
The concept that the aging process modifies the body composition of individuals is central to the transition of population aging. One of the most striking characteristics of this period is the gradual decline of muscle function.1 The European Working Group on Sarcopenia in Older People (EWGSOP) states that sarcopenia is a geriatric syndrome that is characterized by a progressive decrease in mass, strength and muscle function.2
This syndrome has negative impacts on the health of elderly individuals. The correlation between reduced mass and muscle strength results in a higher risk of falls, hospitalization, dependence and institutionalization, with a lower quality of life and mortality.3,4 In addition to these aspects, sarcopenia has severe social and economic repercussions for the elderly.5
A diagnosis of sarcopenia should be based on the confirmation of a low quantity of muscle mass (criterion 1), together with one of the following options: low muscle strength (criterion 2) or poor functional performance (criterion 3). Furthermore, the different stages of the illness should also be classified: pre-sarcopenia (criterion 1); sarcopenia (criteria 1+2 or 3) and severe sarcopenia (criteria 1+2+3).2
Concerning the assessment of muscle mass prior to a diagnosis of sarcopenia, it has been established that a sarcopenic individual exhibits two standard deviations below muscle mass, when compared with young adults, in image analysis tests (dual energy X-ray absorptiometry-DXA), and/or magnetic resonance imaging (MRI); or a calf circumference (CC) of less than 31 centimeters (cm).2 Although DXA is the gold standard for assessing body composition, given that it quantifies the fat content, lean body mass and bone mass in the body, an earlier study used indirect estimates to assess body composition with anthropometric data, such as the body mass index (BMI), and recorded results that were very similar to the DXA.6
Until now, only two studies have addressed the profile of sarcopenia in Brazil, although neither compared diagnostic methods.7,8 Therefore, the aim of the present study was to determine the presence of sarcopenia in healthy community-dwelling elderly women using combinations of different methods to assess muscle mass and physical performance, as well as to determine if there was concordance between the combinations in relation to the definition of sarcopenia.
METHODS
Sample
A cross-sectional study was conducted with 37 healthy elderly women who volunteered to participate and were members of the Universidade Aberta da Maturidade (the Open University for Mature Persons) (UAM) of the Universidade Federal do Paraná (Parana Federal University) (UFPR) in Curitiba-PR. The 46 elderly women who were enrolled in this program at the time of the study were all invited. The sample calculation was determined considering a power of 0.80, assuming an effect size of 0.8 and a type I error of 0.05 (alpha).
Prior to the data collection, the project received approval from the Research Ethics Committee of the Faculdade Evangélica Beneficente de Curitiba under protocol number 266.178/13. The project presentation and oral invitations were performed by team members in the rectory of the UFPR during UAM meetings. The assessments of the elderly participants were conducted in the Physical Education Department of UFPR in Curitiba-PR. All of the participants were instructed concerning the procedures involved in the research and signed a Termo de Consentimento Livre e Esclarecido - Free and Informed Consent Form.
the body and the ability to perform all of the proposed tests [timed up and go (TUG), handgrip strength (HGS) and gait speed (GS)]. The data was collected on two separate days. On the first day, anamnesis was carried out, and on the second day, the participants were submitted to the tests.
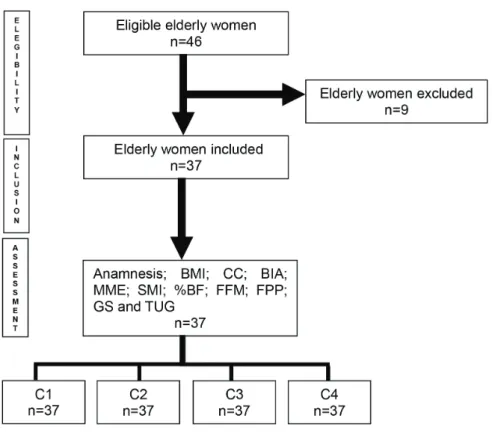
Initially, 46 elderly women were selected. However, nine of these were excluded (six had a pacemaker or a metallic implant in their body and three could not complete the functional performance tests adequately). Therefore, 37 elderly women were included in the present study (Figure 1).
BMI= body mass index; CC= calf circumference; BIA= bioelectrical impedance; SMM= skeletal muscle mass; SMI= skeletal muscle index; BF= body fat; FFM= fat-free mass (FFM); HGS= handgrip strength; GS= gait speed; TUG= timed up and go; C1= SMI+HGS+GS; C2= SMI+HGS+TUG; C3= CC+HGS+GS and C4 = CC+HGS+TUG.
Figure 1. Flowchart of the data collection process. Curitiba-PR, 2013.
Data was collected between May and September of 2013. A questionnaire was first applied to determine the profile of the sample. This questionnaire contained personal information, comorbidities and medication used. Individuals who used five or more drugs concomitantly were considered to be polymedicated.10
Subsequently, the elderly individuals were submitted to an anthropometric assessment by a nutritionist and a functional assessment by a
physical educator, together with previously trained physiotherapy students.
Anthropometric assessment
The BMI was obtained from the ratio between body weight in kilograms and height in meters squared (BMI=weight/height²). Nutritional status was classified according to the Pan American Health Organization`s Health, Well-being and Aging project (SABE).11
CC was measured using an inelastic tape measure, usually on the right leg, while the individual sat in a chair with their hips and knees flexed to 90º. A value of less than 31 centimeters was used to indicate the depletion of muscle mass.2
Body composition
The body composition assessment was carried out using a portable bioelectrical impedance four-pole standard apparatus (RJL Systems®, model Quantum BIA 101Q). The criteria proposed in the manual were followed during the performance of the examination. The resistance values found were used to calculate skeletal muscle mass (SMM), using the following formula: SMM= [(h2/R x 0.401) + (gender x 3.825) + (age x -0.071)] + 5.102 (Janssen et al.,12), in which h is the height in centimeters, “R” is the resistance value in ohm, women=0 and age is counted in years. Consequently, it was possible to obtain the skeletal muscle index (SMI) by dividing the SMM by height squared. An SMI equal to or less than 6.75 kg/m² was considered the cutoff for low muscle mass, based on the statistical analysis from the NHANES III study, which assessed men and women aged 60 years or more.3
In order to calculate the percentage of body fat (%BF), the formula proposed by Roubenoff et al.13 (5.741+0.4551 x h2/R50+0.1405 x weight+0.0573 x Xc+6.2467 x gender) was first applied to determine the amount of fat free mass (FFM), considering height in centimeters, “R50” as the resistance value, 50 kHz as the frequency value, weight in kilograms, “Xc” as the reactance value in ohms; female gender=0 and age in years. Subsequently, the total body mass was subtracted from the FFM.
Assessment of functional performance
Handgrip strength was assessed in kilograms (kg) using a Saehan manual hydraulic dynamometer
(Saehan corporation - SH5001). The elderly women were seated with no arm support and with their shoulders adducted and in neutral rotation. Their elbows were flexed to 90°, with the forearm in a neutral position and the wrist varying from 0 to 30º of extension, as recommended by the American Society of Hand Therapists (ASHT).14 Three measurements were collected for each arm, with one minute of rest between each reading. The highest value recorded was used, as was the classification criteria suggested by Lauretani et al.15
Two tests of physical performance were used: gait speed (GS) and the timed up and go (TUG) test. In the former, the participant was asked to walk a distance of 10 meters in a straight line. The time required to complete the walk was divided by the distance, providing a measurement for gait speed (m/s). This test was conducted three times to allow the participant to accelerate and decelerate. They were asked to walk normally, even when using walking aids.16 A speed of less than 0.8 m/s was considered a risk for sarcopenia.2,15
The second test required the participant to lift themselves from a chair without using their arms and walk three meters at a comfortable, safe pace, before turning around, walking back and sitting down again. The test was performed twice: the first attempt was used to familiarize the participants with the task, and the second was used to record the time (in seconds).17 The following reference scores were used to analyze their performance in the TUG test: 8.1 s (60-69 years); 9.2 s (70-79 years) and 11.3s (80-99 years).18
Sarcopenia
were used to assess muscle mass and physical performance (Chart 1). In C1, the SMI was used together with HGS and GS; in C2, we used the SMI, HGS and TUG test; in C3, the CC, HGS
and GS were used; and in C4, the CC, HGS and TUG test were used. EWGSOP parameters were used to define the stage of sarcopenia (Chart 2).2
Statistical analysis
Data analysis was conducted using version 2.11.1 of R (2010-5-31) and Statgraphics Centurion software. Microsoft Excel® was used to compile the data. The Kruskal-Wallis test and multiple comparisons for unpaired data were used to investigate the differences between the three diagnostic methods. Subsequently, the weighted Kappa coefficient was used to assess the degree of concordance between the methods. The confidence interval used was 95% and the level of significance was set at 5% (p≤0.05).
RESULTS
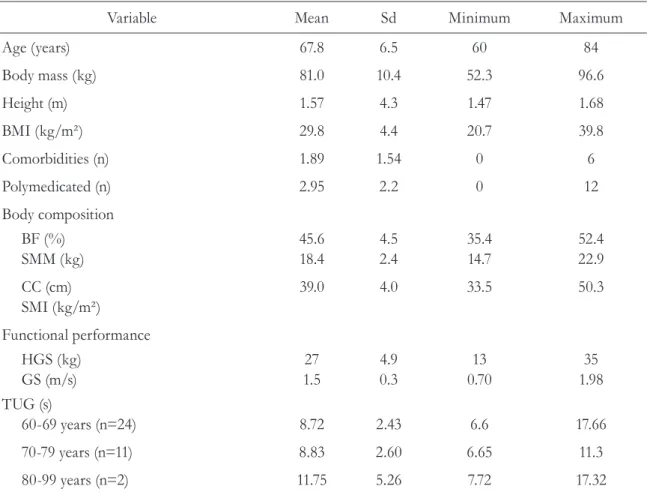
The sample contained 37 elderly women aged between 60 and 84 years of age. Table 1 displays their demographic, clinical and anthropometric characteristics, as well as the body composition results (assessed using BIA). The mean results referring to their performance in the functional tests are also displayed (mean, standard deviation and amplitude).
Most of the elderly women were overweight (67.56%), while 27.02% were classified as eutrophic.
Chart 1. Combinations used to diagnose sarcopenia in the elderly women in the sample. Curitiba-PR, 2013.
Muscle mass Muscle strength Physical performance
C1 SMI HGS GS
C2 SMI HGS TUG
C3 CC HGS GS
C4 CC HGS TUG
C1, 2, 3 and 4= combinations; SMI= skeletal muscle index; CC= calf circumference; HGS= handgrip strength; GS= gait speed; TUG= timed up and go.
Chart 2. Stages of sarcopenia. Curitiba-PR, 2013.
Stage Muscle mass Muscle strength Physical performance
Pre-sarcopenia ↓
Sarcopenia ↓ ↓ or ↓
Severe sarcopenia ↓ ↓ and ↓
The participants claimed to have up to six health problems, the most common of which were systemic arterial hypertension (SAH), dyslipidemia and arthrosis, with 43.24%, 27.02% and 24.32%,
respectively. After assessing the number of medications used by the participants, 16.21% of the women were classified as polymedicated.
Sarcopenia
It was c lea r t h at combi n at ions C1 (SMI+HGS+GS) and C2 (SMI+HGS+TUG) differed in terms of the definition of pre-sarcopenia and pre-sarcopenia: whereas C1 only
identified one sarcopenic individual (2.70%), C2 identified seven (18.91%). When CC was used to assess muscle mass, 100% of the sample was classified as non-sarcopenic (Figure 2), regardless of whether GS (C3) or the TUG test (C4) was used to assess functional performance.
Table 1. Sample characterization and results of functional tests. Curitiba-PR, 2013.
Variable Mean Sd Minimum Maximum
Age (years) 67.8 6.5 60 84
Body mass (kg) 81.0 10.4 52.3 96.6
Height (m) 1.57 4.3 1.47 1.68
BMI (kg/m²) 29.8 4.4 20.7 39.8
Comorbidities (n) 1.89 1.54 0 6
Polymedicated (n) 2.95 2.2 0 12
Body composition BF (%) SMM (kg)
45.6 18.4
4.5 2.4
35.4 14.7
52.4 22.9
CC (cm) SMI (kg/m²)
39.0 4.0 33.5 50.3
Functional performance HGS (kg)
GS (m/s) TUG (s)
60-69 years (n=24)
27 1.5
8.72
4.9 0.3
2.43
13 0.70
6.6
35 1.98
17.66
70-79 years (n=11) 8.83 2.60 6.65 11.3
80-99 years (n=2) 11.75 5.26 7.72 17.32
BMI= body mass index; BF= body fat; SMM= skeletal muscle mass; SMI= skeletal muscle index; CC= calf circumference; HGS= handgrip
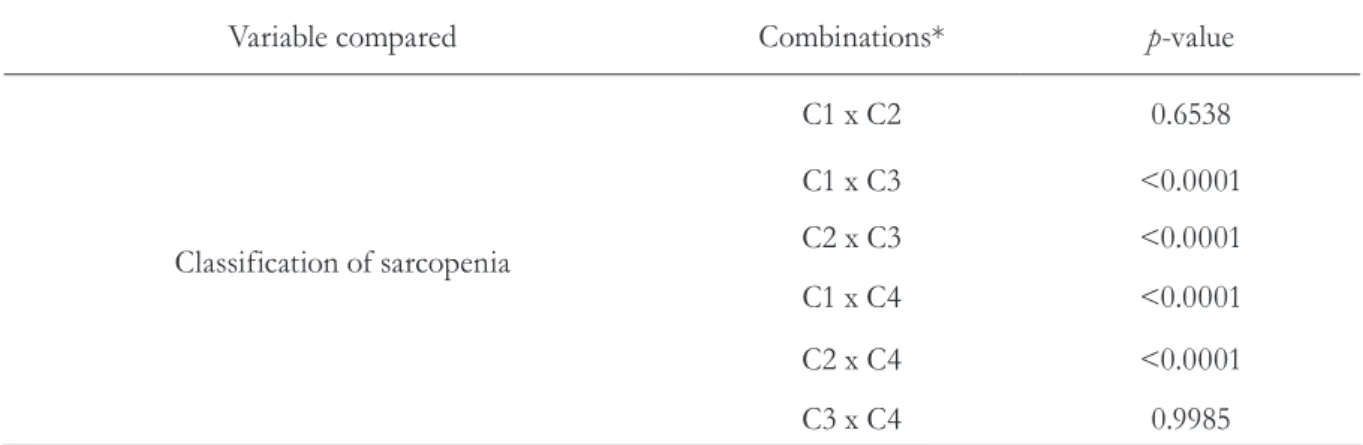
When comparing the combinations to identify sarcopenia, significant differences were found between C1, C2, C3 and C4 (p<0.0001). Consequently, the multiple comparisons tests found no significant differences between C3 (CC+HGS+GS) and C4 (CC+HGS+TUG) or between C1 and C2. For the other combinations
(C1xC3, C2xC3, C1xC4, C2xC4), there was a clear and obvious difference.
After the application of the weighted Kappa test, a moderate concordance was found between C1 and C2 (k=0.60), whereas a high concordance was found between C3 and C4 (k=1.0) (Table 2).
The ordinate represents the percentage of elderly women according to the stage of sarcopenia. Abscissa: C1 (SMI+HGS+GS); C2 (SMI+HGS+TUG); C3 (CC+HGS+GS) and C4 (CC+HGS+TUG). SMI= skeletal muscle index; CC= calf circumference; HGS= handgrip strength; GS= gait speed; TUG= timed up and go.
Figure 2. Prevalence of sarcopenia according to C1, C2, C3 & C4. Curitiba-PR, 2013.
Table 2. Multiple comparisons between different methods of identifying sarcopenia in independent elderly individuals. Curitiba-PR, 2013.
Variable compared Combinations* p-value
Classification of sarcopenia
C1 x C2 0.6538
C1 x C3 <0.0001
C2 x C3 <0.0001
C1 x C4 <0.0001
C2 x C4 <0.0001
C3 x C4 0.9985
DISCUSSION
According to the results of the present study, the elderly women assessed exhibited a high percentage of body fat and were classified as obese, given that the value recorded was higher than 38%.19 It is known that the peaks of adipose tissue occur between 60 and 70 years of age, and that this body fat is distributed differently, when compared with the young population.20 Changes in eating habits and a reduction in the levels of physical activity are the main reasons for this nutritional transiton.21
Concerning muscle mass, the mean SMI recorded indicated a high quantity of muscle mass. Previous studies have documented the existence of a dissociation between muscle mass and strength: the decline in strength seems to be much faster than the concomitant loss of muscle mass. This reduction in strength due to aging is known as “dynapenia” and can have an effect on physical performance.22
According to the recommendations proposed by consensus in 2010 for sarcopenia assessments, the results of the present study indicate that the mean CC (used to assess muscle mass) did not identify the presence of sarcopenia in these independent community-dwelling elderly women. Nevertheless, the World Health Organization (WHO) considers CC to be a sensitive measurement of muscle mass in elderly individuals, which indicates age-related alterations and a reduction in physical activity. A CC of less than 31 centimeters has previously been correlated with incapacity. A correlation has also been reported between an elevated CC and lower levels of frailty and better functional performance.23-25
Since the majority of the elderly participants in the present study were classified as obese, it can be deduced that they exhibited CC values above the limit of the reference. Consequently, this measurement may have been affected by the excess of subcutaneous fat, given that there was a positive correlation between the CC and the BMI.26
Very few studies have validated anthropometric measurements for obese elderly individuals.
Consequently, these methods are vulnerable to errors and questionable for individual use. Despite clinical recommendations related to the use of anthropometric measurements to identify sarcopenia, the outcomes of the present study confirmed that the CC could not effectively identify sarcopenia, even when considering the HGS and functional performance during screening.2
Conversely, the values obtained through BIA in the present study (assessment of muscle mass) identified participants with pre-sarcopenia, sarcopenia and severe sarcopenia. Using BIA to analyze body composition is relatively practical, non-invasive, fast and inexpensive, when compared with magnetic resonance, computed tomography and DXA, which ae considered more accurate methods.27,28 A previous study reported the excellent correlation between results obtained using the BIA equation and results obtained with DXA.29
The difference in the prevalence of sarcopenia exhibited by C1 and C2 could be explained by the fact that alternative methods were used to investigate physical performance. Both the GS test and the TUG test are valid and can be used clinically (and in research) to assess sarcopenia, survival, functional mobility and the risk of falls in community-dwelling elderly individuals.17,30 The prevalence of sarcopenia varies depending on the methods used to define the diagnosis. Bijlsma et al.31 used seven different diagnostic criteria for sarcopenia, based on measurements of muscle mass (BIA or DXA) and HGS. The authors noted that the criteria based on a low HGS and a low quantity of SMM differed greatly from the criteria based on appendicular lean mass (ALM). Furthermore, there was a difference in the prevalence of sarcopenia between diagnostic methods that use the quantity of ALM, with different cutoff points. One of these methods resulted in the absence of sarcopenia. Therefore, studies should clearly state the methodological criteria used to diagnose sarcopenia, until a clinical/scientific consensus is found. This will also enable comparisons between studies.
(in association with either GS or the TUG test) can be considered as an option when screening community-dwelling elderly women for sarcopenia.
Concerning the functional tests, only two participants exhibited a GS below that which is recommended by EWGSOP2 (<0.8m/s). One of these participants was the oldest participant in the study (84 years) and was the only women to be classified with severe sarcopenia, due to the fact that she met all of the diagnostic criteria. According to Buchner et al.,32 gait speed declines with age, but there is a non-linear correlation between the strength of the lower limbs and normal gait speed. This correlation represents the mechanism through which minor alterations in physiological capacity can have substantial effects on the performance of frail adults, whereas major alterations in healthy adults have little or no effect on their daily function. Results from other studies of frail adults have also shown that resistance training led to improvements in GS and strength.33 In healthy community-dwelling adults, this training increased strength but did not affect GS.34
Since gait is considered a complex motor task, it depends on different physical abilities, requiring energy, motor control, strength, muscle power and cardiorespiratory fitness.35 The elderly women who participated in the present study exhibited a satisfactory muscle function, which could explain the adequate gait speed recorded. However, the woman who was considered “very old” (80+) exhibited impaired gait speed and a handgrip strength value below the reference value. She also had a history of falls. These aspects suggest a correlation between advancing age, a decrease in muscle strength and an increase in the risk of falls.36
Concerning HGS, only two of the participants had results below 20 kg. The inverse correlation between FFP and age is consistent with literature.37
During the performance analysis of the different age groups, it was found that those aged 60-69 years and 80-99 years performed worse in the TUG test. This could be attributed to a moderately active physical activity profile, based on previous results from this research group.38
Conversely, the performance in the TUG test did not classify the participants as a risk for falls, given that they recorded mean values of less than 12.4 s.17 It is possible to hypothesize that the performance in the TUG test was worse among the 60-69 years age group, when compared with the 70-79 years age group, due to the existence of more comorbidities. In a recent study, the association of low muscle mass and chronic illnesses contributed to a greater impairment of physical performance in elderly individuals, when compared to isolated factors.39As for the worse performance of the 80-99 years age group in the TUG test, this was probably due to the decrease in strength and power of the lower limbs, which was also reported in a previous study of community-dwelling elderly individuals from the same age group.40 However, the present study only assessed handgrip strength. Thus, further studies should be conducted to assess the strength and muscle potential of the lower limbs using an isokinetic dynamometer.
In the present study, the mean age was approximately 68 years. C2 provided 21.62% of the sarcopenic elderly women (including sarcopenia and severe sarcopenia). Notably, the 84-year old woman was the only participant with severe sarcopenia in both C1 and C2.
Similarly, one of the most cited studies, the New Mexico Elderly Health Survey, which assessed the SMM and diagnosed sarcopenia, reported a prevalence rate of between 13 and 24% for sarcopenia among male and female participants (70 years or less). In the same study, the percentage altered to more than 50% among individuals aged 80 years or more, demonstrating that the prevalence of sarcopenia is positively correlated with age.17
based on GS. The authors reported that 77.9% of the women were not sarcopenic.41
There are a number of limitations in the identification and classification of sarcopenia. Despite the fact that the BIA is a validated method, it is not considered the gold standard for assessments of muscle mass, and it can be affected by hydration, particularly in the elderly. The use of different equations for different devices may also contribute to different parameters of body composition.42
Concerning physical performance, the European consensus does not specifically recommend one method of assessing gait speed. There are several methodological variations in the performance of this test, such as the inclusion or exclusion of the acceleration and deceleration phases. It also has not provided cutoff points for the TUG test. However, cutoff points have been outlined for Brazilian community-dwelling elderly individuals (per age group).These values were used in the present study. 17
It is also important to consider that reductions in muscle mass and function may be accompanied by an increase in fat mass during the aging process. This condition is currently known as sarcopenic obesity. This could be an important aspect in future studies seeking to identify obese sarcopenic elderly women. Baumgartner et al.43 conducted an eight-year study and showed that the sarcopenic and obese population is three times more likely to develop functional disabilities related to activities of daily living, when compared with those who are only sarcopenic or only obese.
Sarcopenia has been classified in many different ways in literature and even by EWGSOP.2
Doubts remain about the correct criteria for its classification. Therefore, further controlled studies are required to standardize the diagnostic criteria for this syndrome.
CONCLUSION
In the sample investigated, there were clear differences in the identification of sarcopenia depending on the methods used to assess muscle mass and physical performance. Calf circumference, as a measurement of muscle mass, is vulnerable to errors when diagnosing sarcopenia in overweight elderly women. However, the high concordance between the diagnostic methods that used the skeletal muscle index to classify muscle mass, together with gait speed or the timed up and go test to assess physical performance, recommend the use of both for sarcopenia screening in clinical practice.
ACKNOWLEDGEMENTS
The authors would like to thank the Universidade Aberta da Maturidade the (Open University for Mature Persons) and its coordinator Emília Von der Heyde; Dr. Suely Teresinha Schmidt, from the Department of Nutrition in the UFPR, for providing the location and equipment for the nutritional assessments; the Hospital de Clínicas/UFPR (the Clinical Hospital/ UFPR); the Faculdade Evangélica do Paraná; the Faculdade Dom Bosco and the Conselho Nacional de Desenvolvimento Científico e Tecnológico (National Council for Scientific and Technological Development) (CNPq) for the grant provided to Dr. Anna Raquel Silveira Gomes (process no. 308696/2012-3).
REFERENCES
1. Farinatti PTV. Envelhecimento, promoção da saúde e exercício: bases teóricas e metodológicas. 1ª ed. Barueri: Manole; 2008. Aspectos fisiológicos da aptidão física no envelhecimento: função neuromuscular – força e flexibilidade. p. 89-106.
3. Janssen I, Baumgartner RN, Ross R, Rosenberg IH, Roubenoff R. Skeletal muscle cut-points associated with elevated physical disability risk in older men and women. Am J Epidemiol 2004;159(4):413-21.
4. Visser M, Goodpaster BH, Kritchevsky SB, Newman AB, Nevitt M, Rubin SM, et al. Muscle mass, muscle strength, and muscle fat infiltration as predictors of incident mobility limitations in well functioning older persons. J Gerontol Ser A Biol Sci Med Sci 2005;60(3):324-33.
5. Janssen I, Shepard DS, Katzmarzyk PT, Roubenoff R. The Healthcare Costs of Sarcopenia in the United States. J Am Geriatric Soc 2004;52(1):80-5.
6. Shaw KA, Srikanth VK, Fryer JL, Blizzard L, Dwyer T, Venn AJ. Dual energy X-ray absorptiometry body composition and aging in a population-based older cohort. Int J Obes 2007;31(2):279-84.
7. Alexandre TS, Duarte YA, Santos JL, Wong R, Lebrao ML. Prevalence and associated factors of sarcopenia among elderly in Brazil: findings from the SABE study. J Nutr Health Aging 2014;18(3):284-90.
8. Barbosa-Silva TG, Bielemann RM, Gonzalez MC, Menezes AMB. Prevalence of sarcopenia among community-dwelling elderly of a medium-sized South American city: results of the COMO VAI? Study. J Cachexia Sarcopenia Muscle 2015;6:1-8.
9. World Health Organization. The uses of epidemiology in the study of the elderly. Geneva: WHO; 1984.
10. Hohl CM, Dankoff J, Colacone A, Afilalo M. Polypharmacy adverse drug-related events, and potential adverse drug interactions in elderly patients presenting to an emergency department. Ann Emerg Med 2001;38(6):666-71.
11. Lebrão ML, Duarte YAO. Saúde, Bem-estar e Envelhecimento (SABE). O Projeto Sabe no município de São Paulo: uma abordagem inicial. Brasília, DF: Organização Pan-Americana da Saúde; 2003.
12. Janssen I, Heymsfield SB, Baumgartner RN, Ross R. Estimation of skeletal muscle mass by bioelectrical impedance analysis. J Appl Physiol 2000; 89(2): 465-71.
13. Roubenoff R, Baumgartner RN, Harris TB, Dallal GE, Hannan MT, Economos CD, et al. Application of bioelectrical impedance analysis to elderly population. J Gerontol Ser A Biol Sci Med Sci 1997;52:129-36.
14. Desrosiers J, Bravo G, Hébert R, Dutil E. Normative data for grip etrength of elderly men and women. Am J Occup Ther 1995;49(7):637-44.
15. Lauretani F, Russo CR, Bandinelli S, Bartali B, Cavazzini C, Di Iorio A, et al. Age-associated changes in skeletal muscles and theireffect on mobility: an operational diagnosis of sarcopenia. J Appl Physiol 2003;95(5):1851-60.
16. Graham JE, Ostir GV, Fisher SR, Ottenbacher KJ. Assessing walk speed in clinical research: a systematic review. J Eval Clin Pract 2008;14(4):552-62.
17. Alexandre TS, Meira DM, R ico NC, M izuta SK. Accuracy of Timed Up and Go Test for screening risk of falls among community-dwelling elderly. Rev Bras Fisioter 2012;16(5):381-8.
18. Bohannon RW. Reference values for the timed up and go test: a descriptive meta-analysis. J Geriatr Phys Ther 2006;29(2):64-8.
19. Baumgartner RN, Koehler KM, Gallagher D, Romero L, Heymsfield SB, Ross RR, et al. Epidemiology of sarcopenia among the elderly in New Mexico. Am J Epidemiol 1998;147:755-63.
20. Hajek A, Lehnert T, Ernst A, Lange C, Wiese B, Prokein J, et al. Prevalence and determinants of overweight and obesity in old age in Germany. BMC Geriatr 2015;15:1-13.
21. Instituto Brasileiro de Geografia e Estatística. Análise do consumo alimentar pessoal no Brasil [Internet]. POF 2008/2009. Rio de Janeiro: IBGE; 2011 [acesso em 28 jul. 2015]. Disponível em: http://www.ibge.gov.br/home/estatistica/ populacaocondicaodevida/pof/2008_2009_analise_ consumo/pofanalise_2008_2009.pdf.
22. Manini TM, Clark BC. Dynapenia and aging: an update. J Gerontol Ser A Biol Sci Med Sci 2012;67(1):28-40.
23. World Health Organization. Physical status: the use and interpretation of anthropometry. Geneva: WHO; 1995. p. 375-409. (Technical Report Series, n. 854)
24. Rolland Y, Lauwers-Cances V, Cournot M, Nourhashémi F, Reynish W, Rivière D, et al. Sarcopenia, calf circumference, and physical function of elderly women: a cross-sectional study. J Am Geriatr Soc 2003;51:1120-4.
25. Landi F, Onder G, Russo A, Liperoti R, Tosato M, Martone AN, et al. Calf circumference, frailty and physical performance among older adults living in the community. Clin Nutr 2013;33(3):1-36.
27. Lustgarten MS, Fielding RA. Assessment of analytical methods used to measure changes in body composition in the elderly and recommendations for their use in phase II clinical trials. J Nutr Health Aging 2011;15(5):368-75.
28. Norgan NG. Laboratory and field measurements of body composition. Public Health Nutr 2005;8(7A):1108-22.
29. Bosaeus I, Wilcox G, Rothenberg E, Strauss BJ. Skeletal muscle mass in hospitalized elderly patients: comparison of measurements by single-frequency BIA and DXA.Clin Nutr 2014 33(3):426-31.
30. Lopopolo RB, Greco M, Sullivan D, Craik RL, Mangione KK. Effect of therapeutic exercise on gait speed in community-dwelling elderly people: a meta-analysis. Phys Ther 2006;86(4):520-40.
31. Bijlsma AY, Meskers CGM, Ling CHY, Narici M, Kurrle SE, Cameron ID, et al. Defining sarcopenia: the impact of different diagnostic criteria on the prevalence of sarcopenia in a large middle aged cohort. AGE 2013; 35(3):871-81.
32. Buchner DM, Larson EB, Wagner EH, Koepsell TD, De Lateur BJ. Evidence for a non-linear relationship between leg strength and gait speed. Age Ageing 1996;25:386-91.
33. Fiatarone MA, O`Neill EF, Ryan ND, Clements KM, Solares GR, Nelson ME, et al. Exercise training and nutritional supplementation for physical frailty in very elderly people. N Engl J Med 1994;330(25):1769-75.
34. Buchner DM, Cress ME, De Lateur BJ, Esselman PC, Margherita AJ, Price R, et al. The effect of strength and endurance training on gait, balance, fall risk, and health services use in community-living older adults. J Gerontol Ser A Biol Sci Med Sci 1997;52(4):218-24.
35. Studenski S, Perera S, Patel K, Rosano C, Faulkner K, Inzitari M, et al. Gait speed and survival in older adults. JAMA 2011;305(1):50-8.
36. Pijnappels M, Van der Burg PJ, Reeves ND, Van Dieën JH. Identification of elderly fallers by muscle strength measures. Eur J Appl
Physiol 2008;102(5):585-92.
37. Gale CR, Martyn CN, Cooper C, Sayer AA. Grip strength, body composition, and mortality. Int J Epidemiol 2007;36(1):228-35.
38. Rossetin LL, Gomes ARS, Rodrigues EV, Wamser EL, Pianaro C, Almeida GC, et al. Functional exercise capacity, and the association with physical activity level, lower-limb function and falls In elderly community women. 61st Annual Meeting of the American College of Sports Medicine, World Congress on Exercise is Medicine and World Congress on the Role of Inflammation in Exercise, Health and Disease; 2014; Orlando. Med Sci Sports Exerc 2014;46:49-50.
39. Chia-Ing L, Tsai-Chung L, Wen-Yuan L, Chiu-Shong L, Chih-Cheng H, Chao AH, et al. Combined association of chronic disease and low skeletal muscle mass with physical performance in older adults in the sarcopenia and translational aging research in Taiwan (START) Study. BMC Geriatr 2015;18(15):1-11.
40. Garcia PA, Dias JMD, Dias RC, Santos P, Zampa CC. Estudo da relação entre função muscular, mobilidade funcional e nível de atividade física em idosos comunitários. Rev Bras Fisioter 2011;15(1):15-22.
41. Ishii S, Tanaka T, Shibasaki K, Ouchi Y, Kikutani T, Higashiguchi T, et al. Development of a simple screening test for sarcopenia in older adults. Geriatr Gerontol Int 2014;14(Suppl 1):93-101.
42. Woodrow G. Body composition analysis techniques in the aged adult: indications and limitations. Curr Opin Clin Nutr Metab Care 2009;12(1):8-14
43. Baumgartner RN, Wayne SJ, Waters DL, Janssen I, Gallgher D, Morley JE. Sarcopenic obesity predicts instrumental activities of daily living disability in the elderly. Obes Res 2004;12(12):1995-2004.