https://doi.org/10.1590/0004-282X20170013
ARTICLE
Assessment of energy expenditure in
individuals with post-poliomyelitis syndrome
Avaliação do gasto energético nos indivíduos com síndrome pós-poliomielite
Roberto Dias Batista Pereira1, Tatiana Mesquita e Silva1, Abrahão Augusto Juviniano Quadros1,
Marco Orsini2,3, Beny Schmidt1, Helga Cristina Almeida Silva4, Acary Souza Bulle Oliveira1
he post-poliomyelitis syndrome (PPS) is a late efect of poliomyelitis, classiied as motor neuronopathy, since the clinical and histological aspects are closely related to dys-function of the lower motor neurons1
. he frequency of PPS varies from 22% to 80% in diferent international studies. A Brazilian study showed a frequency of 77,2% in patients classiied as having PPS, of which 62.8% were women and 37.2% were men2.
he PPS usually occurs 30-50 years after the acute polio infection. It is characterized by new symptoms or worsen-ing of previous residual symptoms such as: new weakness, muscle fatigue, new atrophy, muscle pain, joint pain and cold intolerance3,4,5,6. Currently, it is recognized as a disease entity
deined by the World Health Organization, and is represented in the International Code of Disorders (ICD10/G14)7.
Diferent hypotheses have been proposed for the patho-physiology of PPS8,9,10,11, but the most accepted is the theory
of “overuse” (overload or overtraining), proposed by Charcot12
and defended by others13,14,15,16.
he most important characteristic of PPS is the devel-opment of a new muscle weakness. his new weakness may occur in muscles that already have some degree of muscle weakness or muscles that were previously committed, and subsequently reinnervated. his new weakness inevitably leads to increased energy expenditure for the performance of routine physical activity17.
1Universidade Federal de São Paulo, Setor de Investigação nas Doenças Neuromusculares, São Paulo SP, Brasil;
2Centro Universitário Augusto Motta, Mestrado em Ciências da Reabilitação, Bonsucesso RJ, Brasil;
3Universidade Severino Sombra, Mestrado em Ciências Aplicadas a Saúde, Vassouras RJ, Brasil;
4Universidade Federal de São Paulo, Departamento de Anestesiologia, São Paulo SP, Brasil.
Correspondence: Roberto Dias Batista Pereira; Rua Estado de Israel, 899; 04022-002 São Paulo SP, Brasil; E-mail: [email protected]
Conflict of interest: There is no conflict of interest to declare. Received 18 December 2015; Accepted 21 November 2016.
ABSTRACT
The objective of this study was to identify energy expenditure, retrospectively, in individuals with post-poliomyelitis syndrome (PPS) in the Brazilian population. Methods: The Baecke questionnaire for the evaluation of habitual physical activity (HPA), assessment of quality of life (WHOQOL-Bref), and the Fatigue Severity Scale were administered to patients with PPS, poliomyelitis sequelae (PS) and to a control group (CG). Participated in the study 116 individuals (PPS=52,PS= 28,CG=36). Results: Patients with PPS tended to increase their HPA from 10 to 20 years of age, compared with those in the PS group and the CG. In the period from 21 to 30 years of age, there was significant increase in the PPS group’s occupational physical activity compared to the PS group, and the occupational physical activity (21-30 years of age) correlated with the onset of symptoms of PPS. Conclusion: Patients with PPS had a higher energy expenditure during life, especially in occupational physical activity at ages 21-30 years, suggesting this decade is critical for the development of PPS.
Keywords: postpoliomyelitis syndrome; poliomyelitis; energy metabolism.
RESUMO
O objetivo deste estudo foi identificar o gasto energético, retrospectivamente, em indivíduos com síndrome pós-poliomielite (SPP) na população brasileira. Métodos: Foi utilizado o questionário Baecke para avaliação da atividade física habitual (AFH) nos pacientes com SPP, sequela de poliomielite (SP) e grupo controle (GC). Participaram do estudo 116 indivíduos (SPP = 52, SP = 28, GC = 36). Resultados:Pacientes com SPP tendem a aumentar a AFH dos 10 aos 20 anos, comparados com os grupos SP e GC. No período dos 21 aos 30 anos, houve aumento significativo da atividade física ocupacional do grupo SPP em relação ao grupo SP e a atividade física ocupacional (21-30 anos) correlacionou-se com o aparecimento dos sintomas da SPP. Conclusão: Pacientes com SPP apresentam maior gasto de energia durante a vida, especialmente na atividade física ocupacional nas idades 21-30 anos, sugerindo que esta década é crítica para o desenvolvimento da SPP.
vq9+vqlO+vqll+vql2 4
PEL =
(6-vql3)+ vql4 +vql5 + vql6 4
LLA =
TS = OPA+PEL+LLA vq = value of the question
OPA = occupational physical activity PEL = physical exercises in leisure
LLA = physical leisure and locomotion activities TS = total score
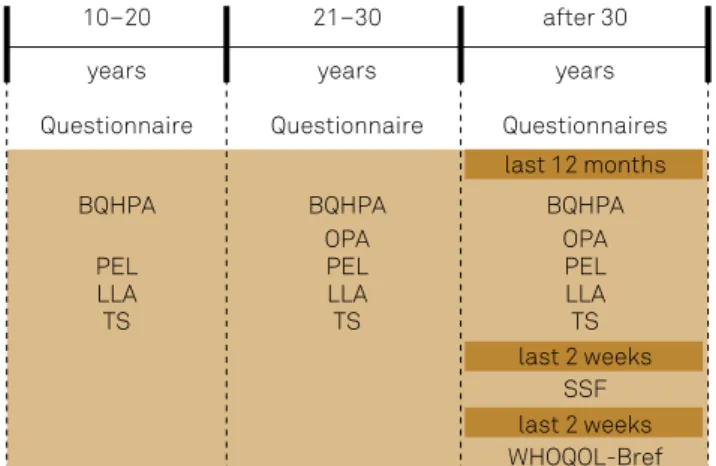
he Baecke questionnaire was applied to the three groups (PS, PPS and CG) just once, assessing the history of physi-cal activity throughout life in periods at 10-20 years of age, 21–30 years of age and in the last 12 months, excluding the occupational activities in the period from 10–20 years, result-ing in nine inal scores of the respective periods (Figure 1).
For the classiication of the energy expenditure of occu-pational physical activity and the types of exercise that were not in the standardization proile23, we used the studies by
Ainsworth et al.25 and McArdle et al.26 as reference. he irst
study was a coding scheme for the classiication of energy cost of human physical activities, and the latter proposed lev-els of classiications of human energy expenditure of physical activity (based on a multiple of the resting metabolic rate).
For fatigue evaluation, we use the Fatigue Severity Scale27.
It consists of nine items. Individuals record their responses from 1–7 (1 means that they disagree completely and 7 indi-cates that they fully agree with the statement). his scale assesses the complaint of fatigue in the previous two weeks.
We also used the abbreviated World Health Organization Quality of Life assessment tool28. his questionnaire has
26 questions, the irst two are general and the other 24 divided into four domains: physical (dom 1), psychological (dom 2), social relationships (dom 3), environment (dom 4) and over-all. Steps for checking and cleaning data and computing facet and domain scores were:
Recode q3 q4 q26 (1=5) (2=4) (3=3) (4=2) (5=1).
compute dom 1 = (mean.6 (q3, q4, q10, q15, q16, q17, q18)) * 4. compute dom 2 = (mean.5 (q5, q6, q7, q11, q19, q26)) * 4 Some risk factors, such as age, gender, severity of
paral-ysis, pain, intensity of muscular exercise, or physical activ-ity18,19 may contribute to the development of PPS. Possible
relationships between these factors and energy metabolism are of paramount importance20.
Diferent methods are used for the subjective assessment of habitual physical activity; most of them are represented by questionnaires coming from epidemiological studies21.
Assessment of physical activity by questionnaire is a method that is inluenced mainly by the ability of people to recall22.
he Baecke questionnaire for the evaluation of habit-ual physical activity23, is a recall instrument that is easy to
apply and understand; it is a qualitative-quantitative scale and addresses aspects such as occupational physical activ-ity, physical exercise in leisure and activities in leisure and locomotion. his instrument has been used in epidemiologi-cal study in the Brazilian population24.
he objective of this study was to identify energy expendi-ture, retrospectively, in individuals with PPS in the Brazilian population, and verify whether physical activity may be a pre-disposing factor for the development of PPS, or worsening of the patient’s symptoms.
METHODS
hree distinct groups of individuals were evaluated: poliomyelitis sequelae (PS), PPS, and a control group (CG). he population of interest comprised patients with a history of paralytic poliomyelitis who underwent ambulatory moni-toring in the Neuromuscular Disorders Unit, at the Federal University of Sao Paulo (UNIFESP), in the municipality of Sao Paulo, Brazil, and healthy individuals (caregivers of patients), between the years 2007-2009.
he inclusion criteria were male and female patients with a conirmed diagnosis of paralytic polio and PPS. Patients older than 60 years and the presence of any disease or med-ical condition that could lead to muscle weakness were excluded. his study was approved by the Ethics Committee of UNIFESP and all patients involved in the study agreed and signed the informed consent form.
To evaluate habitual physical activity, we used the Baecke questionnaire23, which had been translated and validated
into Portuguese by Florindo and Latorre24.
he Baecke encompasses three levels of physical activ-ity characterized by occupational physical activactiv-ity (ques-tions 1–8), physical exercise and leisure activities (ques(ques-tions 9–12), and physical leisure and locomotion activities (ques-tions 13–16), all of which comprise the assessment of habit-ual physical activity. he total score (TS) is the sum of the scores of these three levels. Formulae to calculate the Baecke questionnaire were:
vql +(6-vq2)+vq3+vq4+vq5+vq6+vq7+vq8 8
OPA =
Figure 1. Methodology to apply the questionnaires.
10–20
years
21–30
years
after 30
years
Questionnaire Questionnaire Questionnaires
BQHPA BQHPA BQHPA
PEL
OPA OPA
LLA
PEL PEL
TS
LLA LLA
TS TS
last 12 months
last 2 weeks
last 2 weeks SSF
compute dom 3 = (mean.2 (q20,q21,q22)) * 4
compute dom 4 = (mean.6 (q8, q9, q12, q13, q14, q23, q24, q25)) * 4
compute overall = (mean.2 (q1, q2)) * 4
Analyses were performed by PRISM 3 software, by com-paring their percentage by category, calculation of mean, median and standard deviation.
Continuous variables with normal distribution were tested by the Kolmogorov-Smirnov test.
Analysis of variance (ANOVA) was used to compare the groups when presented with parametric data. When statis-tically signiicant diferences were found, the analysis was complemented by Tukey’s test.
Analysis of variance (Kruskall-Wallis) was used to com-pare the groups when presented with non-parametric data. When statistically signiicant diferences were found, analy-sis was complemented by Dunn’s test.
Evaluation of linear correlation was made using the Spearman’s (r) correlation coeicient. For all tests, results were considered statistically signiicant when p < 0.05.
RESULTS
One hundred and sixteen individuals participated in the study, 52 with PPS, 28 with PS and 36 in the CG. he gender dis-tribution of the CG was 19 women (52.7%) and 17 men (47.3%); in the PS group: 17 women (60.7%) and 11 men (39.3%); and in the PPS group there were 26 women (50%) and 26 men (50%).
he average age for each group was: 42.86 ± 9.22 years for the CG; 43.31 ± 6.91 years for the PS group; and 43.83 ± 6.65 years for the PPS group (ranging from 30 to 59 years). Measures of central tendency and dispersion for anthropometric variables, assessed by group, are presented in Table 1.
he lowest age at which acute poliomyelitis occurred was 23 days and the highest was eight years; the average was 19.71 months (one year and seven months), with a standard deviation of 16.8 months (1.4 years), and the median was 18 months (nine and 24 months). he average age of onset of new symptoms of PPS was 37.7 ± 6.3 years (24-53 years).
On the Fatigue Severity Scale, there was a significant difference (p < 0.0001) between the CG (17.56 ± 11.4), the
PS group (27.29 ± 20.5) and PPS group (51.48 ± 14.21). The PPS group showed higher fatigue scores, with 92.3% of patients being classified with fatigue. In contrast, in the PS and PPS groups, there was no relationship between fatigue and other criteria evaluated in this study (demographic, anthropometric, history of poliomyelitis, quality of life and energy expenditure).
he group of patients with PPS showed an index of qual-ity of life signiicantly worse in the physical, psychological and environment domains, when compared with the other groups (CG and PS). here was no diference in the social net-working domain (Table 2).
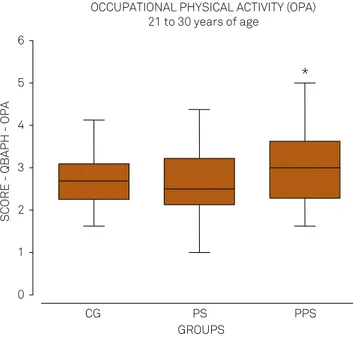
he PPS group showed an increase in energy expenditure in their occupational activities (professional), compared to the PS group in the period from 21 to 30 years of age (Figure 2).
Occupational physical activity between 21 and 30 years of age showed correlations with other variables in the survey (Table 3).
Table 1. Mean values and standard deviations of the
anthropometric characteristics of the groups involved in the study.
Variable CG (n = 36) PS (n = 28) PPS (n = 52)
Height (cm) 170.5 ± 10.9* 161.2 ± 8.0 163.4 ± 10.3
Weight (Kg) 74.6 ± 17.6 62.7 ± 15.8** 68.7 ± 15.4
BMI (Kg/m²) 25.5 ± 4.1 23.8 ± 4.9 25.5 ± 4.1
Test ANOVA (one way analysis of variance); *p= 0,0007 vs PS and PPS;
**p = 0,0124 vs CG.
CG: control group; PS: poliomyelitis sequelae; PPS: post-poliomyelitis syndrome; BMI: body mass index.
Table 2. Classification of scores for each group of domains of WHOQOL-Bref.
Dominion WHOQOL
CG (n = 36)
PS (n = 28)
PPS
(n = 52) p-value Physical 75.9 ± 14.3 67.9 ± 17.1 42.4 ± 16.5 < 0.0001a
Psychological 73.6 ± 13.4 73.5 ± 15.6 59.3 ± 16.9 < 0.0001b Social
relationships 74.6 ± 20.5 72.7 ± 21.1 67.8 ± 18.5 (ns) 0.128 Environment 66.1 ± 17.5 62.7 ± 17.0 56.7 ± 15.7 = 0.0312c
Test ANOVA (one way analysis of variance) with Tukey’s post-test, significant
difference: agroup PPS vs PS and CG;bgroup PPS vs PS and GC; cgroup PPS
vs CG. CG: control group; PS: poliomyelitis sequelae; PPS: post-poliomyelitis syndrome; WHOQOL: World Health Organization Quality of Life scale.
OCCUPATIONAL PHYSICAL ACTIVITY (OPA) 21 to 30 years of age
0 1 2 3 4 5 6
*
GROUPS
SCORE - QBAPH - OPA
CG PS PPS
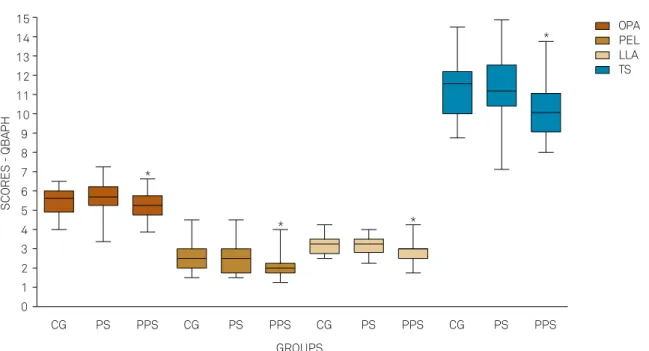
he Figure 3 shows that the PPS group, during the evalua-tion of physical activity performed in the previous 12 months, had a lower energy expenditure in all scores of the Baecke Questionnaire of Habitual Physical Activity, in relation to the PS and CG.
DISCUSSION
he aim of this study was to describe the proile of energy expenditure using the Baecke Questionnaire of Habitual Physical Activity, showing the relationship between habitual physical activity and the development of symptoms of PPS. In this study, it was important to assess whether physical activity may be a predisposing factor for the development of PPS, or worsening of their symptoms.
Fatigue has been found with high frequency afecting, on average, two-thirds of patients with PPS. his inding can be seen both in studies in the United States29 and in other
Brazilian studies2,30. he study by Conde et al.30 showed that
fatigue in patients with PPS is not related to time of day (morning or evening) but with the type of activity. In our research we analyzed the history of physical activity, profes-sions and sports practiced and did not ind any relationship with the variable of fatigue. his could be explained by two hypotheses: fatigue is an independent symptom that deserves speciic management; or fatigue is not a good marker of PPS.
Patients with PPS were found to have a poor quality of life compared to the PS and CG groups, mainly in the physical, psychological and environmental domains. he presentation of new symptoms alone, is likely to lead to an impaired qual-ity of life compared to the other groups.
he three groups (CG, PS and PPS) showed a gradual and signiicant increase in scores of occupational physical activity and total scores over the three periods analyzed. But there was a gradual and signiicant decrease over the years in physical activity scores in leisure, and physical activity in lei-sure and locomotion, most likely due to changes in lifestyle, resulting in inactivity in leisure sporting practices.
However, in studied clinical period (previous 12 months), clinical worsening in the patients with PPS may explain why they could not perform activities of leisure, as opposed to lack of opportunity, lack of desire or pleasure linked to another fac-tor. Both the PS and PPS group had a history of sequelae and physical disabilities, but only the PPS group showed a signiicant decrease in all their habitual physical activities (occupational physical activity, physical exercise and leisure and locomotion activities, and total scores) in the previous 12 months.
Table 3. Spearman’s correlation coefficients and p values between occupational physical activity (21 to 30 years of age) and the variables years of study, acute polio and age of onset of new symptoms.
Variables Correlation
coefficients (r) p-value
Education (years of study) - 0.3720 0.0066
Acute poliomyelitis - 0.2803 0.0390
Age at onset of PPS - 0.2796 < 0.0447
LAST 12 MONTHS
0 1 2 3 4 5 6 7 8 9 10 11 12 13 14 15
*
* *
* OPAPEL
LLA TS
SC
OR
ES
-
QB
AP
H
CG PS PPS CG PS PPS CG PS PPS CG PS PPS
GROUPS
CG: control group; PS: poliomyelitis sequelae; PPS: post-poliomyelitis syndrome; OPA: occupational physical activity; PEL: physical exercises in leisure; LLA: physical leisure and locomotion activities; TS: total score.
On the other hand, patients with PPS had a higher energy expenditure in occupational physical activity, in the period from 21 to 30 years of age, which was the only factor that cor-roborates the hypothesis of “overuse”.
Considering that PPS is a disease with giant motor units, the increased energy expenditure in any domain of the Baecke questionnaire could indicate an overload in motor units3.
he PPS group showed a negative correlation between occupational physical activity, from 21 to 30 years of age, and onset of new symptoms, indicating that the occupational physical activity (profession) exercised in this period is the factor that provided the physical overload causing the earlier appearance of new symptoms13.
he PPS group also showed a negative correlation between occupational physical activity, from 21 to 30 years of age, and the educational level, indicating that those who performed more physical activity in their occupation (profes-sion) in this period had a low educational level. his inding indicates that a high level of education may possibly be a pro-tective factor for PPS.
he PPS group showed a negative correlation between occupational physical activity, from 21 to 30 years of age and the age of acute poliomyelitis, indicating that those who had polio later had less energy expenditure in their occupational activities in the period. herefore, the age of the acute polio-virus infection negatively afected the work performance of patients, corroborating the statement about the severity of sequelae and physical losses of those patients with PPS.
Because this study was performed in a research center that specialized in neuromuscular diseases, the search for the patients was passive and spontaneous. he patients evaluated were those with more symptoms or who had any social and/or legal necessity. However, even though using a questionnaire as a research tool, which allowed the retrospective analysis of energy expenditure, the patients in question had no diiculty in understanding and completing the questionnaire, and this corresponded to a longer period of educational study (over 15 years of study: PPS = 48%, PS = 28.6% and CG = 33.3).
he study of an energy expenditure proile in individuals with a history of prior paralytic poliomyelitis showed that the PPS is a nosological condition with its own characteristics, and the overuse of motor units during life is one of the causal factors; it is directly linked with the historical expenditure of energy during life; PPS patients had a higher energy expen-diture, especially in occupational physical activity, between 21 and 30 years of age, suggesting that this decade is critical for the development of this condition; at the present time, patients with PPS have a diferent status in relation to the PS and CG groups, with a higher frequency of fatigue, lower scores on usual physical activities and consequently poorer quality of life; being overweight can be an aggravating factor for the development or intensiication of these limitations.
Considering that PPS may have a relationship with greater physical activity in a given period of life and/or increased basal metabolism31
, future research is needed to compare the Fatigue Severity Scale with basal metabolic measures.
References
1. Abroms JF, Bresnan MJ, Zuckerman JE, Fischer EG, Strand R.
Cervical cord injuries secondary to hyperextension of the head in breech presentations. Obstet Gynecol. 1973;41(3):369-78.
2. Stoll BJ, Kliegman RM. Delivery room emergencies. In: Behrman RE,
Kliegman RM, Jenson HB, editors. Nelson Text book of pediatrics. 17th ed. Philadelphia, PA: Saunders; 2004. p. 569-72.
3. Emerson NW, et al. Fetus and the neonatal birth injury. In: Behrman
RE, Kliegman RM, Jenson HB, editors. Nelson text book of pediatrics. 15th ed. Philadelphia, PA: Saunders; 1996. p. 561-6.
4. Hankins GD, Clark SM, Munn MB. Cesarean section on request
at 39 weeks: impact on shoulder dystocia, fetal trauma, neonatal encephalopathy, and intrauterine fetal demise. Semin Perinatol. 2006;30(5):276-87. https://doi.org/10.1053/j.semperi.2006.07.009
5. Henderson SG, Sherman LS. The Roentgen anatomy of the
skull in the newborn infant. Radiology. 1946;46(7):107-18. https://doi.org/10.1148/46.2.107
6. Lindgren L. The lower parts of the uterus during the first stage
of labour in occipito-anterior vertex presentation: studies by means of intrauterine tokography. Acta Obstet Gynecol Scand. 1955;34(Suppl 2):1-79. https://doi.org/10.3109/00016345509154530
7. Moloy HC. Studies on head molding during
labor. Amer J Obstet Gynec. 1942;44(5):762-82. https://doi.org/10.1016/S0002-9378(15)30603-7
8. Bhagwanani SG, Price HV, Lawrence KM, Ginz B. Risks and
prevention of cervical cord injury in the management of breech
presentations with hyperextension of the fetal head. Am J Obst Gynec. 1973;115(8):1159-61. https://doi.org/10.1016/0002-9378(73)90573-5
9. Bucher HU, Boltshauser E, Friderich J, Isler W. Birth injury to the
spinal cord. Helv Paediatr Acta. 1979;34(6):517-27.
10. Byers RK. Spinal-cord injuries during birth.
Dev Med Child Neurol. 1975;17(1):103-10. https://doi.org/10.1111/j.1469-8749.1975.tb04967.x
11. Cole VA, Durbin GM, Olaffson A, Reynolds EOR, Rivers RPA, Smith JF.
Pathogenesis of intraventricular haemorrhage in newborn infants. Arch Dis Child. 1974;49(9):722-8. https://doi.org/10.1136/adc.49.9.722
12. Ford FR. Breech delivery in its possible relation to injury
of the spinal cord with special reference to infantile paraplegia. Arch Neurol Psychiat. 1925;14(6):742-50. https://doi.org/10.1001/archneurpsyc.1925.02200180013002
13. Freud S. Die Infantile CerebralHihmung: Specielle Pathologie und
Therapie. Wien;1897.
14. Nicholson L. Caput succedaneum and cephalohematoma: the Cs
that leaves bumps on the head. Neonatal Netw. 2007;26(5):277-81. https://doi.org/10.1891/0730-0832.26.5.277
15. Harcke HT Jr, Naeye RL, Storch A, Blanc WA. Perinatal cerebral
intraventricular hemorrhage. J Pediatr. 1972;80(1):37-42. https://doi.org/10.1016/S0022-3476(72)80450-5
16. Harwood-Nash DC, Hendrick EB, Hudson AR. The significance of
17. Korobkin R. The relationship between head circumference and the development of communicating hydrocephalus in infants following intraventricular hemorrhage. Pediatrics. 1975;56(1):74-7.
18. Krishnamoorthy KS, Shannon DC, DeLong GR, Todres ID, Davis KR.
Neurologic sequelae in the survivors of neonatal intraventricular hemorrhage. Pediatrics. 1979;64(2):233-7.
19. Little WJ. Course of lectures on the deformities of
the human frame. Lancet. 1844;41(1072):809-15. https://doi.org/10.1016/S0140-6736(02)64521-0
20. McDonald MM, Koops BL, Johnson ML. Timing and etiology of
intracranial hemorrhage in the newborn. In: Second Special Laboratories Conference on Perinatal Intracranial Hemorrhage. Columbus, Ohio: Ross Laboratories; 1982. p. 221-32.
21. Ment LR, Duncan CC, Scott DT, Ehrenkranz RA. Posthemorrhagic
hydrocephalus: low incidence in very low birth weight neonates with intraventricular hemorrhage. J Neurosurg. 1984;60(2):343-7. https://doi.org/10.3171/jns.1984.60.2.0343
22. Neville IS, Amorim RL, Paiva WS, Sanders FH, Teixeira MJ, Andrade
AF. Early surgery does not seem to be a pivotal criterion to improve prognosis in patients with frontal depressed skull fractures. Biomed Res Int. 2014;2014:879286. https://doi.org/10.1155/2014/879286
23. Natelson SE, Sayers MP. The fate of children sustaining severe head
trauma during birth. Pediatrics. 1973;51(2):169-74.
24. Roberts MH. The spinal fluid in new-born with special
reference to intracranial hemorrhage. JAMA. 1925;85(7):500-3. https://doi.org/10.1001/jama.1925.02670070020006
25. Zalatimo O, Ranasinghe M, Dias M, Iantosca M. Treatment of
depressed skull fractures in neonates using percutaneous microscrew elevation. J Neurosurg Pediatr. 2012;9(6):676-9. https://doi.org/10.3171/2012.2.PEDS11304
26. Weiner EJ, McIntosh MS, Joseph MM, Maraqa N, Davis PG. Neonatal
scalp abscess: is it a benign disease? J Emerg Med. 2011;40(5):e97-101. https://doi.org/10.1016/j.jemermed.2009.08.019
27. Collins K, Reed R. Birth trauma. In: Collins KA, Byard RW.
Forensic pathology of infancy and childhood. New York: Springer; 2014. p. 139-68.
28. Habibi Z, Meybodi AT, Haji Mirsadeghi SM, Miri SM. Burr-hole
drainage for the treatment of acute epidural hematoma in
coagulopathic patients: a report of eight cases. J Neurotrauma. 2012;29(11):2103-7. https://doi.org/10.1089/neu.2010.1742
29. Jung SW, Kim DW. Our experience with surgically treated epidural
hematomas in children. J Korean Neurosurg Soc. 2012;51(4):215-8. https://doi.org/10.3340/jkns.2012.51.4.215
30. Roberts MH. The spinal fluid in newborn with special
reference to intracranial hemorrhage. JAMA. 1925;85:500. https://doi.org/10.1001/jama.1925.02670070020006 DUPLICATA DA 24
31. Health problems of newborns. Hockenberry M, Wilson D. Wong’s
essentials of pediatric nursing. 9th ed. Saint Louis: Mosby, 2013. p. 274-367.
32. Swanson AE, Veldman A, Wallace EM, Malhotra A. Subgaleal
hemorrhage: risk factors and outcomes. Acta Obstet Gynecol Scand. 2011;91(2):260-3. https://doi.org/10.1111/j.1600-0412.2011.01300.x
33. Gupta SN, Kechli AM, Kanamalla US. Intracranial hemorrhage
in term newborns: management and outcomes. Pediatr Neurol. 2009;40(1):1-12. https://doi.org/10.1016/j.pediatrneurol.2008.09.019
34. Brittain C, Muthukumar P, Job S, Sanka S. “Ping pong” fracture
in a term infant. BMJ Case Rep. 2012;2012:pii: bcr0120125631. https://doi.org/10.1136/bcr.01.2012.5631
35. Kerr HA. Closed head injury. Clin Sports Med. 2013;32(2):273-87.
https://doi.org/10.1016/j.csm.2012.12.008
36. Ekéus C, Högberg U, Norman M. Vacuum assisted birth and risk
for cerebral complications in term newborn infants: a population-based cohort study. BMC Pregnancy Childbirth. 2014;14(1):36. https://doi.org/10.1186/1471-2393-14-36
37. Reichard R. Birth injury of the cranium and central
nervous system. Brain Pathol. 2008;18(4):565-70. https://doi.org/10.1111/j.1750-3639.2008.00205.x
38. Hehir MP, Reidy FR, Wilkinson MN, Mahony R. Increasing rates
of operative vaginal delivery across two decades: accompanying outcomes and instrument preferences. Eur J Obstet Gynecol Reprod Biol. 2013;171(1):40-3. https://doi.org/10.1016/j.ejogrb.2013.08.015
39. Manning JJ, Adour KK, Facial paralysis in children. Pediatrics.
1972;49(1):102-9.
40. Gowers WR. Clinical lecture on birth