Série Zoologia
Fundação Zoobotânica do Rio Grande do Sul Museu de Ciências Naturais www.scielo.br/isze-ISSN 1678-4766
Iheringia
Iheringia
Taxonomic groups with lower movement capacity
may present higher beta diversity
Vinícius X. da Silva
1, Mario Sacramento
1,2, Érica Hasui
1, Rogério G. T. da Cunha
1& Flavio N. Ramos
11. Laboratório de Ecologia de Fragmentos Florestais, Instituto de Ciências da Natureza, Universidade Federal de Alfenas, Rua Gabriel Monteiro da Silva, 700, Centro, 37130-000 Alfenas, MG, Brazil. ([email protected])
2. Estação de Hidrobiologia e Piscicultura de Furnas, Rua Lavras, 288, 37947-000 São José da Barra, MG, Brazil.
Received 4 February 2016. Accepted 19 July 2016.
DOI: 10.1590/1678-4766e2017005
ABSTRACT. Diversity analysis by partition is an approach employed in order to understand how communities spatially structure themselves and the factors that operate in the generation and maintenance of distribution patterns. We examined the spatial structure of species diversity of four taxonomic groups, with diff erent dispersal abilities, in 16 forest fragments in the southern region of the state of Minas Gerais, Brazil. Specifi cally, we tested: i) if the similarity in species composition would be negatively related to geographical distance between the 16 fragments; and ii) if the beta diversity of the diff erent groups could be negatively related to their dispersal abilities. Alpha diversity and the compositional similarity between localities were both low. Beta diversity was not correlated with distance for any of the groups. Primates, followed by birds, showed a higher tendency of forming similarity groupings, although in a manner that was independent from distance between fragments, as well as showed the lowest beta diversity relative values. Spermatophytes and amphibians did not defi ne groupings and presented the highest values of beta diversity. We interpreted such results as indications that the groups with higher dispersal ability (primates and birds) tend to reach, on average, farther localities and, therefore, to defi ne more similar groupings (low beta diversity). The groups with lower dispersal ability (spermatophytes and amphibians) showed the opposite tendency. Although most of the species were restricted to few localities, contributing to the low similarity, beta and gamma diversity values showed the extent which the localities are, respectively, diff erent and complementary to each other in terms of species composition. Such features reinforce and justify future conservation initiatives, both in local and regional levels.
KEYWORDS. Complementarity, dispersal ability, vertebrates, spermatophytes, Atlantic Forest.
RESUMO.Grupos taxonômicos com menor capacidade de dispersão podem apresentar maior diversidade beta. A análise da diversidade por
partição é uma abordagem empregada para tentar compreender como as comunidades se estruturam espacialmente e os fatores que operam na geração e manutenção dos padrões de distribuição das espécies. Nós examinamos a estrutura espacial da diversidade de espécies referente a quatro grupos taxonômicos com diferentes capacidades de dispersão, em 16 fragmentos fl orestais localizados no sul do Estado de Minas Gerais, Brasil. Especifi camente, testamos: i) se a similaridade na composição de espécies estaria relacionada negativamente com a distância geográfi ca entre os fragmentos e ii) se a diversidade beta apresentada por cada grupo poderia ser negativamente relacionada com as respectivas capacidades de dispersão. Tanto a diversidade alfa quanto a similaridade composicional entre as localidades foram baixas. A diversidade beta não esteve correlacionada com a distância para nenhum dos grupos. Os primatas, seguidos das aves, apresentaram maior tendência em formar agrupamentos de similaridade, embora de maneira independente da distância entre os fragmentos, bem como os menores valores relativos de diversidade beta. Já espermatófi tas e anfíbios não defi niram agrupamentos e apresentaram relativamente os maiores valores de diversidade beta. Interpretamos tais resultados como indicações de que grupos com maior capacidade de dispersão (primatas e aves) tendem a alcançar, em média, localidades mais distantes e, portanto, a defi nir agrupamentos mais similares (i.e. baixa diversidade beta). Já os grupos com menor capacidade de dispersão (espermatófi tas e anfíbios) apresentaram a tendência oposta. Apesar da maioria das espécies terem apresentado ocorrência restrita a poucas localidades, contribuindo para a baixa similaridade, as altas diversidades beta e gama demonstraram o quanto as localidades são distintas e complementares entre si em termos de composição de espécies. Tais características reforçam e justifi cam futuras iniciativas de conservação, tanto em âmbito local quanto regional.
PALAVRAS-CHAVE. Complementariedade, habilidade de dispersão, vertebrados, espermatófi tas, Mata Atlântica.
Several factors contribute to the diversity structure in
communities and such factors are usually scale-dependent and
interact with ecological, evolutionary and biogeographical
processes (
Ricklefs, 1987; Pineda
&
Halffter, 2004;
Gardner
et al
., 2009). Species diversity in an area can also
be considered at diff erent scales, and can be split into alpha,
beta and gamma components (
Whittaker, 1960, 1972).
Alpha diversity corresponds to the species richness found in
a location or individual habitat (
Whittaker, 1960), which
constitutes the sampling unit that contains an assemblage or
community. Beta diversity, on the other hand, describes how
the species composition varies in time and/or space between
habitats/units (
Whittaker, 1960, 1972; Koleff
et al
., 2003;
Anderson
et al
., 2010). Gamma diversity is the entire
1960; Tuomisto, 2010).
Beta diversity thus relates the alpha to the gamma
diversity (
Ricklefs, 1987; Anderson
et al
., 2010), indicating
how many species are shared between the habitats/units
and, therefore, the degree of biotic heterogeneity of a region
(
Wilson
&
Shmida, 1984). Beta diversity may be positively
associated with environmental heterogeneity (
Soininen
et
al
., 2007a) or be independent from it, varying only with
space (
Hubbel, 2001).
Several factors may influence spatial variation in beta
diversity, such as geographical, environmental, historical
and evolutionary processes (
Soininen
et al
., 2007a).
Those processes normally produce an inverse relationship
between similarity in species composition and geographical
distance among sampling units (
Nekola
&
White, 1999;
Hubbel, 2001). Such relation is partially due to the spatial
autocorrelation pattern of environmental variables, with
closer locations tending to be more environmentally similar
to each other (
Legendre, 1993), which, by itself, influences
the composition of species communities (
Harrison
et al
.,
1992; Jiménez
-
Valverde
et al
., 2010). Therefore, a decrease
in the similarity of environmental conditions along space
may result in a correspondent decrease of the similarity in
species composition (
Steinitz
et al
., 2006).
Among the biotic factors that may influence the
pattern of beta diversity there are the life history of the
species (
Soininen
et al
., 2007a) and the organisms’ dispersal
ability (
Dobrovolski
et al
., 2011). Also, taxonomic groups of
organisms may be broadly categorized in a gradient according
to their dispersal abilities. Thus, the decay of similarity with
the increase of geographical distance would be relatively
higher for taxonomic groups that show lower dispersal
ability (
Soininen
et al
., 2007b; Qian 2009a; Dobrovolski
et al
., 2011). Spermatophytes usually have passive dispersal
and depend on seed dispersal agents (e.g.
Tabarelli
&
Peres, 2002; Almeida
-
Neto
et al
., 2008). Among terrestrial
vertebrates, birds are the most vagile, followed by mammals,
amphibians being the less mobile ones (
Böhning
-
Gaese
et
al
., 1998; Qian, 2009b; Dobrovolski
et al
., 2011; Qian
&
Ricklefs, 2012).
In disturbed landscapes, one of the factors that may
influence changes in beta diversity in relation to conserved
habitats also relates to different dispersal abilities. Since
fragmentation generates barriers for movement, it may limit
even more the dispersal ability of organisms and, thus, favor
differentiation in composition among fragments (Arroyo
-Rodríguez
et al
., 2013). Following the pattern expected for
undisturbed landscapes, groups with high dispersal ability
would thus have bigger chances of (re)colonizing neighbor
habitats, keeping viable populations and reducing, that
way, the compositional differences between fragments, the
opposite occurring in groups with lower movement capacities
(
Soininen
et al
., 2007a).
In this study we analyzed the beta diversity variation of
four groups with different dispersal abilities (spermatophytes,
amphibians, birds and primates) in a region of the Atlantic
Forest hotspot (Myers
et al
., 2000), a highly fragmented
biome. Specifically, our aims were: 1- to evaluate the relative
contributions of alpha and beta diversities to the gamma
diversity; 2- to test if there is higher similarity between
closer localities than between farther ones due to spatial
autocorrelation (
Legendre, 1993; Jiménez
-
Valverde
et al
.,
2010), especially regarding groups with relatively higher
dispersal ability (birds and primates) (Buckley
&
Jetz,
2008; Qian
&
Ricklefs, 2012); and 3- to test whether beta
diversity is higher in groups with lower dispersal capacity.
A better understanding of these issues will allow taking
more scientifically sound decisions for the management
and conservation of these fragments, especially in a biome
as threatened as the Atlantic Rainforest (Pinto
et al
.,
2006). For example, understanding the contribution of the
complementarity (beta diversity) to the gamma diversity
within a landscape is important to the SLOSS debate and to
where we should aim our conservation efforts (Margules
&
Pressey, 2000). In addition, understanding the influence
of the dispersal capacity on the beta diversity may help us
to take management decisions fine-tuned to specific issues
of the different groups.
MATERIAL AND METHODS
Study sites. We conducted rapid surveys of
spermatophytes, birds, amphibians and primates in 16 forest
fragments in the southern region of the state of Minas Gerais,
Brazil (Fig. 1, Tab. I), covering an area of about 65,000 km
2,
during the summers of 2010 and 2011. Most of the fragments
are located in areas listed as priorities for conservation (
sensu
Drummond
et al
., 2005, see green areas on the map). We
employed a rapid survey approach, sampling each fragment
once during two consecutive days (e.g.
Herzog
et al
., 2002;
Young
et al
., 2003; Penter
et al
., 2008).
Sampling. We recorded the occurrence of species
using complementary methods, which increases the chances
of sampling a greater number of species in a short period of
time (
Silveira
et al
., 2010).
For spermatophytes, we used the quadrant point’s
method (
Cottam
&
Curtis, 1956), sampling 20 points on
each fragment. The points were placed roughly 20 m apart
from each other along a 400m transect in the central region
of the fragment. In each point, we recorded the closest
four individuals with diameter at breast height (DBH) ≥
3 cm. We identified the plants through comparisons with
herbarium specimens and consultations with specialists and
the specialized literature. We deposited the exsiccates in the
herbarium of the Universidade Federal de Alfenas (UALF).
Species nomenclature followed APG III (Angiosperm
Phylogeny Group, 2009).
For amphibians, we employed visual and audio
surveys (
Crump
&
Scott Jr., 1994) during a fixed time
period (between 19h00 min and 00h00 min). The search
for individuals was directed to breeding sites, especially
water bodies (
Scott Jr.
&
Woodward, 1994), as well as
leaf litter and vegetation along trails and transects made to
hours-Fig. 1. Location of the 16 fragments sampled in Minas Gerais, Brazil (LOCALITY, municipality): AIU, Aiuruoca; BOC, Bocaina de Minas; CAM, Camanducaia; CAX, Caxambu; DEL, Delfim Moreira; EXT, Extrema; GUA, Guaxupé; MAR, Maria da Fé; MON, Monte Belo; MVE, Monte Verde; PAS, Passa Quatro; POÇ, Poços de Caldas; POU, Pouso Alegre; SGS, São Gonçalo do Sapucaí; SRJ, Santa Rita de Jacutinga and VIR, Virgínia.
Tab. I. Main characteristics of the 16 fragments sampled in Minas Gerais, Brazil (biome; geographic coordinates; area; altitude) and respective sampling period (month and year) (AIU, Aiuruoca; BOC, Bocaina de Minas; CAM, Camanducaia; CAX, Caxambu; DEL, Delfim Moreira; EXT, Extrema; GUA, Guaxupé; MAR, Maria da Fé; MON, Monte Belo; MVE, Monte Verde; PAS, Passa Quatro; POÇ, Poços de Caldas; POU, Pouso Alegre; SGS, São Gonçalo do Sapucaí; SRJ, Santa Rita de Jacutinga; VIR, Virgínia).
Locality Biome Coordinates Area (ha) Altitude (m) Month/Year
AIU SSF 21°55’46”S, 44°34’54”W 225 1056 Feb./2011
BOC OF 22°09’22”S, 44°22’57”W 41 1263 Feb./2011
CAM SSF 22°40’50”S, 46°06’55”W 72 1132 Dec./2010
CAX SSF 21°59’39”S, 44°57’46”W 176 1037 Jan./2011
DEL OF 22°31’32”S, 45°14’07”W 1591 1372 Dec./2010
EXT OF 22°53’41”S, 46°19’25”W 4112 1539 Dec./2010
GUA SSF 21°20’06”S, 46°39’54”W 763 1012 Feb./2010
MAR SSF 22°16’28”S, 45°22’25”W 192 1566 Jan./2011
MVE OF 22°52’08”S, 45°58’13”W 7143 1585 Dec./2010
MON SSF 21°22’07”S, 46°16’44”W 525 865 Feb./2010
PAS OF 22°23’30”S, 44°56’28”W 459 1114 Jan./2011
POÇ SSF 21°54’17”S, 46°32’15”W 36 1427 Feb./2010
POU SSF 22°13’21”S, 45°58’02”W 358 907 Dec./2010
SGS SSF 21°52’40”S, 45°36’40”W 25 1016 Feb./2010
SRJ OF 22°10’02”S, 44°10’59”W 438 719 Feb./2011
VIR OF 22°19’16”S, 45°09’45”W 2083 1650 Jan./2011
man per locality. Some voucher specimens (Auricchio
&
Salomão, 2002) were deposited in the Coleção Herpetológica
Alfred Russel Wallace (CHARW) of Universidade Federal
de Alfenas (IBAMA license #10704-1).
For birds, we employed the capture of understory
species with mist nets (12 m x 2.5 m x 31 mm mesh)
(
Develey, 2003). We installed ten nets in a row along a
150 m transect inside the forest, at least 50 m distant from
the edge. The nets remained opened between 07h00 min
and 17h00 min, totaling 200 net-hours effort per location.
Each captured individual was identified and subsequently
released (IBAMA license #22020-1).
For the primate surveys, we employed a couple of
different approaches. To attempt detecting the
buffy-tufted-ear marmosets,
Callithrix aurita
(E. Geoffroy in Humboldt,
1812), the black-fronted titi monkeys,
Callicebus nigrifrons
(Spix, 1823), and the brown tufted capuchin monkeys,
Sapajus nigritus
Goldfuss, 1809, we used playbacks. We
selected long-range, high amplitude calls, which are proposed
to function either in inter-group communication (marmoset
long calls and titi monkey duets) or to maintain contact
between group members (capuchin monkey whistles). We
reproduced the same calls throughout the study, both within
the forest and/or at the borders. Inside the fragments we
played the calls up to four times at different directions in
each sampling point, so as to attempt covering a 360° radius
around it. In contrast, we reproduced calls in two directions
for a given species were ended as soon as a response was
obtained. Some occurrences were also recorded through
direct visual and auditory contact (
Rosales
-
Meda, 2007). In
addition, we interviewed landowners and residents near the
fragments about the occurrence of species (
Waters
&
Ulloa,
2007). This procedure was necessary to verify the occurrence
of
Alouatta guariba clamitans
Cabrera, 1940, which usually
do not respond well to playbacks. Also, marmosets and
capuchins are less responsive to playbacks than titi monkeys,
and are more likely not to respond, even if present. If the
respondent mentioned the occurrence of marmosets, we
only included these data if we could locate and identify
the species, given the occurrence of an exotic species of
the genus,
Callithrix penicillata
(E. Geoffroy, 1812), in the
region. The fragment was excluded from further analysis if
we could not correctly identify the species. In Pouso Alegre
and Passa Quatro localities, we also obtained information
regarding the presence of primates through management
plans of the protected areas we surveyed. Given the lower
richness of this group, we did not restrict ourselves to the
two-day sampling scheme. When we had indications that a
species might occur in a locality (e.g. through interviews),
but were unsure about it (for example of which marmoset
species it were, or due to conflicting or apparently inaccurate
reports), we returned to the fragments in other occasions in a
further attempt to confirm the findings. Whenever in doubt,
we did not consider a species as occurring in a fragment.
Data analysis. Herein we considered gamma
diversity (γ) as the total number of registered species in the
16 fragments sampled (regional richness, but see Tuomisto,
2010). We considered alpha diversity (α) to be the number of
species in each fragment (local richness). Last, we defined
beta diversity (β) as the non-directional variation on species
composition between the fragments (
sensu
Anderson
et al
.,
2010). We calculated beta diversity in two ways, using three
different measures (β
W; β
add; β
C):
(1) Variation on the number of species among the
localities: here we used both multiplicative beta diversity (β
W)
(
Whittaker, 1960) and additive beta diversity (β
add) (Lande,
1996; Crist
&
Veech, 2006) measures. The multiplicative
beta diversity is given by the formula [β
W= γ / α
mean], where
γ is the total number of species for the region and α
meanis
the average number of species of the 16 fragments. β
Wthus
indicates “the number of times by which the richness in a
region is greater than the average richness in the
smaller-scale units” (Anderson
et al
., 2010). On the other hand,
the additive beta diversity is given by the formula [β
add=
γ – α
mean] and it informs the average number of species that
are not shared among all the sampling units (
Anderson
et
al
., 2010).
(2) Variation on the species composition between
localities: beta diversity as a measure of complementarity
(β
C). Through paired comparison of species between
localities, the proportion of species that occur in only one
of those localities is evaluated in relation to the total number
species of both localities (
Colwell
&
Coddington, 1994).
The beta diversity values, in this case, are represented by the
inverse of the similarity indexes of species’ values (see next
paragraph), that is, [β
C= 1 – Cj], where Cj is the similarity
index value (
Krebs, 1999). Thereby, pairs of locations
with low similarity in species composition show high beta
diversity, and vice versa. Complementarity values vary from
zero (identical species composition between two localities)
to 1 (completely different species composition between two
localities) (Colwell
&
Coddington, 1994). We considered
the values of average complementarity as significant if β
Cwas ≥ 0.5 (50%) (Vasconcelos
et al
., 2011).
Similarity in species composition was quantified
both for each taxonomic group and for the four groups
combined through grouping or cluster analysis (UPGMA)
and computation of the Jaccard’s similarity index (Cj)
(
Magurran, 1988), which determines the proportion of
species shared between each pair of localities. We considered
as a grouping every pair or group of localities showing Cj ≥
0.5. To verify if there was any correlation between species
composition similarity and geodesic geographical distance
between the localities, we applied the Mantel test (Legendre
&
Legendre, 2012), whose
r
values may vary from -1 (strong
negative correlation) to +1 (strong positive correlation), zero
meaning absence of correlation. The tests were carried out
in the program R, version 3.0.1. (R Development Core
Team, 2013).
Last, to classify the species according to the frequency
of occurrence in the 16 localities, we used the following
categories (adapted from
Dajoz, 1983): “frequent” (species
with registered presence in at least nine locations); “common”
(occurrence in five to eight locations); and “rare” (occurrence
in four locations or less). Both the exotic species and the ones
recorded by chance (i.e. outside the standardized sampling
methods) were not computed on the data analysis. However,
we included them in the general relation of species described
in the supplementary material (Appendixes 1 to 4).
RESULTS
We found 259 species of spermatophytes (Appendix 1),
45 of amphibians (Appendix 2), 66 of birds (Appendix 3) and
four of primates (Appendix 4). However, local richness was
usually much smaller than that (Tab. II). We also registered
one exotic anuran species
Lithobates catesbeianus
(Shaw,
1802)
in Delfim Moreira and one introduced primate species
Callithrix penicillata
in Guaxupé, Caxambu, Aiuruoca, Passa
Quatro and Bocaina de Minas. The list of all species we
recorded, as well as their distributions along the 16 fragments
and respective frequency of occurrence (FO) can be found
in the supplementary material (Appendixes 1 to 4).
Through the multiplicative beta diversity measure
(β
W), we verified that there were 8.3 times more species
of spermatophytes, 5.3 times more amphibians, 3.2 times
more birds’ species and 1.7 times more primate species on
the regional scale (γ) than in each locality (α). Through the
additive beta diversity measure (β
add), we verified that the
proportion of species that are not shared among all localities
Tab. II. Local species richness (alpha diversity) of spermatophytes, amphibians, birds, primates and all the groups found in the 16 fragments sampled in Minas Gerais, Brazil (AIU, Aiuruoca; BOC, Bocaina de Minas; CAM, Camanducaia; CAX, Caxambu; DEL, Delfim Moreira; EXT, Extrema; GUA, Guaxupé; MAR, Maria da Fé; MON, Monte Belo; MVE, Monte Verde; PAS, Passa Quatro; POÇ, Poços de Caldas; POU, Pouso Alegre; SGS, São Gonçalo do Sapucaí; SRJ, Santa Rita de Jacutinga; VIR, Virgínia).
Locality Spermatophytes Amphibians Birds Primates All
AIU 38 7 23 2 70
BOC 29 9 13 2 54
CAM 34 6 13 1 54
CAX 34 10 14 3 61
DEL 35 15 22 3 75
EXT 39 9 22 3 73
GUA 27 6 26 2 61
MON 23 8 21 2 54
MAR 22 9 21 2 54
MVE 31 9 19 2 61
PAS 26 10 23 3 62
POÇ 37 8 23 2 70
POU 28 5 29 4 66
SGS 27 3 20 1 51
SRJ 31 11 19 3 64
VIR 36 9 16 2 63
mean±sd 31.1±5.3 8.4±2.7 20.3±4.5 2.3±0.8 62.1±7.4
primate species. The distinction between species composition
(β
C) between pairs of locations was, on average, significant
for spermatophytes (0.92; range: 0.75-1), amphibians (0.83;
range: 0.47-1), birds (0.68; range: 0.42-0.91) and all the
groups together (0.83; range: 0.69-0.93), but not for primates
(0.47; range: 0-0.75).
As for the frequency of occurrence within the set of
fragments, most of the species (84.4%) were “rare” when we
consider the four groups combined, occurring in only one,
two, three or four localities. The same pattern was observed
for spermatophytes (93.8%), amphibians (77.3%) and birds
(57.6%), but not for primates (0%) (Fig. 2).
When we analyzed the species composition similarity,
there was no grouping between localities regarding
spermatophytes (Fig. 3). As for the amphibians (Fig. 4),
there was only the MAR-DEL grouping, with both localities
showing the same type of phytophysiognomy (ombrophilous
forest), but located 117 km apart from each other (Fig. 1).
In birds, four groupings of similarity were formed (Fig. 5).
The localities from the groupings POU-MAR and
MON-GUA showed the same phytophysiognomy (seasonal
semideciduous forest) and are relatively close to each other
(61 and 40 km, respectively). However, the localities of the
groupings EXT-SRJ and MVE-DEL, though presenting the
same phytophysiognomy of ombrophilous forest, are distant
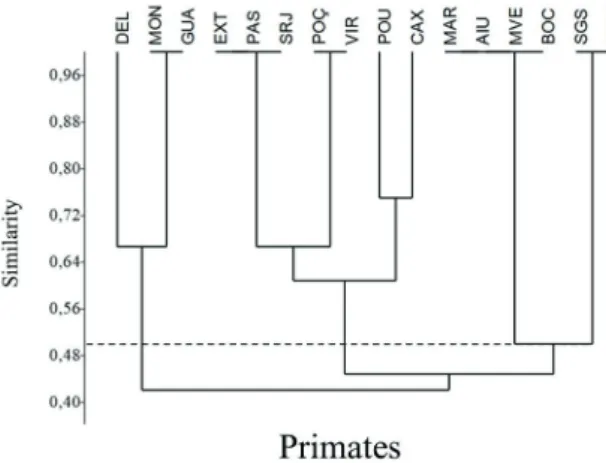
from each other 235 and 90 km, respectively. The primates
grouping (Fig. 6) was the only one with high composition
similarity, forming six locality groupings, with all of them
showing the same phytophysiognomy between the fragments
Fig. 2. Frequency of occurrence of spermatophytes (n=259), amphibians (n=44), birds (n=66) and primates (n=4) species in the 16 localities sampled in Minas Gerais, Brazil. Frequent (species with registered presence between nine and 16 locations); common (between five and eight localities); and rare (between one and four localities).
of each grouping, independently from geographical distance.
The only grouping common to birds and primates was
MON-GUA. We did not find any grouping when we analyzed the
four groups simultaneously (Fig. 7). Finally, we did not find
any relation between species composition and geographical
distance between localities for any of the groups through the
Mantel test: spermatophytes (r = 0.03, p = 0.35), amphibians
(r = -0.01, p = 0.5), birds (r = -0.006, p = 0.49), primates
(r = 0.14, p = 0.072), and all the four groups together (r =
0.01, p = 0.45).
DISCUSSION
Beta diversity showed no correlation with geographic
distance. Primates, followed by birds, presented a greater
tendency to form location groups with species compositions
more alike between themselves, though in a way that was
independent from geographic distance, as well as showed the
lower beta diversity values. On the other hand, spermatophytes
and amphibians did not define such groupings and showed
the highest values of beta diversity. We interpreted those
Fig. 4. Similarity in species composition of amphibians among the 16 localities sampled in Minas Gerais, Brazil, based on the Jaccard coefficient of similarity and subsequent cluster analysis (UPGMA). Obs.: dashed line (significance level: 0.5 or 50%) (AIU, Aiuruoca; BOC, Bocaina de Minas; CAM, Camanducaia; CAX, Caxambu; DEL, Delfim Moreira; EXT, Extrema; GUA, Guaxupé; MAR, Maria da Fé; MON, Monte Belo; MVE, Monte Verde; PAS, Passa Quatro; POÇ, Poços de Caldas; POU, Pouso Alegre; SGS, São Gonçalo do Sapucaí; SRJ, Santa Rita de Jacutinga; VIR, Virgínia).
Fig. 5. Similarity in species composition of birds among the 16 localities sampled in Minas Gerais, Brazil, based on the Jaccard coefficient of similarity and subsequent cluster analysis (UPGMA). Obs.: dashed line (significance level: 0.5 or 50%) (AIU, Aiuruoca; BOC, Bocaina de Minas; CAM, Camanducaia; CAX, Caxambu; DEL, Delfim Moreira; EXT, Extrema; GUA, Guaxupé; MAR, Maria da Fé; MON, Monte Belo; MVE, Monte Verde; PAS, Passa Quatro; POÇ, Poços de Caldas; POU, Pouso Alegre; SGS, São Gonçalo do Sapucaí; SRJ, Santa Rita de Jacutinga; VIR, Virgínia).
Fig. 7. Similarity in species composition of all the groups combined among the 16 localities sampled in Minas Gerais, Brazil, based on the Jaccard coefficient of similarity and subsequent cluster analysis (UPGMA). Obs.: dashed line (significance level: 0.5 or 50%) (AIU, Aiuruoca; BOC, Bocaina de Minas; CAM, Camanducaia; CAX, Caxambu; DEL, Delfim Moreira; EXT, Extrema; GUA, Guaxupé; MAR, Maria da Fé; MON, Monte Belo; MVE, Monte Verde; PAS, Passa Quatro; POÇ, Poços de Caldas; POU, Pouso Alegre; SGS, São Gonçalo do Sapucaí; SRJ, Santa Rita de Jacutinga; VIR, Virgínia).
results as indications that the groups with higher dispersal
ability (primates and birds) reached, in average, more distant
locations and tend, therefore, to define locality groups with
more similar compositions (i.e. low beta diversity). In less
vagile groups (spermatophytes and amphibians), the low
dispersal ability does not favor them in occupying nearest
locations, even if the ecological conditions allow; such
groups, thus, present the reverse tendency of not forming
locality groups with similar compositions (i.e. high beta
diversity).
Primates, moreover, were the only group in which
there were no species with “rare” frequency of occurrence,
probably due to the low regional richness of only four species.
This may have increased the probability of generating locality
groupings with similar compositions by chance alone. By
excluding this group, because of its exceedingly low species
number, it is possible to conclude that beta diversity, be it
of spermatophytes, amphibians, birds or all these groups
together, exerted a greater influence on regional diversity
(gamma) than local species richness (alpha) (Pineda
&
Halffter, 2004).
The absence of correlation between the similarity
in species composition and the geographical distance and
groupings of localities with similar compositions, independent
from geographical distance, in birds and primates, suggests
that other factors might be necessary to explain the variation
on the species composition of each group along the space.
Accordingly, several studies have demonstrated a host of
different factors that may influence variation of species
composition through space: (1) spatial and environmental
gradients (e.g.
Clark
et al
., 1999; Nekola
&
White, 1999;
Oliveira
-
Filho
&
Fontes, 2000; Carneiro
&
Valeriano,
2003; Steinitz
et al
., 2006, 2007b; Legendre
et al
., 2009);
(2) differences in the physiology, in the degree of biological
interactions and in the dispersal ability of the species
(
Nekola
&
White, 1999; Tuomisto
et al
., 2003; Gilbert
&
Lechowicz, 2004); (3) barriers imposed by the configuration
of the landscape and the influence of weather on species’
dispersion (
Nekola
&
White, 1999; Hubbel, 2001); (4)
stochastic processes generated randomly and independently of
environmental dissimilarities (Neutral Theory
sensu
Hubbel,
2001; Soininen
et al
., 2007b; Steinbauer
et al
., 2012); (5)
species’ tolerance to fragmentation (Arroyo
-
Rodríguez
et
al
., 2013); (6) spatial scale (extension, resolution; Nekola
&
White, 1999; Steinitz
et al
., 2006; Soininen
et al
.,
2007b; Arroyo
-
Rodríguez
et al
., 2013). Therefore, more
accurate analysis involving other variables could yield further
explanations regarding the spatial distribution observed in
this study.
Although our results support the relationship
between dispersal ability and beta diversity, there are
some controversial results in the literature (
McKnight
et al
., 2007). Soininen
et al
. (2007a), for example, when
comparing different trophic levels, showed that autotrophs
have smaller beta diversity than omnivores and carnivores.
This particular result was very different from ours, since the
spermatophytes from our study showed a higher average
beta diversity value than all other groups, constituted by
animals. A possible explanation for these differences can
be found in the suggestions by the same authors (
Soininen
et al
., 2007a): beta diversity is something very complex
and influenced by extrinsic (e.g. landscape structure and
environmental variations) and intrinsic factors (e.g. peculiar
features of the organisms).
On the other hand,
Qian (2009a) and Arroyo
-Rodríguez
et al
. (2013), both working with plants, showed
results that were similar to those we found here, that is, high
negative correlation between the dispersal ability and the beta
diversity. According to Arroyo
-
Rodríguez
et al
. (2013),
increasing the distance between forest fragments leads to
communities with very specific compositions (i.e. high beta
diversity), given seed dispersal is limited. Such parallel may
indicate a potential problem for the landscapes in southern
Minas Gerais, given its high degree of fragmentation, which
may lead in the future to local extinctions.
Amphibians showed a very similar result to the
spermatophytes, only with slightly lower beta diversity values
and much smaller gamma diversity (regional). The high
beta diversity of the group can be explained by two factors.
First we have amphibians strict environmental requirements
(
Duellman
&
Trueb, 1994; Werner
et al
.,
2007; Buckley
&
Jetz, 2008), especially their need for both water (for
reproduction), and higher temperatures, due to ectothermy
(
Buckley
&
Jetz, 2008; Qian, 2009b). Since the studied
fragments vary in terms of water availability and altitude
(thus temperature), the environmental requirements for
amphibians vary accordingly. Besides, amphibians are usually
considered as animals with low dispersal ability (
Qian,
2009b; Dobrovolski
et al
., 2011; Qian
&
Ricklefs, 2012).
When compared to mammals and birds, amphibians always
show higher beta diversity (see
Buckley
&
Jetz, 2008; Qian,
2009b; Dobrovolski
et al
., 2011; Qian
&
Ricklefs, 2012).
The same was observed for reptiles, an equally ectothermic
and little vagile group (see
Qian, 2009b; Qian
&
Ricklefs,
2012). Amphibians may even show turnover values four times
higher than birds (
Buckley
&
Jetz, 2008). The opposite
happens to the median size of the geographic distributions
of these two groups. In general, birds have occurrence areas
four times bigger than amphibians, a clear sign of the greater
dispersal ability made possible by flight. The relationship
between these patterns is so outstanding that the amphibians’
turnover has been proved to be a better predictor for the
birds’ turnover than the environmental variables (Buckley
&
Jetz, 2008).
The high percentage of spermatophytes, amphibians
and birds species with “rare” occurrence in this study is
a sign of the low number of species shared between the
local communities, especially on the first two groups. Some
of these rarities actually represent less abundant species
under some degree of threat (see
International Union
for Conservation of Nature, 2013), and the register of
their occurrence is important for conservation purposes
on the respective sampled municipalities. The registers of
as, for example, in the case of the amphibian
Ischnocnema
holti
(Cochran, 1948) in the locality of Extrema, which
extended its range to about 160 km southwest of its typical
locality (see
Da Costa
et al
., 2008; Targino
&
Carvalho-e-Silva, 2008).
The exotic species we found deserve mention due
to the negative impacts they cause. The anuran
Lithobates
catesbeianus
, originally from North America, is commercially
farmed as a food source. Due to negligence in their
containment, they commonly end up escaping captivity
and settling up populations in natural environments, where
they may cause problems to the native communities (
Both
et al
., 2011; Silva
et al
., 2011). The locality in which this
species was collected constitutes a new register for the state
of Minas Gerais. The primate
Callithrix penicillata
, a typical
species of the Cerrado biome (
Miranda
&
Faria, 2001),
was deliberately introduced in Atlantic Forest environments.
Worse, it is a species with high adaptability and dispersion
power, causing several impacts and possibly even hybridizing
with native species of this biome (
Stevenson
&
Rylands,
1988; Auricchio, 1995).
A potential criticism to our results relates to the rapid
survey sampling scheme we have adopted here. Such sampling
scheme may be regarded insufficient (Lawton
et al
., 1998;
Steinbauer
et al
., 2012), a problem compounded by the
different levels of detectability of each species (Boulinier
et al
., 1998), given that the surveys were relatively fast.
However, the overall conclusion would not be affected by a
longer sampling on each location. Although alpha diversity
values might increase on each fragment with higher sampling
efforts, beta diversity would remain high. The reason is that
longer sampling allows registering species that are rarer,
which, however, naturally show a patchy distribution in the
landscape, particularly in a fragmented one. Therefore, our
sampling scheme was sufficient to gather the data necessary
to provide the basis for our conclusions.
In summary, although alpha diversity within fragments
was low, we found low similarity in species composition
between localities (i.e. high beta diversity values), thus
resulting in a high gamma diversity. Primates were the only
group with average complementarity below 50%. In addition,
they presented a greater tendency (followed by birds) to
form location groups with species compositions more alike
between themselves, though in a way that was independent
from geographic distance. Thus, the decreasing gradient of
beta diversity observed [spermatophytes (92%) > amphibians
(83%) > birds (68%) > primates (48%)] coupled with the
results of the groupings, indicate that the taxa with higher
dispersal ability (primates and birds) may have reached,
in average, more distant locations and tend, therefore, to
define locality groups with more similar compositions (i.e.
low beta diversity).
Acknowledgments. This project was funded by Fundação
de Amparo à Pesquisa do Estado de Minas Gerais (FAPEMIG, Program BIOTA MINAS, #APQ 03549-09). We are grateful to Ana C. Monteiro-Leonel, Dérik F. F. Rosa, Diego G. S. Pereira, Carina S. Barbosa, Mainara X. Jordani, Raiane F. Marques, Renato A. J. Gaiga and Rodolph C. Loyola
for the support in fieldwork; Bruno R. Ribeiro, Diogo B. Provete, Marco T. P. Coelho, Maria J. dos S. Wisniewski, Michel V. Garey, Renato N. Feio and Renato S. Bérnils for the useful suggestions in the previous version of this manuscript. We are also thankful to the landowners and to the managers and employees of the Floresta Nacional de Passa Quatro (ICMBio), Parque Municipal de Pouso Alegre (IEF) and Instituto Sul Mineiro de Estudos e Conservação da Natureza (ISMECN) for the permission to access the fragments. We especially thank Universidade Federal de Alfenas (UNIFAL-MG) for the logistic support; and CAPES for the master’s scholarship (#1144826) to MS. Two anonymous referees provided insightful comments which greatly helped to improve the manuscript.
REFERENCES
Almeida-Neto, M.; Campassi, F.; Galetti, M.; Jordano, P. & Oliveira-Filho, A. 2008. Vertebrate dispersal syndromes along the Atlantic forest: broad-scale patterns and macroecological correlates. Global Ecology and Biogeography 17:503-513.
Anderson, M. J.; Crist, T. O.; Chase, J. M.; Vellend, M.; Inouye, B. D.; Freestone, A. L.; Sanders, N. J.; Cornell, H. V.; Comita, L. S.; Davies, K. F.; Harrison, S. P.; Kraft, N. J. B.; Stegen, J. C. & Swenson, N. G. 2010. Navigating the multiple meanings of β diversity: a roadmap for the practicing ecologist. Ecology Letters 2010:1-16. Angiosperm Phylogeny Group - APG III. 2009. An update of the
Angiosperm Phylogeny Group classification for the orders and families of flowering plants: APG III. Botanical Journal of the Linnean Society 161:105-121.
Arroyo-Rodríguez, V.; Rös, M.; Escobar, F.; Melo, F. P. L.; Santos, B. A.; Tabarelli, M. & Chazdon, R. 2013. Plant b-diversity in fragmented rain forests: testing floristic homogenization and differentiation hypotheses. Journal of Ecology 101:1449-1458.
Auricchio, P. 1995. Primatas do Brasil. São Paulo: Terra Brasilis. 168p. Auricchio, P. & Salomão, M. G. 2002. Técnicas de coleta e preparação
de vertebrados para fins científicos e didáticos. Arujá, Instituto Pau Brasil de História Natural. 349p.
Böhning-Gaese, K.; González-Guzmán, L. I. & Brown, J. H. 1998. Constraints on dispersal and the evolution of the avifauna of the Northern Hemisphere. Evolutionary Ecology 12:767-783.
Both, C.; Lingnau, R.; Santos-Jr., A.; Madalozzo, B.; Lima, L. P. & Grant, T. 2011. Widespread occurrence of the american bullfrog,
Lithobates catesbeianus (Shaw, 1802) (Anura: Ranidae). South American Journal of Herpetology 6(2):127-134.
Boulinier, T.; Nichols, J. D.; Sauer, J. R.; Hines, J. E. & Pollock, K. H. 1998. Estimating species richness: the importance of heterogeneity in species detectability. Ecology 79(3):1018-1028.
Buckley, L. B. & Jetz, W. 2008. Linking global turnover of species and environments. Proceedings of the National Academy of Sciences 105:17836-17841.
Carneiro, J. S. & Valeriano, D. M. 2003. Padrão espacial da diversidade beta da Mata Atlântica: Uma análise da distribuição da biodiversidade em banco de dados geográficos. Anais XI SBSR. INPE, Belo Horizonte, p.629-636.
Clark, D. B.; Palmer, M. W. & Clark, D. A. 1999. Edaphic factors and the landscape-scale distributions of tropical rain forest trees. Ecology 80(8):2662-2675.
Colwell, R. K. & Coddington, J. A. 1994. Estimating terrestrial biodiversity through extrapolation. Philosophical Transactions of the Royal Society B 345:101-118.
Cottam, G. & Curtis, J. T. 1956. The use of distance measures in phytosociological sampling. Ecology 37(3):451-460.
Crist, T. O. & Veech, J. A. 2006. Additive partitioning of rarefaction curves and species-area relationships: unifying α, β and γ diversity with sample size and habitat area. Ecology Letters 9:923-932.
Crump, M. L. & Scott Jr., N. J. 1994. Standard techniques for inventory and monitoring: visual encounter surveys. In: Heyer, W. R.; Donnelly,
M. A.; McDiarmid, R. W.; Hayek, L. A. C. & Foster, M. S. eds.
Measuring and monitoring biological diversity: standard methods for amphibians. Washington, Smithsonian Books, p. 84-92. Da Costa, P. N.; Carvalho-E-Silva, S. P. de; Carvalho-E-Silva, A. M.
Dajoz, R. 1983. Ecologia geral. 4ed. Petrópolis, Vozes. 470p. Develey, P. 2003. Métodos com estudos com aves. In: Cullen, L.; Rudran,
R. & Valladares-Pádua, C. eds. Métodos de estudos em Biologia da Conservação & Manejo da vida Silvestre. Curitiba, UFPR e Fundação O Boticário de Proteção à Natureza, p.153-179.
Dobrovolski, R.; Melo, A. S.; Cassemiro, F. A. S. & Diniz-Filho, J. A. F. 2011. Climatic history and dispersal ability explain the relative importance of turnover and nestedness components of beta diversity.
Global Ecology and Biogeography 21(2):1-7.
Drummond, G. M.; Martins, C. S.; Machado, A. B. M.; Sebaio, F. A. & Antonini, Y. 2005. Biodiversidade em Minas Gerais: um atlas para a sua conservação. 2ed. Belo Horizonte, Fundação Biodiversitas. 222 p. Duellman, W. E. & Trueb, L. 1994. Biology of amphibians.
McGraw-Hill, Baltimore. 670p.
Gardner, T. A.; Barlow, J.; Chazdon, R.; Ewers, R. M.; Harvey, C. A.; Peres, C. A. & Sodhi, N. S. 2009. Prospects for tropical forest biodiversity in a human-modified world. Ecology Letters 12:561-582. Gilbert, B. & Lechowicz, M. J. 2004. Neutrality, niches and dispersal in a temperate forest understory. Proceedings of the National Academy of Sciences of the USA 101:7651-7656.
Harrison, S.; Ross, S. J. & Lawton, J. H. 1992. Beta diversity on geographic gradients in Britain. Journal of Animal Ecology 61(1):151-158. Herzog, S. K.; Kessler, M. & Cahill, T. M. 2002. Estimating species
richness of tropical bird communities from rapid assessment data. The Auk 119(3):749-769.
Hubbel, S. P. 2001. The unified neutral theory of biodiversity and
biogeography. Princeton, Princeton University. 392p.
International Union For Conservation Of Nature – Iucn. 2013. IUCN Red List of Threatened Species. Version 2012. 1. Available at <http:// www.iucnredlist.org>. Accessed on 25 September 2013.
Jiménez-Valverde, A.; Baselga, A.; Melic, A. & Txasko, N. 2010. Climate and regional beta-diversity gradients in spiders: dispersal capacity has nothing to say? Insect Conservation and Diversity 3:51-60. Koleff, P.; Gaston, K. J. & Lennon, J. J. 2003. Measuring beta diversity
for presence-absence data. Journal of Animal Ecology 72:367-382. Krebs, C. J. 1999. Ecological Methodology. 2ed. Menlo Park, Benjamin
Cummings. 620p.
Lande, R. 1996. Statistics and partitioning of species diversity, and similarity among multiple communities. Oikos 76:5-13.
Lawton, J. H.; Bignell, D. E.; Bolton, B.; Bloemers, G. F.; Eggleton, P.; Hammond, P. M.; Hodda, M.; Holt, R. D.;Larsen, T. B.; Mawdsley, N. A.; Stork, N. E.; Srivastava, D. S. & Watt, A. D. 1998. Biodiversity inventories, indicator taxa and effects of habitat modification in tropical forest. Nature 391:72-76.
Legendre, P. 1993. Spatial autocorrelation: Trouble or new paradigm? Ecology 74:1659-1673.
Legendre, P. & Legendre, L. 2012. Numerical ecology. Oxford, Elsevier. 1006p.
Legendre, P.; Mi, X.; Ren, H.; Ma, K.; Yu, M.; Sun, I-F. & He, F. 2009. Partitioning beta diversity in a subtropical broad-leaved forest of China. Ecology 90(3):663-674.
Magurran, A. E. 1988. Ecological diversity and its measurement. 3ed. New Jersey, Princeton University Press. 179p.
Margules, C. R. & Pressey, R. L. 2000. Systematic conservation planning.
Nature 405:243-253.
McKnight, M. W.; White, P. S.; McDonald, R. I.; Lamoreux, J. F.; Sechrest, W.; Ridgely, R. S. & Stuart, S. N. 2007. Putting beta-diversity on the map: broad-scale congruence and coincidence in the extremes. PLOS Biology 5(10):2424-2432.
Miranda, G. H. B. de & Faria, D. S. de. 2001. Ecological aspects of black-pincelled marmoset (Callithrix penicillata) in the cerradão and
dense cerrado of the Brazilian Central Plateau. Brazilian Journal of Biology 61(3):397-404.
Myers, N.; Mittermeier, R. A.; Mittermeier, C. G.; Fonseca, G. A. B & Kent, J. 2000. Biodiversity hotspots for conservation priorities.
Nature 403:853-858.
Nekola, J. C. & White, P. S. 1999. The Distance Decay of Similarity in Biogeography and Ecology. Journal of Biogeography 26(4):867-878. Oliveira-filho, A. T. & Fontes, A. L. 2000. Pattern of floristic differentiation among Atlantic Forest in Southeastern Brazil and the influence of climate. Biotropica 32(4b):793-810.
Penter, C.; Pedó, E.; Fabián, M. E. & Hartz, S. M. 2008. Inventário Rápido da Fauna de Mamíferos do Morro Santana, Porto Alegre, RS. Revista Brasileira de Biociências 6(1):117-125.
Pineda, E. & Halffter, G. 2004. Species diversity and habitat fragmentation: frogs in a tropical montane landscape in Mexico. Biological Conservation 117:499-508.
Pinto, L. P.; Bedê, L.; Paese, A.; Fonseca, M.; Paglia, A. & Lamas, I. 2006. Mata Atlântica Brasileira: Os Desafios para Conservação da Biodiversidade de um Hotspot Mundial. In: Rocha, C. F. D.; Bergallo, H. G.; Sluys, M. V. & Alves, M. A. S. eds. Biologia da Conservação: Essências. São Carlos, RiMa. 582p.
Qian, H. 2009a. Beta diversity in relation to dispersal ability for vascular plants in North America. Global Ecology and Biogeography 18
:327-332.
Qian, H. 2009b. Global comparisons of beta diversity among mammals, birds, reptiles, and amphibians across spatial scales and taxonomic ranks. Journal of Systematics and Evolution 47(5):509-514. Qian, H. & Ricklefs, R. E. 2012. Disentangling the effects of geographic
distance and environmental dissimilarity on global patterns of species turnover. Global Ecology and Biogeography 21:341-351. R Development Core Team. 2013. R: A language and environment for
statistical computing. R Foundation for Statistical Computing. Available at: <http://www. R-project.org>. Accessed on 10 July 2013. Ricklefs, R. E. 1987. Community Diversity: Relative Roles of Local and
Regional Processes. Science 235:167-171.
Rosales-Meda, M. M. 2007. Caracterización de la población del mono aullador (Alouatta palliata palliata) em el Refugio Nacional de Vida
Silvestre Isla San Lucas, Costa Rica. Neotropical Primates 14 (3):122-127.
Scott Jr., N. J. & Woodward, B. D. 1994. Standard techniques for inventory and monitoring: surveys at breeding sites. In: Heyer, W. R.;
Donnelly, M. A.; McDiarmid, R. W.; Hayek L. A. C. & Foster M. S. eds. Measuring and monitoring biological diversity: standard methods for amphibians. Washington, Smithsonian Institution Press, p.118-125.
Silva, E. T.; Ribeiro Filho, O. P. & Feio, R. N. 2011. Predation of native anurans by invasive bullfrogs in Southeastern Brazil: Spatial variation and effect of microhabitat use by prey. South American Journal of Herpetology 6(1):1-10.
Silveira, L. F.; Beisiegel, B. M.; Curcio, F. F.; Valdujo, P. H.; Dixo, M.; Verdade, V. K.; Mattox, G. M. T. & Cunningham, P. T. M. 2010. What Use Do Fauna Inventories Serve? Estudos Avançados 24(68):173-207.
Soininen, J.; Lennon, J. J. & Hillebrand, H. 2007a. A Multivariate Analysis of Beta Diversity across Organisms and Environments. Ecology 88(11):2830-2838.
Soininen, J.; McDonald, R. & Hillebrand, H. 2007b. The distance decay of similarity in ecological communities. Ecography 30:3-12. Steinbauer, M. J.; Dolos, K.; Reineking, B. & Beierkuhnlein, C. 2012.
Current measures for distance decay in similarity of species composition are influenced by study extent and grain size. Global Ecology and Biogeography 21:1203-1212.
Steinitz, O.; Heller, J.; Tsoar, A.; Rotem, D. & Kadmon, R. 2006. Environment, dispersal and patterns of species similarity. Journal of Biogeography 33:1044-1054.
Stevenson, M. F. & Rylands, A. B. 1988. The marmosets genus. In:
Mittermeier, R. A.; Rylands, A. B.; Coimbra-Filho, A. F. & Fonseca, G. A. B. eds. Ecology and Behavior of Neotropical Primates. Washington, World Wildlife Foundation, p. 131-223. Tabarelli, M. & Peres, C. A. 2002. Abiotic and vertebrate seed dispersal
in the Brazilian Atlantic Forest: implications for forest regeneration. Biological Conservation 106:165-176.
Targino, M. & Carvalho-E-Silva, S. P. De. 2008. Redescrição de
Ischnocnema holti (Amphibia: Anura: Brachycephalidae). Revista Brasileira de Zoologia 25(4):716-723.
Tuomisto, H.; Ruokolainen, K. & Yli-Halla, M. 2003. Dispersal, environment, and floristic variation of western Amazonian forests. Science 299:241-244.
Vasconcelos, T. S.; Santos, T. G.; Rossa-Feres, D. C. & Haddad, C. F. B. 2011. Spatial and temporal distribution of tadpole assemblages (Amphibia, Anura) in a seasonal dry tropical forest of southeastern Brazil. Hydrobiologia 673:93-104.
Waters, S. S. & Ulloa, O. 2007. Preliminary survey on the current distribution of primates in Belize. Neotropical Primates 14(2):80-82. Werner, E. E.; Skelly, D. K.; Relyea, R. A. & Yurewicz, K. L. 2007. Amphibian species richness across environmental gradients. Oikos 116:1697-1712.
Whittaker, R. H. 1960. Vegetation of the Siskiyou Mountains, Oregon and California. Ecological Monographs 30:279-338.
Whittaker, R. H. 1972. Evolution and measurement of species diversity. Taxon 21:213-251.
Wilson, M. V. & Shmida, A. 1984. Measuring beta diversity with presence-absence data. Journal of Ecology 72:1055-1064.
Young, B.; Sedaghatkish, G. & Roca, R. 2003. Levantamentos de fauna.
In: Sayre, R.; Roca, E.; Sedaghatkish, G.; Young, B.; Keel, S.; Roca,
R. & Sheppard, S. eds. Natureza em Foco: Avaliação Ecológica
Rápida. Arlington, The Nature Conservancy. 175p.
Appendix 1. Species of spermatophytes recorded in the 16 localities sampled in Minas Gerais, Brazil, and their respective frequency of occurrence (FO): R (Rare); C (Common); and F (Frequent) (AIU, Aiuruoca; BOC, Bocaina de Minas; CAM, Camanducaia; CAX, Caxambu; DEL, Delfim Moreira; EXT, Extrema; GUA, Guaxupé; MAR, Maria da Fé; MON, Monte Belo; MVE, Monte Verde; PAS, Passa Quatro; POÇ, Poços de Caldas; POU, Pouso Alegre; SGS, São Gonçalo do Sapucaí; SRJ, Santa Rita de Jacutinga; VIR, Virgínia).
Spermatophytes FAMILY
Species
Localities
Total FO AIU BOC CAM CAX DEL EXT GUA MAR MON MVE PA
S
POÇ POU SGS SRJ VIR
ANARCADIACEAE
Astronium fraxinifolium Schott ex Spreng. x x x 3 R
Schinus terebinthifolius Raddi x 1 R
Tapirira guianensis Aubl. x x x x 4 R
Tapirira obtusa (Benth.) J.D. Mitch. x x x x 4 R ANNONACEAE
Annona cacans (R.E. Fr.) H. Rainer x x 2 R
Annona sericea Dunal x x 2 R
Annona sp. x x x 3 R
Annona sylvatica A. St.-Hil. x x x 3 R
Duguetia lanceolata A. St.-Hil. x 1 R
Guatteria sp. x 1 R
Guatteria australis A. St.-Hil. x x x x 4 R
Guatteria nigrescens Mart. x 1 R
Xylopia brasiliensis Spreng. x x 2 R
Xylopia sericea A. St.-Hil. x 1 R APOCYNACEAE
Aspidosperma australe Müll. Arg. x 1 R
Aspidosperma parvifolium A. DC. x x x 3 R
Aspidosperma spruceanum Benth. ex Müll. Arg x 1 R
Aspidosperma subincanum Mart. ex A. DC. x 1 R
Tabernaemontana sp. x 1 R AQUIFOLIACEAE
Ilex cerasifolia Loes. x x 2 R
Ilex conocarpa Reissek x 1 R
Ilex paraguariensis A. St.-Hil. x x 2 R
Ilex sapotifolia Reissek x x 2 R
Ilex theezans Mart. ex Reissek x 1 R ARALIACEAE
Aralia excelsa (Griseb.) J. Wen x 1 R
Schefflera calva (Cham.) Frodin & Fiaschi x 1 R
Schefflera sp. x 1 R
ARAUCARIACEAE
Araucaria angustifolia (Bert.) O. Kuntze x 1 R ARECACEAE
Geonoma schottiana Mart. x 1 R
Syagrus romanzoffiana (Cham.) Glassman x 1 R
ASTERACEAE
Baccharis serrulata (Lam.) Pers. x 1 R
Eremanthus erythropappus (DC.) MacLeish x 1 R
Eremanthus sp. x 1 R
Piptadenia gonoacantha (Mart.) J.F. Macbr. x x x 3 R
Piptocarpha axillaris (Less.) Baker x 1 R
Piptocarpha macropoda (DC.) Baker x 1 R BIGNONIACEAE
Handroanthus catarinenses (A.H. Gentry) S. O.
Grose x 1 R
Spermatophytes FAMILY
Species
Localities
Total FO AIU BOC CAM CAX DEL EXT GUA MAR MON MVE PA
S
POÇ POU SGS SRJ VIR
BORAGINACEAE
Cordia sellowiana Cham. x 1 R
Cordia sp. x 1 R
BURSERACEAE
Protium heptaphyllum (Aubl.) Marchand x 1 R
Protium spruceanum (Benth.) Engl. x 1 R
Protium widgrenii Engl. x x 2 R CARICACEAE
Jacaratia spinosa (Aubl.) A. DC. x 1 R CELASTRACEAE
Maytenus ilicifolia Mart. ex Reissek x 1 R
Maytenus robusta Reissek x 1 R
Maytenus salicifolia Reissek x 1 R
Maytenus sp. x x 2 R CLETHRACEAE
Clethra scabra Pers. x x 2 R CONNARACEAE
Connarus regnellii G. Schellenb. x x x 3 R DICKSONIACEAE
Dicksonia sellowiana Sodiro x 1 R ELAEOCARPACEAE
Sloanea hirsuta (Schott) Planch. ex Benth. x x x x 4 R EUPHORBIACEAE
Alchornea castaneifolia (Humb. & Bonpl. ex
Willd.) A. Juss. x 1 R
Alchornea cf. triplinervia x x 2 R
Alchornea glandulosa Poepp. x x x x 4 R
Alchornea sidifolia Müll. Arg. x 1 R
Alchornea triplinervia (Spreng.) M. Arg. x x 2 R
Aparisthmium cordatum (A.Juss.) Baill x 1 R
Croton floribundus Spreng. x x x x x 5 C
Croton organensis Baill. x x 2 R
Maprounea guianensis Aubl. x x 2 R
Pera glabrata (Schott) Poepp. ex Baill. x 1 R
Sapium glandulosum (L.) Morong x x 2 R
Sebastiania commersoniana (Baill.) L.B. Sm. &
Downs x x x x 4 R
Sebastiania serrata (Baill. ex Müll. Arg.) Müll. Arg. x 1 R FABACEAE
Anadenanthera sp. x 1 R
Apuleia leiocarpa (Vogel) J.F. Macbr. x x x 3 R
Bauhinia forficata Link x 1 R
Bauhinia rufa (Bong.) Steud. x 1 R
Bauhinia sp. x 1 R
Copaifera langsdorffii Desf. x x x x 4 R
Copaifera sp. x 1 R
Dalbergia frutescens (Vell.) Britton x 1 R
Dalbergia villosa (Benth.) Benth. x x x x x x x x x 9 F
Diplotropis ferrugínea Benth. x 1 R
Holocalyx balansae Micheli x x 2 R
Hymenaea courbaril L. x 1 R
Inga vera Willd. x 1 R
Machaerium brasiliense Vogel x 1 R
Machaerium hirtum (Vell.) Stellfeld x x 2 R
Machaerium villosum Vogel x x x x x x 6 C
Myroxylon peruiferum L. f. x 1 R
Ormosia fastigiata Tul. x 1 R
Platycyamus regnellii Benth. x x x x x 5 C
Podocarpus sellowii Klotzsch ex Endl. x 1 R
Pseudopiptadenia sp. x 1 R
Pterocarpus rohri Vahl x 1 R
Spermatophytes FAMILY
Species
Localities
Total FO AIU BOC CAM CAX DEL EXT GUA MAR MON MVE PA
S
POÇ POU SGS SRJ VIR
Senna macranthera (DC. ex Collad.) H.S. Irwin &
Barneby x 1 R
Stryphnodendron polyphyllum Mart. x 1 R
Swartzia flaemingii Raddi x 1 R
Swartzia myrtifolia Sm. x 1 R
Tachigali rugosa (Mart. ex Benth.) Zarucchi &
Pipoly x 1 R
Vernonanthura divaricata (Spreng.) H. Rob. x 1 R
Vernonanthura sp. x x x 3 R HUMIRIACEAE
Vantanea compacta (Schnizl.) Cuatrec. x 1 R HYPERICACEAE
Vismia guianensis (Aubl.) Pers. x 1 R
Vismia magnoliifolia Schltdl. & Cham. x 1 R
Vismia sp. x 1 R
Vitex megapotamica (Spreng.) Moldenke x x 2 R LACISTEMATACEAE
Lacistema hasslerianum Chodat x 1 R LAMIACEAE
Vitex polygama Cham. x x x 3 R LAURACEAE
Aniba firmula (Nees & Mart. ex Nees) Mez x 1 R
Aniba sp. x 1 R
Cinnamomum glaziovii (Mez) Kosterm. x 1 R
Cinnamomum triplinerve (Ruiz & Pav.) Kosterm. x 1 R
Cryptocarya aschersoniana Mez x x x x x x x 7 C
Endlicheria paniculata (Spreng.) J.F. Macbr. x x x 3 R
Endlicheria verticillata Mez x 1 R
Lauraceae sp. 1 x 1 R
Nectandra oppositifolia Nees & Mart. x x x x x x x 7 C
Ocotea aciphylla (Nees & Mart.) Mez x 1 R
Ocotea brachybotrya (Meisn.) Mez x 1 R
Ocotea corymbosa (Meisn.) Mez x x x x 4 R
Ocotea diospyrifolia (Meisn.) Mez x x 2 R
Ocotea divaricata (Nees) Mez x x x 3 R
Ocotea minarum (Nees & Mart.) Mez x x 2 R
Ocotea odorífera Rohwer x x 2 R
Ocotea sp. x 1 R
Persea rufotomentosa Nees & C. Mart. x 1 R MALVACEAE
Ceiba speciosa (A. St.-Hil.) Ravenna x 1 R
Luehea candicans Mart. x 1 R
Luehea grandiflora Mart. x 1 R
MELASTOMATACEAE
Leandra scabra DC. x x 2 R
Leandra sp. x x x 3 R
Miconia castaneifolia Naudin x x 2 R
Miconia cf. petropolitana Cogn. x 1 R
Miconia chartacea Triana x x x x 4 R
Miconia cinerascens Miq. x 1 R
Miconia cinnamomifolia (DC.) Naudin x x x x x 5 C
Miconia latecrenata (DC.) Naudin x 1 R
Miconia pusilliflora (DC.) Naudin x x 2 R
Miconia sellowiana Naudin x x x 3 R
Miconia sp x x x x x x 6 C
Miconia tristes Spring x 1 R
Miconia urophylla DC. x x 2 R
Miconia willdenowii Klotzsch ex Naudin x 1 R
Tibouchina estrellensis (Raddi) Cogn. x x 2 R
Tibouchina fissinervia Cogn. x 1 R
Tibouchina fothergillae (DC.) Cogn. x 1 R
Spermatophytes FAMILY
Species
Localities
Total FO AIU BOC CAM CAX DEL EXT GUA MAR MON MVE PA
S
POÇ POU SGS SRJ VIR
Tibouchina sp. x 1 R MELIACEAE
Cabralea canjerana (Vell.) Mart. x x x x x 5 C
Guarea kunthiana A. Juss. x 1 R
Trichilia catiguá A. Juss. x x x 3 R
Trichilia claussenii C. DC. x x 2 R
Trichilia elegans A. Juss. x x 2 R
Trichilia pallida Sw. x x 2 R MONIMINIACEAE
Macropeplus dentatus (Perkins) I. Santos & Peixoto x 1 R
Mollinedia argyrogyna Perkins x x 2 R
Mollinedia sp. x 1 R
Mollinedia widgrenii A. DC. x 1 R MORACEAE
Ficus enormis (Mart. ex Miq.) Mart. x 1 R
Maclura tinctoria (L.) D. Don ex Steud. x x 2 R
Sorocea bonplandii (Baill.) W.C. Burg., Lanj. &
Wess. Boer x x x x x 5 C
MYRTACEAE
Blepharocalyx salicifolius (Kunth) O. Berg x x 2 R
Calyptranthes brasiliensis Spreng. x 1 R
Calyptranthes clusiifolia (Miq.) O. Berg x x x x 4 R
Calyptranthes sp. x x x 2 R
Calyptranthes widgreniana O. Berg x x 2 R
Campomanesia guazumifolia (Cambess.) O. Berg x 1 R
Campomanesia sessiliflora (O. Berg) Mattos x 1 R
Campomanesia sp. x x 2 R
Eugenia acutata Miq. x x x 3 R
Eugenia blastantha (O. Berg) D. Legrand x 1 R
Eugenia florida DC. x 1 R
Eugenia handroana D. Legrand x 1 R
Eugenia sonderiana O. Berg x x x x 4 R
Eugenia sp. x x x 3 R
Marlierea laevigata (DC.) Kiaersk. x 1 R
Marlierea racemosa (Vell.) Kiaersk. x 1 R
Myrceugenia miersiana (Gardner) D. Legrand &
Kausel x 1 R
Myrceugenia myrcioides (Cambess.) O. Berg x 1 R
Myrceugenia sp. x 1 R
Myrcia guianensis (Aubl.) DC. x x 2 R
Myrcia hebepetala DC. x 1 R
Myrcia multiflora (Lam.) DC. x 1 R
Myrcia obovata (O. Berg) Nied. x 1 R
Myrcia perforata O. Berg x 1 R
Myrcia retorta Cambess. x 1 R
Myrcia sp. x x x 3 R
Myrcia splendens (Sw.) DC. x x x x x x x x x x 10 F
Pimenta pseudocaryophyllus (Gomes) Landrum x x 2 R
Pisidium sp. x 1 R
Psidium rufum DC. x 1 R
Psidium sp. x x 2 R
Siphoneugena densiflora O. Berg x x x 3 R
Siphoneugena reitzii D. Legrand x x x 3 R
Siphoneugena widgreniana O. Berg x 1 R NYCTAGINACEAE
Guapira opposita (Vell.) Reitz x x x 3 R
Guapira sp. x 1 R
OCHNACEAE
Ouratea semiserrata (Mart. & Nees) Engl. x 1 R OLEACEAE
Chionanthus filiformis (Vell.) P.S. Green x 1 R
Spermatophytes FAMILY
Species
Localities
Total FO AIU BOC CAM CAX DEL EXT GUA MAR MON MVE PA
S
POÇ POU SGS SRJ VIR
OPILIACEAE
Agonandra excelsa Griseb. x 1 R PENTAPHYLACACEAE
Ternstroemia brasiliensis Cambess. x 1 R PHYLLANTHACEAE
Hyeronima alchornioides Allemão x 1 R PHYTOLACCACEAE
Gallesia integrifólia (Spreng.) Harms x x 2 R PRIMULACEAE
Myrsine coriacea (Sw.) R. Br. ex Roem. & Schult. x 1 R
Myrsine lineata (Mez) Imkhan. x x x 3 R
Myrsine sp. x x 2 R
Myrsine umbellata Mart. x x x x x x 6 C PROTEACEAE
Euplassa rufa (Loes.) Sleumer x 1 R
Roupala meisneri Sleumer x 1 R
Roupala montana Aubl. x 1 R RHAMNACEAE
Rhamnidium elaeocarpum Reissek x 1 R ROSACEAE
Prunus myrtifolia (L.) Urb. x x x x x x x 7 C RUBIACEAE
Alseis sp. x x 2 R
Amaioua guianensis Aubl. x x x x x x x 7 C
Chomelia sericea Müll. Arg. x 1 R
Cordiera concolor (Cham.) Kuntze x x x 3 R
Cordiera sp. x 1 R
Coussarea contracta (Walp.) Müll. Arg. x 1 R
Coussarea sp. x 1 R
Coutarea hexandra (Jacq.) K. Schum. x x 2 R
Ixora brevifolia Benth. x x 2 R
Ixora sp. x 1 R
Psychotria myriantha Müll. Arg. x 1 R
Psychotria sp. x x 1 R
Psychotria vellosiana Benth. x x x x x x x x x x 10 F
Rudgea jasminoides (Cham.) Müll. Arg. x x 2 R
Rudgea sp. x 1 R
RUTACEAE
Metrodorea nigra A. St.-Hil. x x 2 R
Metrodorea stipularis Mart. x 1 R
Zanthoxylum fagara (L.) Sarg. x x x 3 R SABIACEAE
Meliosma sinuata Urb. x 1 R SALICACEAE
Casearia decandra Jacq. x x x x x 5 C
Casearia lasiophylla Eichler x x 2 R
Casearia obliqua Spreng. x x x x 4 R
Casearia sylvestris Sw. x x x x 4 R
Prockia crucis P. Browne ex L. x 1 R SAPINDACEAE
Cupania paniculata Cambess. x x 2 R
Cupania vernalis Cambess. x x 2 R
Cupania zanthoxyloides Cambess. x x 2 R
Matayba cf. robusta Radlk. x 1 R
Matayba guianensis Aubl. x x 2 R
Matayba juglandifolia Radlk. x x x 3 R
Toulicia subsquamulata Radlk. x 1 R SAPOTACEAE
Chrysophyllum gonocarpum (Mart. & Eichler ex
Miq.) Engl. x 1 R
SIPARUNACEAE
Siparuna brasiliensis (Spreng.) A. DC. x 1 R