369
The structure of rocky reef fish assemblages across a nearshore to coastal
islands’ gradient in Southeastern Brazil
Fernando Zaniolo Gibran
1and Rodrigo Leão de Moura
2Local assemblages of fishes associated with reefs are influenced by interactions among the availability of larvae and survival of recruits with subsequent biotic and abiotic forcing, as well as by periodic and episodic disturbances of varying natures and magnitudes. Therefore, besides being structurally heterogeneous and patchily distributed, reef systems are strongly context-dependent due to the influence of a broad array of ecological processes. In order to assess interactions of local factors that influence the distribution and abundance of reef fishes within a coastal mosaic of rocky reefs, we tested the null hypothesis of no significant variation in fish assemblage structure, by comparing 33 sites along the northern coast of the São Paulo State, Southeastern Brazil. Replicated stationary visual census samples (n = 396) were obtained at different distances from the coast, depths and wave exposures, including the mainland, three relatively small coastal islands, and the two margins of a wide channel between the mainland and the large São Sebastião Island (~350 km2), totaling 225 h of SCUBA diving. The regional rocky shore fish fauna comprised 106 species (41 families), with preponderance of diurnal mobile-invertebrate feeders. Samples from the outer margin of the São Sebastião Island, together with those from Alcatrazes, Búzios, and Vitória islands were significantly dissimilar from samples from the coastal sites at the São Sebastião Channel. Species richness tended to increase in a gradient from the coast to the more offshore islands. Local conditions such as depth and other habitat characteristics also influenced fish assemblages’ structure. Distance from coast and depth were the main predictors for fish assemblages, followed by water transparency, temperature and benthic cover. This study represents the first regional-scale assessment of fish assemblages associated with rocky reefs in the São Paulo State coast, filling a major geographic knowledge gap in the South Atlantic. As the study region is experiencing fast coastal development and growing threats from seaport expansion, oil and gas exploitation, as well as increasing fishing and tourism pressure, the understanding of the underlying factors that influence the distribution and abundance of the reef-associated biota comprises a relevant baseline for monitoring, conservation planning and management.
Assembleias locais de peixes associados a recifes são influenciadas pela interação entre a disponibilidade de larvas e recrutas e as forças bióticas e abióticas que operam após o recrutamento, assim como por perturbações periódicas e episódicas de diversos tipos e magnitudes. Dessa forma, além de serem estruturalmente heterogêneos e irregularmente distribuídos, os sistemas recifais são altamente dependentes do contexto em que se inserem. Com o objetivo de compreender interações de fatores locais que influenciam a distribuição e abundância de peixes recifais em um mosaico costeiro de recifes rochosos, testamos a hipótese nula de inexistência de variação significativa na estrutura dessas assembleias através da comparação de 33 sítios da costa norte do Estado de São Paulo, Sudeste do Brasil. Foram obtidas amostras replicadas de censos visuais (n = 396) em diferentes distâncias da costa, profundidades e exposições ao batimento de ondas, incluindo o continente, as duas margens do Canal de São Sebastião, a Ilha de São Sebastião (~350 km2) e três ilhas costeiras menores e mais afastadas da costa, totalizando 225 h de amostragens subaquáticas. Foram registradas 106 espécies (41 famílias) de peixes recifais, com preponderância de invertívoros diurnos. Amostras da margem externa da Ilha de São Sebastião, juntamente com as das ilhas de Alcatrazes, Búzios e Vitória foram significativamente diferentes das da costa e do Canal, com uma clara tendência de aumento na riqueza de espécies do continente para as ilhas. A distância da costa e a profundidade foram as variáveis com maior influência sobre as assembleias de peixes, seguidas pela transparência da água, temperatura e cobertura bentônica. Este é o primeiro levantamento das assembleias de peixes associados a recifes rochosos no Estado de São Paulo, preenchendo uma grande lacuna geográfica no conhecimento sobre peixes recifais no Atlântico Sul. Além disso, como a região estudada está sob ampliação da infra-estrutura portuária e de exploração de petróleo e gás, bem como sob forte pressão de pesca comercial e recreativa, a compreensão dos fatores que influenciam a distribuição e abundância de organismos recifais é essencial para o planejamento de ações de monitoramento, conservação e gestão costeira.
Key words: Coastal management, São Paulo coast, São Sebastião Channel, South Atlantic, Species richness.
1Universidade Federal do ABC (UFABC), Centro de Ciências Naturais e Humanas (CCNH). Rua Santa Adélia, 166, Bairro Bangu,
09210-170 Santo André, SP, Brazil and Centro de Biologia Marinha, Universidade de São Paulo (CEBIMar-USP), São Sebastião, SP, Brazil. [email protected]
2Universidade Federal do Rio de Janeiro, Centro de Ciências da Saúde, Instituto de Biologia. Av. Carlos Chagas Filho, 373, Sala A1-050, Ilha
Introduction
Most fish species inhabit tropical or subtropical waters (Eschmeyer et al., 2010), 40% of them living associated to shallow continental shelves (Lowe-McConnell, 1999; Nelson, 2006). While regional diversity is determined by processes operating at very large spatial and temporal scales (e.g. Rocha et al., 2005; Robertson et al., 2006), the factors that influence the structure of local assemblages of reef-associated organisms are more context-dependent due to the highly variable biotic and abiotic forcing, as well as by the regional disturbance regimes (Sale, 1991a, 1991b, 2006). Current understanding about the ecology and behavior of reef fishes is biased towards the highly diverse tropical coral reef habitats (e.g. Sale, 2006), but reef fishes also live associated to other hard substrata types, with many tropical species spanning their distribution to marginal rocky shore areas that can support a combination of subtropical and temperate species (Bellwood, 1998; Ferreira et al., 2001).
More than 1,300 species of marine fishes are recorded from Brazil (Menezes et al., 2003), one third of these associated with hard substrata (Moura & Sazima, 2003). Approximately 20% of these reef-associated species are endemic to the Southwestern Atlantic (Floeter & Gasparini, 2000; Moura & Sazima, 2003), representing up to 80% of the total number of individuals and/or biomass in local assemblages (Ferreira et al., 1995; Rosa & Moura, 1997; Francini-Filho & Moura, 2008) and therefore playing important ecological roles. In the Southwestern Atlantic, coralline reefs occur from the Amazon River mouth to the State of Bahia (0o30’-18o20’S) (Moura et al., 1999a), but reef fish assemblages occur up to 28oS, across the entire region with extensive rocky reefs between the Espírito Santo and Santa Catarina States (Moura et al., 1999b; Floeter et al., 2001). Ecological studies focusing on reef fish assemblages are largely focused on tropical coralline reefs (e.g. Francini-Filho & Moura, 2008) and oceanic islands (e.g. Krajewsky & Floeter, 2011; Pereira-Filho et al., 2011), with relatively fewer studies at the rocky shores along the southeastern and southern Brazilian coast (e.g. Floeter et al., 2007).
The São Paulo State, with ~700 km of coastline (23o 15’-25o15’S), encompasses a broad diversity of shore types. While the central and southern portion of the coast have few coastal islands and large extensions of estuaries and sandy shores, its northern portion is dominated by rocky shores and sandy beaches, bearing 76 islands and islets with rocky shores. The large São Sebastião Island (336 km2), separated from the continent by a relatively narrow and deep channel (São Sebastião Channel), is a prominent feature within the northern São Paulo State coast. Besides a number of islets and small rocky outcrops adjacent to the coast and the São Sebastião Island, three smaller islands laying up to 30 km offshore are additional remarkable features in the coastal landscape, providing a relevant geographical setting for exploring the factors that influence the structuring of reef fish communities in this region.
Our study aimed to assess the distribution and abundance of reef fishes within this coastal mosaic of rocky reefs by testing the null hypothesis of no significant variation in fish assemblage structure. For this task, we explored the effects of the distance from the coast, visibility, exposure to wave surge, depth, temperature, substrate complexity and cover, and fisheries pressure over reef fish assemblages in 33 sites distributed across four inner and mid shelf strata. Besides providing the first quantitative assessment of the reef fish assemblages for this entire region, our study can be useful as a baseline for conservation planning, monitoring and management. The region has few Marine Protected Areas and is poorly managed, being under severe impacts from a large seaport and oil/gas terminals. Steadily increasing threats include coastal development (e.g. deforestation, watershed pollution, sewage discharge), seaport expansion and dredging, as well as industrial fisheries (including highly destructive bottom trawling) and rapidly growing recreational fisheries targeting reef fishes (both with spears and hook-and-line).
Material and Methods
Study area. The São Sebastião Channel (23º41’ - 23º54’S, 45º19’ - 45º30’W) is a 25 km strait in the northern coast of São Paulo State, Southeastern Brazil, located between the São Sebastião Island and the mainland (Fig. 1). Its northern and southern mouths have 6 and 7 km widths, respectively, narrowing to 2 km at the central area, where a seaport and a platform for oil tankers are located. Due to the curvature of the channel and water circulation patterns, sediment deposition is higher at its continental margin and near the edges (Furtado, 1995; Miranda & Castro Filho, 1995), resulting in a shallower sandy-muddy continental margin and a deeper insular margin with gravel or sandy bottom. Both margins bear sandy and muddy beaches and rocky shores, and the continental margin also presents small creeks with mangrove vegetation. The channel reaches 45 m, with the northern and southern mouths presenting maximum depths of 25 and 20 m, respectively.
Eighteen islets and nearshore rocky outcrops, as well as three islands with rocky shores (Búzios, Vitória, and Alcatrazes) are present in the vicinities of the larger 336 km2 São Sebastião Island (Fig. 1). Búzios island has 7.6 km2 and is located 7 km off the São Sebastião Island, while Vitória and Alcatrazes islands have 2 and 1.4 km2 and are located 20 and 30 km off the São Sebastião Island, respectively. The two margins of the São Sebastião Channel, the outer margin of the São Sebastião Island and the three islands included in this study are located across a well-evident gradient of water transparency, distance from the coast and depth. The Cabras Islet (0.02 km2), the three sampling sites adjacent to the Centro de Biologia Marinha da Universidade de São Paulo (CEBIMar-USP), and the Alcatrazes Island are no-take Marine Protected Areas (MPAs), while all other sites are open for recreational and commercial fishing (Fig. 1).
zoogeographic province (sensu Briggs, 1974), being under the influence of warm oligotrophic waters from the Brazil Current (BC) and cold nutrient-rich waters from the Falklands Current (FC), being also influenced by cold and nutrient-rich water intrusions of the South Atlantic Central Water (SACW) over the shelf, and seasonal (summer) upwelling (Matsuura, 1986; Castro Filho & Miranda, 1998).
Field work. Data was obtained during 225 h of SCUBA diving (168 h for standardized fish counts and the remaining time for collecting and photo/video records). Primary sampling included 30 sites distributed in three strata surveyed from March 2006 to September 2007: Continental Margin (ConMar), Insular Margin (InsMar), Outer Margin (OutMar) (Fig. 1). Ten sites were sampled in each stratum, 12 samples per site, totaling 120 samples in each stratum. Additional sampling was also carried out in the Alcatrazes island (AZ) in November 2005 and July 2008, and in the Búzios (BZ) and Vitória (VT) islands, surveyed in March 2007 (BZ), January 2008 (BZ and VT), and April 2008 (VT). Twelve samples were also obtained in each of these islands, which comprise the fourth Insular (IS)
stratum included in the analyses (Fig. 1). Sampling depth ranged from 1.3-14 m in the ConMar, 1-13.5 m in the InsMar, 1.8-24 m in the OutMar, and 6-24 m in the IS stratum.
few instances of limited visibility (mainly at the continental margin of the São Sebastião Channel) the diver moved slowly inside the smaller cylinder, allowing for sampling with visibility of at least 2 m. Markers were positioned just before sampling, and the sampling progression was always from deeper to shallower water. Specimen collections and video/ photo records were performed to confirm or facilitate fish identification (see Gibran & Castro, 1999; Gibran, 2007, 2010).
Environmental variables. Biotic and physical variables were recorded inside each sample unit and included depth, visibility, temperature, waves and currents, distance offshore, benthic cover and structural complexity. Waves and current were coded as (0) for none or very low, (1) for low, (2) for moderate, or (3) for high. Substrate complexity was calculated accordingly to Luckhurst & Luckhurst (1978). Benthic cover was scored based in the percent cover of dominant organisms as: (0) bare rock or little cover of filamentous and encrusting calcareous algae; (1) uniform cover of up to two dominant organisms (e.g.Palythoa, Carijoa, Sargassum, bare rock with sea urchins); (2) at least three dominant benthic cover organisms (3) diversified, colorful and heterogeneous benthic cover with no obviously dominant organisms.
Water temperature ranged from 15 to 29ºC. Horizontal visibility was 3.6 ±1.4 m in the Continental Margin, 3.6 ±1 m in the Insular Margin, 6.4 ±3.9 m in the Outer Margin, 7.6 ±4 m in the Alcatrazes Island, 16.8 ±5.7 m in the Búzios Island, and 9.7 ±3.9 m in the Vitória Island. A “Fishing Index” (i.e. the number of pieces of loose fishing gear noted inside the sampled unit; cf. Bohnsack & Bannerot, 1986) was also scored for each sampling unit.
Data analysis. Species richness was estimated from visual census data using the Abundance-based Coverage Estimator (ACE) (Colwell & Coddington, 1994; Chazdon et al., 1998). Calculations were performed with the software EstimateS 8.2 (Colwell, 2011). Non-metric multidimensional scaling (NMDS) was used to summarize similarities (Bray-Curtis) in fish assemblages among the four strata. One-way analysis of similarity (ANOSIM) was performed to evaluate differences between strata and habitats, while two-way nested ANOSIM were performed to evaluate differences between habitat groups across and between strata, using pooled abundances for habitats as samples (Clarke, 1993; Clarke & Warwick, 2001; Pereira-Filho et al., 2011). The Similarity Percentage Analysis (SIMPER; Clarke, 1993; Clarke & Warwick, 2001) was used to identify the contribution of each fish species between groups of samples, and also to determine its contribution to similarity within groups (Clarke & Warwick, 2001). Canonical Correspondence Analyses (CCA; ter Braak, 1986, 1994) was used to evaluate the influence of environmental variables over fish assemblages, with a forward selection procedure to select the most important independent variables. Only the 31 species representing more than 0.45% of total abundance were used in the analyses, performed with log(x+1) transformed data in order to avoid the excessive weight of numerically dominant species (see Clarke & Warwick, 2001).
Results
We recorded 106 species of benthic and nektobenthic fishes in the study area, belonging to 41 families (Table 1). The seven most specious families were Epinephelidae, Labridae, Scaridae (seven species each), Haemulidae, Pomacentridae, Serranidae (six species each) and Blenniidae (five species), together accounting for 41.5% of the recorded species (Table 1).
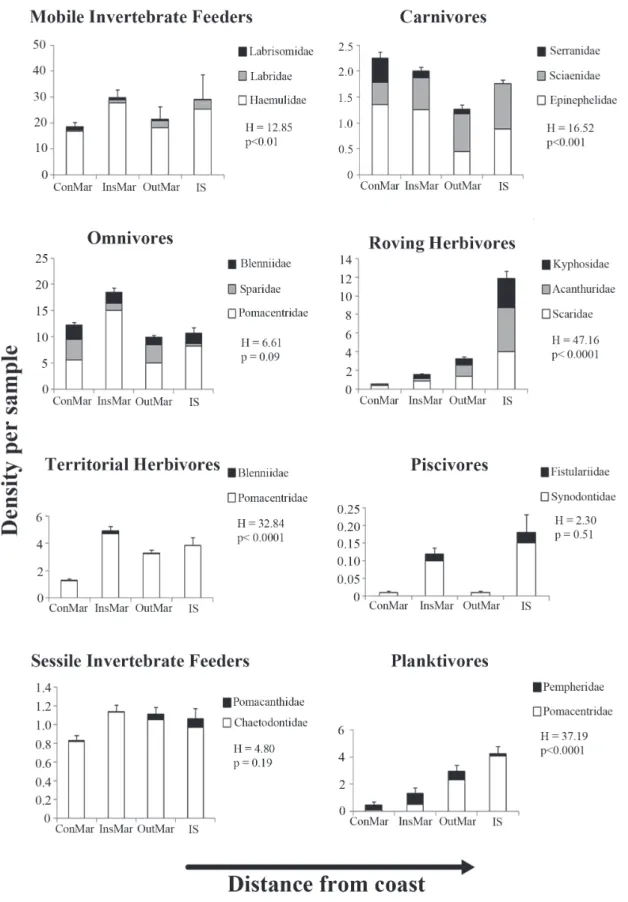
Mobile invertebrate feeders (39 species) predominated in all cross-shelf strata, always representing more than 30% of the species in each stratum, with five species also preying upon zooplankton (Apogon pseudomaculatus, Haemulon spp. and Hippocampus reidi) (Table 1; Fig. 2). Carnivores include commercially important species such as Centropomus undecimalis, all epinephelids, and Lutjanus spp. Herbivores include species feeding on plant material and detritus, including larger roving (acanthurids, kyphosids and scarids) and smaller territorial herbivores (Scartella cristata and Stegastes spp.), as well as more generalist feeders (sometimes regarded as omnivores) (e.g.Abudefduf saxatilis, Diplodus argenteus and Parablennius pilicornis). Six species (5.7%) are zooplanktivores: Chromis enchrysura, C. multilineata, Clepticus brasiliensis, Myripristis jacobus, Pempheris schomburgkii, and Thalassoma noronhanum (Table 1; Fig. 2). Diurnal species predominate (72.6 %), while diurnal/crepuscular species accounted for 7.5%, diurnal/nocturnal for 5.7%, and nocturnal/crepuscular for 2.8% of the total number of species recorded. The species with strictly nocturnal habits (11.3%) were observed to dwell predominantly near and at the interfaces between the reef and adjacent soft bottom flats.
Mobile invertebrate feeders, omnivores, territorial herbivores, sessile invertebrate feeders, and piscivores showed no clear spatial pattern of abundance (Fig. 3). On the other hand, density of roving herbivores and of planktivores increased with the distance from coast, while the density of carnivores tended to decrease with the distance from the coast (Fig. 3).
The four most abundant species, with more than 1,000 individuals counted, were: Haemulon aurolineatum (n = 6,260; 31% of the total number of individuals), A. saxatilis (n = 3,347; 16.5%), Stegastes fuscus (n = 1,139; 5.6%) and D. argenteus (n = 1,025; 5%). The ten more frequent species were: A. saxatilis (with 59% of frequency of occurrence), H. aurolineatum (57%), S. fuscus (53%), Chaetodon striatus (52%), D. argenteus (51%), Anisotremus virginicus (50%), Halichoeres poeyi (46%), P. pilicornis (40%), Mycteroperca marginata (34%) and Haemulon steindachneri (32%). Most species recorded in the fish counts (n = 74) had less of 10% occurrence frequency, 47 of these with less than 1%.
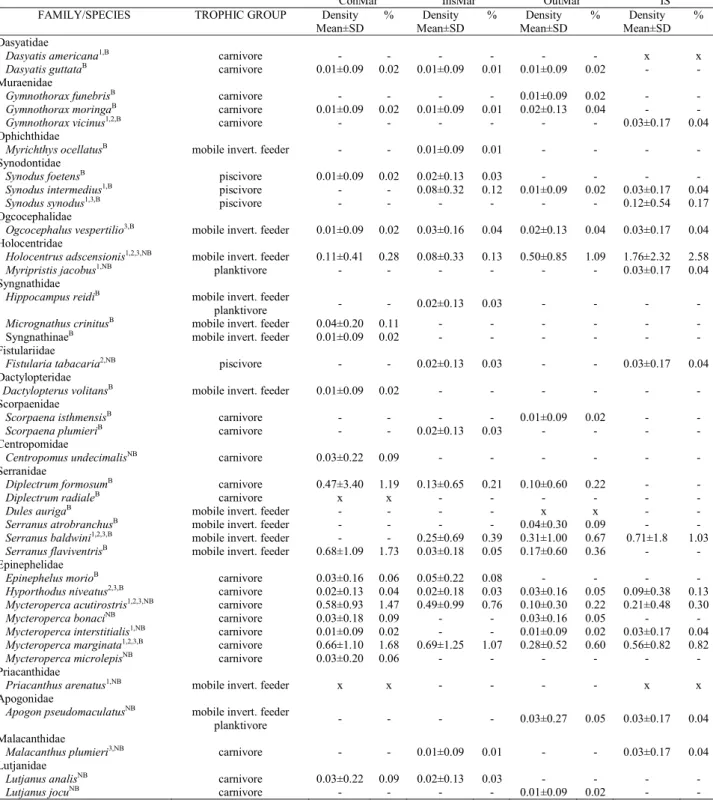
Table 1. Rocky shore fish fauna recorded in the study region and quantitative summary for each stratum. ConMar = Continental Margin of the São Sebastião Channel; InsMar = Insular Margin of the São Sebastião Channel; OutMar = Outer Margin of São Sebastião Island; IS = islands (Alcatrazes, Búzios and Vitória). Systematic order follows Nelson (2006), Craig & Hastings (2007) and Smith & Craig (2007). Species in bold type were not observed during the censuses. Trophic groups based in data from underwater observations and stomach content analysis in Gibran & Castro (1999), Gibran (2007) and Pires & Gibran (2011), and additional literature (Randall, 1996; Carvalho-Filho, 1999; Santos, 2005) - but see Ferreira et al. (2004) for categories’ details. Species observed only during the collecting activities, photo or video records are marked with an “x” (presence) or “-” (absence). Species recorded for each of the three islands or at another locality inside the study area are discriminated with superscripts (Alcatrazes1, Búzios2, Vitória3, Farol dos Moleques4, and Channel buoys 5 - see Fig. 1 for a map). Species are also discriminated with superscripts by their positions in the water column: benthicB or nektobenthicNB.
ConMar InsMar OutMar IS
FAMILY/SPECIES TROPHIC GROUP Density Mean±SD
% Density Mean±SD
% Density Mean±SD
% Density Mean±SD
%
Dasyatidae
Dasyatis americana1,B carnivore - - - x x
Dasyatis guttataB carnivore 0.01±0.09 0.02 0.01±0.09 0.01 0.01±0.09 0.02 - -
Muraenidae
Gymnothorax funebrisB carnivore - - - - 0.01±0.09 0.02 - -
Gymnothorax moringaB carnivore 0.01±0.09 0.02 0.01±0.09 0.01 0.02±0.13 0.04 - -
Gymnothorax vicinus1,2,B carnivore - - - 0.03±0.17 0.04
Ophichthidae
MyrichthysocellatusB mobile invert. feeder - - 0.01±0.09 0.01 - - - -
Synodontidae
Synodus foetensB piscivore 0.01±0.09 0.02 0.02±0.13 0.03 - - - -
Synodus intermedius1,B piscivore - - 0.08±0.32 0.12 0.01±0.09 0.02 0.03±0.17 0.04
Synodus synodus1,3,B piscivore - - - 0.12±0.54 0.17
Ogcocephalidae
Ogcocephalusvespertilio3,B mobile invert. feeder 0.01±0.09 0.02 0.03±0.16 0.04 0.02±0.13 0.04 0.03±0.17 0.04
Holocentridae
Holocentrusadscensionis1,2,3,NB mobile invert. feeder 0.11±0.41 0.28 0.08±0.33 0.13 0.50±0.85 1.09 1.76±2.32 2.58
Myripristis jacobus1,NB planktivore - - - 0.03±0.17 0.04
Syngnathidae
HippocampusreidiB mobile invert. feeder
planktivore - - 0.02±0.13 0.03 - - - -
Micrognathus crinitusB mobile invert. feeder 0.04±0.20 0.11 - - - - - -
SyngnathinaeB mobile invert. feeder 0.01±0.09 0.02 - - - - - -
Fistulariidae
Fistulariatabacaria2,NB piscivore - - 0.02±0.13 0.03 - - 0.03±0.17 0.04
Dactylopteridae
DactylopterusvolitansB mobile invert. feeder 0.01±0.09 0.02 - - - - - -
Scorpaenidae
ScorpaenaisthmensisB carnivore - - - - 0.01±0.09 0.02 - -
ScorpaenaplumieriB carnivore - - 0.02±0.13 0.03 - - - -
Centropomidae
CentropomusundecimalisNB carnivore 0.03±0.22 0.09 - - -
Serranidae
Diplectrum formosumB carnivore 0.47±3.40 1.19 0.13±0.65 0.21 0.10±0.60 0.22 - -
Diplectrum radialeB carnivore x x - - -
Dules aurigaB mobile invert. feeder - - - - x x - -
Serranus atrobranchusB mobile invert. feeder - - - - 0.04±0.30 0.09 - -
Serranus baldwini1,2,3,B mobile invert. feeder - - 0.25±0.69 0.39 0.31±1.00 0.67 0.71±1.8 1.03
SerranusflaviventrisB mobile invert. feeder 0.68±1.09 1.73 0.03±0.18 0.05 0.17±0.60 0.36 - -
Epinephelidae
Epinephelus morioB carnivore 0.03±0.16 0.06 0.05±0.22 0.08 - - - -
Hyporthodus niveatus2,3,B carnivore 0.02±0.13 0.04 0.02±0.18 0.03 0.03±0.16 0.05 0.09±0.38 0.13
Mycteropercaacutirostris1,2,3,NB carnivore 0.58±0.93 1.47 0.49±0.99 0.76 0.10±0.30 0.22 0.21±0.48 0.30
Mycteroperca bonaciNB carnivore 0.03±0.18 0.09 - - 0.03±0.16 0.05 - -
Mycteroperca interstitialis1,NB carnivore 0.01±0.09 0.02 - - 0.01±0.09 0.02 0.03±0.17 0.04
Mycteropercamarginata1,2,3,B carnivore 0.66±1.10 1.68 0.69±1.25 1.07 0.28±0.52 0.60 0.56±0.82 0.82
Mycteroperca microlepisNB carnivore 0.03±0.20 0.06 - - -
Priacanthidae
Priacanthus arenatus1,NB mobile invert. feeder x x - - - - x x
Apogonidae
Apogon pseudomaculatusNB mobile invert. feeder
planktivore - - - - 0.03±0.27 0.05 0.03±0.17 0.04 Malacanthidae
Malacanthus plumieri3,NB carnivore - - 0.01±0.09 0.01 - - 0.03±0.17 0.04
Lutjanidae
LutjanusanalisNB carnivore 0.03±0.22 0.09 0.02±0.13 0.03 - - - -
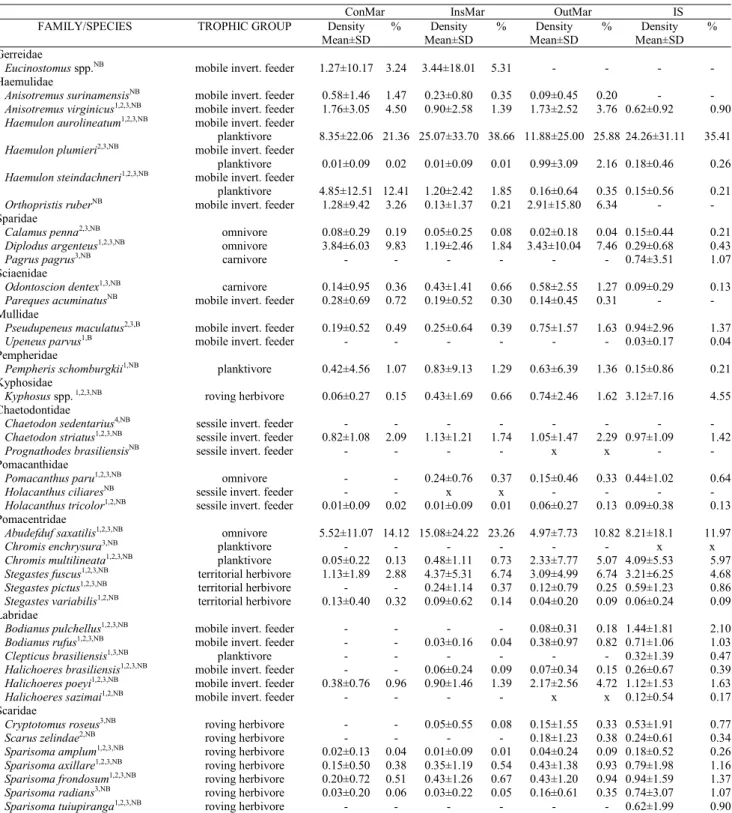
Table 1. (cont.) Rocky shore fish fauna recorded in the study region and quantitative summary for each stratum. ConMar = Continental Margin of the São Sebastião Channel; InsMar = Insular Margin of the São Sebastião Channel; OutMar = Outer Margin of São Sebastião Island; IS = islands (Alcatrazes, Búzios and Vitória). Systematic order follows Nelson (2006), Craig & Hastings (2007) and Smith & Craig (2007). Species in bold type were not observed during the censuses. Trophic groups based in data from underwater observations and stomach content analysis in Gibran & Castro (1999), Gibran (2007) and Pires & Gibran (2011), and additional literature (Randall, 1996; Carvalho-Filho, 1999; Santos, 2005) - but see Ferreira et al.. (2004) for categories’ details. Species observed only during the collecting activities, photo or video records are marked with an “x” (presence) or “-” (absence). Species recorded for each of the three islands or at another locality inside the study area are discriminated with superscripts (Alcatrazes1, Búzios2, Vitória3, Farol dos Moleques4, and Channel buoys 5 - see Fig. 1 for a map). Species are also discriminated with superscripts by their positions in the water column: benthicB or nektobenthicNB.
ConMar InsMar OutMar IS
FAMILY/SPECIES TROPHIC GROUP Density Mean±SD
% Density Mean±SD
% Density Mean±SD
% Density Mean±SD
% Gerreidae
Eucinostomus spp.NB mobile invert. feeder 1.27±10.17 3.24 3.44±18.01 5.31 - - - -
Haemulidae
Anisotremus surinamensisNB mobile invert. feeder 0.58±1.46 1.47 0.23±0.80 0.35 0.09±0.45 0.20 - -
Anisotremusvirginicus1,2,3,NB mobile invert. feeder 1.76±3.05 4.50 0.90±2.58 1.39 1.73±2.52 3.76 0.62±0.92 0.90
Haemulon aurolineatum1,2,3,NB mobile invert. feeder
planktivore 8.35±22.06 21.36 25.07±33.70 38.66 11.88±25.00 25.88 24.26±31.11 35.41
Haemulon plumieri2,3,NB mobile invert. feeder
planktivore 0.01±0.09 0.02 0.01±0.09 0.01 0.99±3.09 2.16 0.18±0.46 0.26
Haemulonsteindachneri1,2,3,NB mobile invert. feeder
planktivore 4.85±12.51 12.41 1.20±2.42 1.85 0.16±0.64 0.35 0.15±0.56 0.21
OrthopristisruberNB mobile invert. feeder 1.28±9.42 3.26 0.13±1.37 0.21 2.91±15.80 6.34 - -
Sparidae
Calamuspenna2,3,NB omnivore 0.08±0.29 0.19 0.05±0.25 0.08 0.02±0.18 0.04 0.15±0.44 0.21
Diplodusargenteus1,2,3,NB omnivore 3.84±6.03 9.83 1.19±2.46 1.84 3.43±10.04 7.46 0.29±0.68 0.43
Pagrus pagrus3,NB carnivore - - - 0.74±3.51 1.07
Sciaenidae
Odontosciondentex1,3,NB carnivore 0.14±0.95 0.36 0.43±1.41 0.66 0.58±2.55 1.27 0.09±0.29 0.13
ParequesacuminatusNB mobile invert. feeder 0.28±0.69 0.72 0.19±0.52 0.30 0.14±0.45 0.31 - -
Mullidae
Pseudupeneusmaculatus2,3,B mobile invert. feeder 0.19±0.52 0.49 0.25±0.64 0.39 0.75±1.57 1.63 0.94±2.96 1.37
Upeneusparvus1,B mobile invert. feeder - - - - - - 0.03±0.17 0.04
Pempheridae
Pempherisschomburgkii1,NB planktivore 0.42±4.56 1.07 0.83±9.13 1.29 0.63±6.39 1.36 0.15±0.86 0.21
Kyphosidae
Kyphosus spp. 1,2,3,NB roving herbivore 0.06±0.27 0.15 0.43±1.69 0.66 0.74±2.46 1.62 3.12±7.16 4.55
Chaetodontidae
Chaetodon sedentarius4,NB sessile invert. feeder - - -
Chaetodonstriatus1,2,3,NB sessile invert. feeder 0.82±1.08 2.09 1.13±1.21 1.74 1.05±1.47 2.29 0.97±1.09 1.42
Prognathodes brasiliensisNB sessile invert. feeder - - - - x x - -
Pomacanthidae
Pomacanthusparu1,2,3,NB omnivore - - 0.24±0.76 0.37 0.15±0.46 0.33 0.44±1.02 0.64
Holacanthus ciliaresNB sessile invert. feeder - - x x - - - -
Holacanthus tricolor1,2,NB sessile invert. feeder 0.01±0.09 0.02 0.01±0.09 0.01 0.06±0.27 0.13 0.09±0.38 0.13
Pomacentridae
Abudefdufsaxatilis1,2,3,NB omnivore 5.52±11.07 14.12 15.08±24.22 23.26 4.97±7.73 10.82 8.21±18.1 11.97
Chromis enchrysura3,NB planktivore - - - x x
Chromismultilineata1,2,3,NB planktivore 0.05±0.22 0.13 0.48±1.11 0.73 2.33±7.77 5.07 4.09±5.53 5.97
Stegastesfuscus1,2,3,NB territorial herbivore 1.13±1.89 2.88 4.37±5.31 6.74 3.09±4.99 6.74 3.21±6.25 4.68
Stegastes pictus1,2,3,NB territorial herbivore - - 0.24±1.14 0.37 0.12±0.79 0.25 0.59±1.23 0.86
Stegastesvariabilis1,2,NB territorial herbivore 0.13±0.40 0.32 0.09±0.62 0.14 0.04±0.20 0.09 0.06±0.24 0.09
Labridae
Bodianus pulchellus1,2,3,NB mobile invert. feeder - - - - 0.08±0.31 0.18 1.44±1.81 2.10
Bodianus rufus1,2,3,NB mobile invert. feeder - - 0.03±0.16 0.04 0.38±0.97 0.82 0.71±1.06 1.03
Clepticus brasiliensis1,3,NB planktivore - - - 0.32±1.39 0.47
Halichoeresbrasiliensis1,2,3,NB mobile invert. feeder - - 0.06±0.24 0.09 0.07±0.34 0.15 0.26±0.67 0.39
Halichoerespoeyi1,2,3,NB mobile invert. feeder 0.38±0.76 0.96 0.90±1.46 1.39 2.17±2.56 4.72 1.12±1.53 1.63
Halichoeres sazimai1,2,NB mobile invert. feeder - - - - x x 0.12±0.54 0.17
Scaridae
Cryptotomus roseus3,NB roving herbivore - - 0.05±0.55 0.08 0.15±1.55 0.33 0.53±1.91 0.77
Scarus zelindae2,NB roving herbivore - - - - 0.18±1.23 0.38 0.24±0.61 0.34
Sparisoma amplum1,2,3,NB roving herbivore 0.02±0.13 0.04 0.01±0.09 0.01 0.04±0.24 0.09 0.18±0.52 0.26
Sparisomaaxillare1,2,3,NB roving herbivore 0.15±0.50 0.38 0.35±1.19 0.54 0.43±1.38 0.93 0.79±1.98 1.16
Sparisomafrondosum1,2,3,NB roving herbivore 0.20±0.72 0.51 0.43±1.26 0.67 0.43±1.20 0.94 0.94±1.59 1.37
Sparisoma radians3,NB roving herbivore 0.03±0.20 0.06 0.03±0.22 0.05 0.16±0.61 0.35 0.74±3.07 1.07
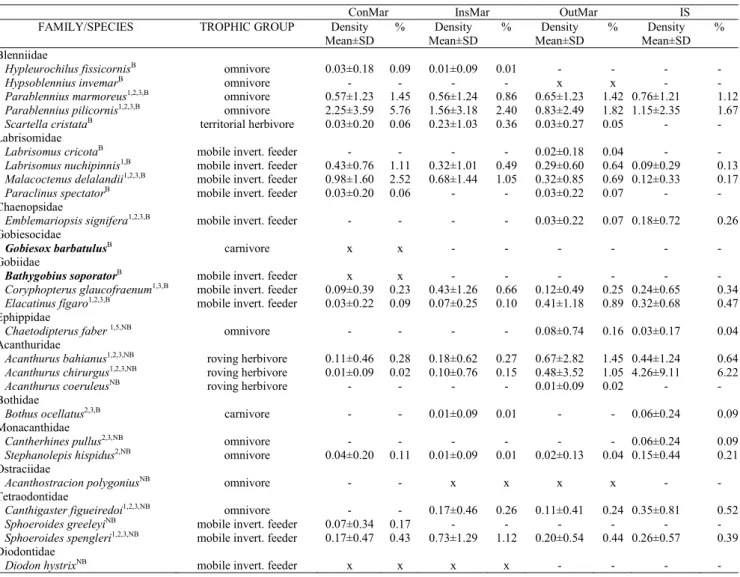
Table 1. (cont.) Rocky shore fish fauna recorded in the study region and quantitative summary for each stratum. ConMar = Continental Margin of the São Sebastião Channel; InsMar = Insular Margin of the São Sebastião Channel; OutMar = Outer Margin of São Sebastião Island; IS = islands (Alcatrazes, Búzios and Vitória). Systematic order follows Nelson (2006), Craig & Hastings (2007) and Smith & Craig (2007). Species in bold type were not observed during the censuses. Trophic groups based in data from underwater observations and stomach content analysis in Gibran & Castro (1999), Gibran (2007) and Pires & Gibran (2011), and additional literature (Randall, 1996; Carvalho-Filho, 1999; Santos, 2005) - but see Ferreira et al. (2004) for categories’ details. Species observed only during the collecting activities, photo or video records are marked with an “x” (presence) or “-” (absence). Species recorded for each of the three islands or at another locality inside the study area are discriminated with superscripts (Alcatrazes1, Búzios2, Vitória3, Farol dos Moleques4, and Channel buoys 5 - see Fig. 1 for a map). Species are also discriminated with superscripts by their positions in the water column: benthicB or nektobenthicNB.
Extrapolation-based estimates from visual census data resulted in estimates of 68 species for ConMar, 73 species for InsMar, 72 species for OutMar, and 71 species for IS (Fig. 4). Site 22, a Rocky shore between Enchovas’ Point and Enchovas’ Beach was the least speciose, with 17 species, while Site 1 (Recife point) was the richest one, with 47 species. Besides being richer, insular sites also presented the highest fish densities (Table 2). Shannon Shannon-Weaver diversity Index was calculated for all strata but did not vary significantly (max. value of 2.93 in OutMar and minimum of 2.27 in InsMar). The two-dimensional NMDS diagram reveals that fish assemblage structure varies with the distance from the coast,
with discrimination between ConMar and IS (Fig. 5). One-way ANOSIM showed significant differences in species composition between the four strata (Global R = 0.17; p < 0.001), with pairwise tests only failing to discriminate OutMar and IS (R = 0.01; p = 0.375). Two-way nested ANOSIM showed significant differences between habitat groups across strata (Global R = 0.20; p < 0.001). One-way ANOSIM also indicated significant differences in assemblage structure between habitats (Global R = 0.19; p < 0.001), with pairwise tests also indicating significant differences between each habitat pair (p < 0.001), but only with a marginally significant difference between tops and walls (R = 0.08; p < 0.001), where fish density is consistently higher than on the interfaces
ConMar InsMar OutMar IS
FAMILY/SPECIES TROPHIC GROUP Density
Mean±SD
% Density Mean±SD
% Density Mean±SD
% Density Mean±SD
%
Blenniidae
HypleurochilusfissicornisB omnivore 0.03±0.18 0.09 0.01±0.09 0.01 - - - -
Hypsoblennius invemarB omnivore - - - - x x - -
Parablenniusmarmoreus1,2,3,B omnivore 0.57±1.23 1.45 0.56±1.24 0.86 0.65±1.23 1.42 0.76±1.21 1.12
Parablennius pilicornis1,2,3,B omnivore 2.25±3.59 5.76 1.56±3.18 2.40 0.83±2.49 1.82 1.15±2.35 1.67
ScartellacristataB territorial herbivore 0.03±0.20 0.06 0.23±1.03 0.36 0.03±0.27 0.05 - -
Labrisomidae
LabrisomuscricotaB mobile invert. feeder - - - - 0.02±0.18 0.04 - -
Labrisomusnuchipinnis1,B mobile invert. feeder 0.43±0.76 1.11 0.32±1.01 0.49 0.29±0.60 0.64 0.09±0.29 0.13
Malacoctenusdelalandii1,2,3,B mobile invert. feeder 0.98±1.60 2.52 0.68±1.44 1.05 0.32±0.85 0.69 0.12±0.33 0.17
ParaclinusspectatorB mobile invert. feeder 0.03±0.20 0.06 - - 0.03±0.22 0.07 - -
Chaenopsidae
Emblemariopsis signifera1,2,3,B mobile invert. feeder - - - - 0.03±0.22 0.07 0.18±0.72 0.26
Gobiesocidae
GobiesoxbarbatulusB carnivore x x - - -
Gobiidae
BathygobiussoporatorB mobile invert. feeder x x - - -
Coryphopterus glaucofraenum1,3,B mobile invert. feeder 0.09±0.39 0.23 0.43±1.26 0.66 0.12±0.49 0.25 0.24±0.65 0.34
Elacatinus fígaro1,2,3,B mobile invert. feeder 0.03±0.22 0.09 0.07±0.25 0.10 0.41±1.18 0.89 0.32±0.68 0.47
Ephippidae
Chaetodipterusfaber1,5,NB omnivore - - - - 0.08±0.74 0.16 0.03±0.17 0.04
Acanthuridae
Acanthurusbahianus1,2,3,NB roving herbivore 0.11±0.46 0.28 0.18±0.62 0.27 0.67±2.82 1.45 0.44±1.24 0.64
Acanthurus chirurgus1,2,3,NB roving herbivore 0.01±0.09 0.02 0.10±0.76 0.15 0.48±3.52 1.05 4.26±9.11 6.22
Acanthurus coeruleusNB roving herbivore - - - - 0.01±0.09 0.02 - -
Bothidae
Bothusocellatus2,3,B carnivore - - 0.01±0.09 0.01 - - 0.06±0.24 0.09
Monacanthidae
Cantherhines pullus2,3,NB omnivore - - - 0.06±0.24 0.09
Stephanolepishispidus2,NB omnivore 0.04±0.20 0.11 0.01±0.09 0.01 0.02±0.13 0.04 0.15±0.44 0.21
Ostraciidae
Acanthostracion polygoniusNB omnivore - - x x x x - -
Tetraodontidae
Canthigaster figueiredoi1,2,3,NB omnivore - - 0.17±0.46 0.26 0.11±0.41 0.24 0.35±0.81 0.52
SphoeroidesgreeleyiNB mobile invert. feeder 0.07±0.34 0.17 - - -
Sphoeroidesspengleri1,2,3,NB mobile invert. feeder 0.17±0.47 0.43 0.73±1.29 1.12 0.20±0.54 0.44 0.26±0.57 0.39
Diodontidae
(Table 2). Dunn’s post-hoc test with paired comparisons between habitats corroborates the ANOSIM results (Table 2), with significant differences in fish density per sample between bottoms vs. walls or tops, and also between ConMar vs. InsMar, Con Mar vs. IS, InsMar vs. OutMar and OutMar vs. IS (p <0.05). The SIMPER analysis revealed 11-12 species with the highest contribution to within-group similarities at the four strata, with six consistently widespread species (Tables 1 and 3): A. saxatilis, A. virginicus, C. striatus, H. aurolineatum, P. pilicornis and S. fuscus (see Table 1). Four species characterized the interface habitat (= bottoms), Mycteroperca acutirostris, Pseudupeneus maculatus, Serranus baldwini and S. flaviventris, while seven species characterized walls and tops, C. multilineata, Labrisomus nuchipinnis, Malacoctenus delalandii, M. marginata, Parablennius marmoreus, P. pilicornis and S. fuscus (Table 3).
Discussion
The main goal of this study was to evaluate spatial variation in rocky shore fish assemblages in a regional scale, including four cross-shelf strata within the poorly known northern coast of São Paulo State, Southeastern Brazil. Sampling was extensive across the region and included the Continental and Insular Margins of the São Sebastião Channel (ConMar and InsMar, respectively), the Outer Margin of São Sebastião Island (OutMar), and three coastal islands (IS). Significant differences in reef fish assemblage structure were found along the cross-shelf gradient, with the exception of OutMar and IS assemblages, which were remarkably similar (Fig. 5). The differences between strata are higher than those between habitats, supporting the idea that geography (i.e. distance from coast, depth and visibility) is the main factor influencing reef fish assemblage structure in this region.
Due to the São Sebastião Channel curvature and local water circulation patterns, sites in the continental margin of the channel have muddy or sand-muddy bottoms at interfaces,
while those at the São Sebastião Island outer margin and coastal islands have sandy or gravel bottoms at interfaces (Furtado, 1995; Miranda & Castro Filho, 1995), with a direct impact on water transparency. Moreover, sites inside the channel are generally shallower. Channel samples were taken at an average 7.6±2.2 m depth (max. 14 m), while those from outside the channel were taken at 12.3±5.7 m (max. 24 m). Availability of rocky surface is a critical factor for reef fishes, and reef sites with higher depths present more hard surface area and a higher structural diversity for marine life to settle down. Such influence of depth range over reef fish richness, abundance and composition is well corroborated by other similar studies (e.g. Choat & Bellwood, 1985; Callum & Ormond, 1987; McGehee, 1994; Francini-Filho & Moura, 2008; Pereira-Filho et al., 2011).
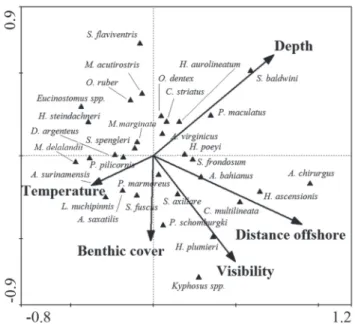
Direct gradient analyses allowed for the exploration of the relationship between the measured environmental variables and reef fish assemblage structure (ter Braak, 1994). TheCCA showed that distance offshore and depth were the main predictor variables for the fish assemblages, followed by visibility, temperature and benthic cover (Fig. 6). The first CCA axis explained 41% of the relationship between habitat characteristics and fish assemblage structure, and the first and second axes jointly explained 74.6%. Distance from the coast is strongly associated with water transparency, with higher visibilities being more frequent in the more offshore sites, favoring visually-oriented planktivores and mobile invertebrate feeders (Hobson, 1991) such as Chromis multilineata and Holocentrus ascensionis, respectively. Large sized roving herbivores Acanthurus spp., Kyphosus spp. and Sparisoma spp. are also typically associated to IS and InsMar, but the combination of resources and conditions that favor such increased abundances in offshore areas with increased visibility remains poorly understood. At least for some large-sizes species, distance from the coast can also be associated with lower fishing pressure due to accessibility constrains (Floeter et al., 2007), resulting in the increased abundances observed in these “insular” areas. The other extreme of this inshore-offshore environmental axis is characterized by fish species such as Eucinostomus spp., Orthopristis ruber, Serranus flaviventris and Haemulon steindachneri, which are typical of inshore sites with lower visibilities and stronger terrigenous influence over the rocky reef. Lowered abundances of planktivores in subtropical areas had already been reported (Ferreira et al., 2004), but another remarkable contrast between the studied system and the better known oceanic islands and tropical reefs of Northeastern Brazil (e.g. Francini-Filho et al., 2008; Pereira-Filho et al., 2011) is the lowered abundance of planktivores in the deeper areas/habitats in Southeastern Brazil.
Depth and temperature are strongly negatively correlated and compose the other orthogonal axis of important explanatory environmental variables (Fig. 6). The typical reef fish assemblage associated with deeper and colder habitats consistently includes Serranus baldwini and Pseudupeneus maculatus, this latter frequently observed feeding near the interfaces with adjacent soft bottom, besides some temperate species and species associated to deep-reefs in tropical localities (see below). Small-sized blennioids and gobioids that Fig. 2. Contribution (%) of each trophic category in the four
live closely associated with the bottom such as Malacoctenus delalandii, Labrisomus nuchipinnis and Parablennius spp., as well as the small-sized territorial herbivorous pomacentrid Stegastes fuscus, are generally associated to the other extreme of this gradient, in the shallower and warmer sites. Although we failed to find a strong explanatory power for the measured wave surge, we remark that benthic cover is closely related to the average exposure of these sites to waves and water dynamics (Floeter et al., 2007). Sheltered sites have a richest benthic coverage, while exposed sites are generally dominated by non-geniculate (low-complexity) encrusting calcareous algae. We have probably underestimated the role of wave surge in shaping reef fish assemblages across the study region because our sampling was biased towards periods (days) with relatively calm weather. Insular sites and the outer margin of the São Sebastião Island share similar reef fish assemblages (Figs. 5-6) and are definitely the places under stronger influence of wave surge during the strong Polar Front intrusions that are frequent during the winter.
Higher abundances of fish were found in the rocky walls and tops than in the interfaces between the rocky reefs and adjacent soft bottom. Indeed, these deeper and colder habitats also presented the lowest species richness, especially when they are located below the thermocline (a typical situation during the summer, especially in the more offshore sites). Tropical reef fish species predominate in the sampled assemblages (see Ebeling & Hixon, 1991), but a few temperate or deep-reef associated species such as Pagrus pagrus, Halichoeres sazimai, Chromis jubauna, C. flavicauda and C. enchrysura consistently occur near the interfaces. Many of these species are frequent in deep reefs across the tropical Brazilian coast, and they seem to extend their depth range upwards in places with frequent cold-water intrusion such as the Southeastern Brazilian shelf (Lima & Möller, 1996; Castro Filho & Miranda, 1998).
Sixty four species of the rocky reef fish assemblage can be regarded as nektobenthic, and 42 as benthic (Table 1). Most of these benthic fishes have elongate, cylinder and/or depressed bodies with disruptive coloration and more sedentary habits, while the nektobenthic fishes are more conspicuous, generally presenting laterally compressed and higher bodies, with better maneuverability due to body, caudal peduncle and fin designs, which are also associated with fins shapes and positions. Such fishes are capable to explore all of the tridimensional complexity of reef habitats (see Gibran, 2004, 2007, 2010) and are generally more widespread among the different habitats than the benthic species. For instance, the abundant small sized benthic blennioids and gobioids, both carnivores and herbivores/ detritivores characterize the shallow, warm and turbulent tops, being rare or absent in the deeper and colder habitats.
The larger roving herbivorous fishes are members of three unrelated families (Scaridae, Acanthuridae and Kyphosidae), including subsets of more closely-related species. These fishes frequently co-occur in reef communities, with several specific mechanisms enabling the long-term coexistence of these potential competitors (Schmitt & Coyer, 1982). Detailed studies involving such closely-related species can clarify their ecomorphological relationships and shifts in resource use in order to minimize interspecific competition (see Schoener, 1974; Gibran, 2010). The two small-sized serranids, S. flaviventris and S. baldwini, occur largely in the deeper habitats of the rocky reefs, where boulders and rubble accumulate increasing structural complexity. However, these two species are spatially segregated according to the distance offshore (Fig. 6), a pattern that was also observed for Diplectrum radiale and D. formosum (Gibran, 2007). Serranusflaviventris and D. radiale are mainly associated with muddy soft shallow bottoms inside the channel, while S. baldwini and D. formosum are mainly associated with sandy bottoms outside the channel, with visual communication Table 2. Number of species and fish density per sample for
each stratum and habitat. ConMar = Continental Margin of the São Sebastião Channel; InsMar = Insular Margin of the São Sebastião Channel; OutMar = Outer Margin of São Sebastião Island; IS = islands (Alcatrazes, Búzios and Vitória). Kruskal-Wallis one-way analysis of variance was used to test for significant differences among strata and habitats.
Fig. 4. Extrapolation-basedcurves of species richness derived from ACE (50 randomizations) for the four strata: (1) Continental Margin - ConMar (n = 120 samples; 4,690 individuals), (2) Insular Margin - InsMar (n = 120; 7,806 indiv.), (3) Outer Margin - OutMar (n = 120; 5,559 indiv.), and (4) Islands (Alcatrazes, Búzios and Vitória) (n = 36; 2,330 indiv.).
Samples (n)
Species/sample ±SD
Mean fish density/sample ±SD Strata
ConMar 120 8.7±3.6 39±38.3
InsMar 120 9.4±3.6 65±54.4
OutMar 120 9.2±4.8 46±41.5
IS 36 13.3±4.8 68.5±33
- H = 25.96
p < 0.001
H = 32.86 p < 0.001 Habitats
bottoms 132 7.5±4.3 40.7±44.5
walls 132 10.5±4.2 54.1±43.3
tops 132 10.3±3.6 61.0±47.1
- H = 38.94
p < 0.001
of these latter colorful species probably playing a major role under increased water transparency (see Gibran, 2007).
The predominance of carnivores in the rocky shores off Southeastern Brazil is typical of most reef systems (Sale, 1991a; Moura & Francini-Filho, 2005). Besides sharing the main evolutionary lineages with coralline reefs (Choat & Bellwood, 1991), rocky habits and other hard substrates present high spatial complexity and settlement substrates for sessile organisms, supporting a rich associated fauna and flora (Ebeling & Hixon, 1991). Mobile diurnal invertebrate feeders were predominant in all strata (Fig. 2), with a remarkable scarcity of nocturnal reef fishes (see Collette & Talbot, 1972; Moura & Francini-Filho, 2005). As observed in most ecological communities (Magurran, 1988), we also found that only a few species dominate reef fish assemblages in the São Paulo State coast. For instance, the four most abundant species, Abudefduf saxatilis, Diplodus argenteus, Haemulon aurolineatum and Stegastes fuscus encompassed more than 58% of the total number of fish counted during our entire survey. Because the number of rare species is high in reef fish assemblages, the recorded number of species in a given locality much often does not reflect the local richness, constraining comparisons and biogeographical analysis (Colwell & Coddington, 1994). However, species accumulation curves built from standardized quantitative sampling may help to overcome bias associated with unbalanced and/or incomplete sampling (Chazdon et al., 1998).
While our ACE richness estimates reached asymptotes for the three coastal strata, they indicate that the three smaller islands (AZ, BZ, and VT) comprise the richest strata, yet there is a clear need for additional sampling before a more accurate species list is reached (see Fig. 4). Indeed, considering only our census-derived data, the extrapolation-based estimates are close to the actual number of species recorded in each of the well-sampled
strata (59 in ConMar; 63 in InsMar; 67 in OutMar), with the exception of IS, as the shape of the extrapolation curve clearly indicates (Fig. 4). Species richness tended to increase with the distance offshore (Table 2, Fig. 4), probably due to a combination between resource availability (e.g. plankton), environmental conditions (e.g. visibility, light) and lowered anthropogenic stress (e.g. commercial and recreational fisheries, pollution). There are still few estimates of local species richness along the Brazilian coast (e.g. Moura & Francini-Filho, 2005; Rangel et al., 2007; Luiz Jr. et al., 2008; Hackradt & Félix-Hackradt, 2009), but the study region can be considered as an area with intermediate richness, with more species than the reefs of Santa Catarina (the meridional extreme of reef fish assemblages in the South Atlantic) and Paraná State, but lower richness than rocky and coralline reefs occurring from Rio de Janeiro and Espírito Santo northwards (e.g. Moura & Francini-Filho, 2005; Floeter et al., 2007).
The Fishing Index - FI (see Methods) seems to be a weak surrogate to fishing effort and therefore presented a weak explanatory power in our CCA. However, it is clear that this outcome of the FI does not indicate that fisheries are not an important structuring force in rocky reef fish communities (Bohnsack & Bannerot, 1986). Remarkably, high species richness and the larger species (and specimens) were found in the Alcatrazes Island (Tables 1-2, Figs. 1 and 6), a legally protected area under the competing jurisdiction of the National Protected Areas Agency (ICMBio) and the Brazilian Navy. Another few sites in the outer margin of São Sebastião Island and Channel are also legally protected, but enforcement is overall weak, with no effectively managed no-take areas across the entire region. Even the best-protected site, the Alcatrazes Island, is largely open for fisheries, as we recorded fisherfolks operating in the area during our entire survey. Fig. 5. Two-dimensional non-metric multidimensional scaling
plot (NMDS) with all samples from all strata: (1) Continental Margin - CM, (2) Insular Margin - IM, (3) Outer Margin - OM, and (4) Islands - IS (Alcatrazes, Búzios and Vitória). Notice the clear discrimination between samples from Continental Margin (CM - open squares) vs. Islands (IS - open triangles).
Recently (2010), several multiple use Marine Protected Areas (MPAs) were created in São Paulo State (including sites at the continental margin of São Sebastião Channel, the outer margin of São Sebastião Island, and the Búzios and Vitória Islands). However, while a zoning scheme including effectively managed and enforced no-take reserves is not established, these large MPAs will remain ineffective and will not contribute to the understanding of the direct and indirect effects of fisheries and protection over rocky reef communities (seePalumbi, 2001; Fournier & Castro-Panizza, 2003), which is one of the major knowledge gaps needed for reversing the overall degradation scenario that is escalating across the northern coast of São Paulo State.
Finally, we remark that our results represent a relevant baseline for future assessments and monitoring of the region’s rocky reef fish assemblages. The São Sebastião Port is planned to be largely expanded, the seafloor near Búzios and Vitória Islands had recently been crossed by gas ducts, and the protection status of the Alcatrazes Island (ESEC Tupinambás) may change. On the other hand, the study region still holds relevant remnants of Atlantic Forest and traditional “Caiçara” populations (i.e. fishermen descendants of Indians and Portuguese; see Begossi & Figueiredo, 1995) that can be engaged and lead co-management regimes based on small-scale production consortiated with new functional and well-managed no-take zones. Moreover, the region is a foremost touristic destination, meaning that its development does not
necessarily needs to be lined up by coastal degradation and exhaustion of fisheries resources. Our results show that fish assemblages respond to visibility and other physicochemical water properties that are subject to change with port expansion, large scale and chronic accidents from the oil and gas industry, and the ever-increasing land-derived disturbances (e.g. Bertness et al., 2001; Nybakken, 2001). Thus, a large scale monitoring program is highly needed for this important region, coupled with MPA zoning and implementation.
Acknowledgements
This paper results from FZG post-doctoral research. We are indebted to E. Trajano (IB-USP) and C. G. Tiago CEBIMar-USP for essential advice and infrastructure; C. Saviolli, E. Honuma, E. A. da Silva, E. Ale, F. A. M. Costa, J. J. C. Lucena, J. M. de Oliveira, J. M. E. Van Sebroeck, O. M. P. de Oliveira, P. Schimidt Jr., R. F. Martins, T. H. S. Pires, V. Albanez and K. L. L. Ferreira for assistance in the field; R. B. Francini-Filho for fish identification and valuable suggestions; V. K. Verdade for useful suggestions on the manuscript and English revision; CEBIMar-USP and Marinha do Brasil for logistical support; IBAMA, ICMBio and ESEC Tupinambás for collecting permit (SISBIO 12721-1) and field support; FAPESP (grants 05/51855-0, 05/51856-6, and 2008/02861-5 to FZG) and CNPq (grant to RLM) for financial support.
Table 3. Fish species with greater contribution to dissimilarity in each stratum and habitat (Percentage Similarity Analysis -SIMPER). ConMar = Continental Margin of the São Sebastião Channel; InsMar = Insular Margin of the São Sebastião Channel; OutMar = Outer Margin of São Sebastião Island; IS = islands (Alcatrazes, Búzios and Vitória). Only the 31 species representing more than 0.45% of total abundance were considered.
STRATA HABITATS
ConMar InsMar OutMar IS Bottoms Walls Tops
Average similarity 31.82 34.04 28.11 37.15 25.98 31.74 36.38
Species % contribution % contribution % contribution % contribution % contribution % contribution % contribution
Abudefduf saxatilis 12.03 19.77 11.53 9.22 3.27 14.8 27.28
Acanthurus chirurgus - - - 3.21 - - -
Anisotremus virginicus 9.11 2.49 10.48 2.09 7.74 7.33 4.27
Chaetodon striatus 4.54 7.63 8.14 6.25 9.96 9.63 2.96
Chromis multilineata - - 2.18 10.2 - 2.29 -
Diplodus argenteus 16.28 3.64 9.72 - 5.2 7.26 10.71
Haemulon aurolineatum 7.6 25.52 14.35 36.36 38.11 17.16 6.48
Haemulon steindachneri 10.58 2.55 - - 3.06 3.52 -
Halichoeres poeyi - 5.24 14.54 4.47 10.44 4.24 3.36
Holocentrus adscensionis - - 2.32 6.75 - - -
Kyphosus spp. - - - 2.07 - - -
Labrisomus nuchipinnis - - - - - - 3.45
Malacoctenus delalandii 4.98 - - - - 1.6 3.79
Mycteroperca acutirostris 3.54 - - - 3.4 - -
Mycteroperca marginata 3.52 2.19 - - - 2.88 2.29
Parablennius marmoreus - - 2.56 - - 2.87 2.44
Parablennius pilicornis 11.91 3.19 1.49 2.2 - 5.76 6.85
Pseudupeneus maculatus - - 3.31 - 4.37 - -
Serranus baldwini - - - - 1.81 - -
Serranus flaviventris 4.07 - - - 2.66 - -
Sparisoma frondosum - - - 2.05 - - -
Sphoeroides spengleri - 3.06 - - - - -
Literature Cited
Begossi, A. & J. L. Figueiredo. 1995. Ethnoichthyology of southern coastal fishermen: cases from Búzios Island and Sepetiba Bay (Brazil). Bulletin of Marine Science, 56: 710-717.
Bellwood, D. R. 1998. What are reef fishes? - Comment on the report by D. R. Robertson: Do coral-reef fish faunas have a distinctive taxonomic structure? Coral Reefs, 17: 187-189. Bertness, M. D., S. D. Gaines & M. E. Hay. 2001. Marine
community ecology. Sunderland, Sinauer Associates, Inc., 550p. Bohnsack, J. A. & S. P. Bannerot. 1986. A stationary visual census technique for quantitatively assessing community structure of coral reef fish. NOAA Technical Report NMFS, 41: 1-15. ter Braak, C. J. F. 1986. Canonical correspondence analysis: a new
eigenvector technique for multivariate direct gradient analysis. Ecology, 67: 1167-1179.
ter Braak, C. J. F. 1994. Canonical community ordination. Part I: Basic theory and linear methods. Ecoscience, 1: 127-140. Briggs, J. C. 1974. Marine zoogeography. New York,
McGraw-Hill, 475p.
Callumm, M. R. & R. F. Ormond. 1987. Habitat complexity and coral reef fish diversity and abundance on red sea fringing reefs. Marine Ecology Progress Series, 41: 1-8.
Carvalho-Filho, A. 1999. Peixes: costa brasileira. 3ª ed. São Paulo, Editora Melro, 320p.
Castro Filho, B. M. & L. B. Miranda. 1998. Physical oceanography of the western Atlantic continental shelf between 4°N and 34°S. Pp. 209-251. In: Brink, K. H. & A. R. Robinson (Eds.). The Global Coastal Oceans: Processes and Methods, Vol. 10, The Sea. New York, John Wiley & Sons, Inc., 604p.
Chazdon, R. L., R. K. Colwell, J. S. Denslow & M. R. Guariguata. 1998. Statistical methods for estimating species richness of woody regeneration in primary and secondary rain forests of northeastern Costa Rica. Pp: 285-309. In: Dallmeier, F. & J. A. Comiskey (Eds.). Forest Biodiversity Research, Monitoring and Modeling: Conceptual Background and Old World Case Studies (Man and the Biosphere v. 20) Paris & The Parthenon Publishing Group, UNESCO, 696p.
Choat, J. H. & D. R. Bellwood. 1985. Interactions amongst herbivorous fishes on a coral reef: influence of spatial variation. Marine Biology, 89: 221-234.
Choat, J. H. & D. R. Bellwood. 1991. Reef fishes: their history and evolution. Pp: 39-66. In: Sale, P. F. (Ed). The Ecology of Fishes on Coral Reefs. San Diego, Academic Press, 754p.
Clarke, K. R. 1993. Non-parametric multivariate analyses of changes in community structure. Australian Journal of Ecology, 18: 117-143.
Clarke, K. R. & R. M. Warwick. 2001. Change in marine communities: an approach to statistical analysis and interpretation. 2nd ed. PRIMER-E, Plymouth.
Collette, B. B. & F. H. Talbot. 1972. Activity patterns of coral reef fishes with emphasis on nocturnal-diurnal changeover. Bulletin of Los Angeles County Museum of Natural History, 14: 98-124. Colwell, R. K. 2011. EstimateS: statistical estimation of species richness and shared species from samples. Version 8.2. User’s Guide and applications published at http:// viceroy.eeb.uconn.edu/EstimateS
Colwell, R. K. & J. A. Coddington. 1994. Estimating terrestrial biodiversity through extrapolation. Philosophical Transactions of the Royal Society (Series B), 345: 101-118.
Craig, M. T. & P. A. Hastings. 2007. A molecular phylogeny of the groupers of the subfamily Epinephelinae (Serranidae) with a
revised classification of the Epinephelini. Ichthyological Research, 54: 1-17.
Ebeling, A. W. & M. A. Hixon. 1991. Tropical and temperate reef fishes: comparison of community structures. Pp. 509-563. In: Sale, P. F. (Ed.). The Ecology of Fishes on Coral Reefs. San Diego, Academic Press, Inc., 754p.
Eschmeyer, W. N., R. Fricke, J. D. Fong & D. A. Polack. 2010. Marine fish diversity: history of knowledge and discovery (Pisces). Zootaxa, 2525: 19-50.
Ferreira, B. P., M. Maida & A. A. E. T. Souza. 1995. Levantamento inicial das comunidades de peixes recifais da região de Tamandaré, PE. Boletim Técnico-Científico do CEPENE, Tamandaré, 3: 211-230.
Ferreira, C. E. L., S. R. Floeter, J. L. Gasparini, B. P. Ferreira & J. C. Joyeux. 2004. Trophic structure patterns of Brazilian reef fishes: a latitudinal comparison. Journal of Biogeography, 31: 1093-1106.
Ferreira, C. E. L., J. E. A. Gonçalves & R. Coutinho. 2001. Community structure of fishes and habitat complexity on a tropical rocky shore. Environmental Biology of Fishes, 61: 353-369.
Floeter, S. R. & J. L. Gasparini. 2000. The southwestern Atlantic reef-fish fauna: composition and zoogeographic patterns. Journal of Fish Biology, 56: 1099-1114.
Floeter, S. R., R. Z. P. Guimarães, L. A. Rocha, C. E. L. Ferreira, C. A. Rangel & J. L. Gasparini. 2001. Geographic variation in reef-fish assemblages along the Brazilian coast. Global Ecology and Biogeography, 10: 423-431.
Floeter, S. R., W. Krohling, J. L. Gasparini, C. E. L. Ferreira & I. R. Zalmon. 2007. Reef fish community structure on coastal islands of the southeastern Brazil: the influence of exposure and benthic cover. Environmental Biology of Fishes, 78: 147-160. Fournier, J. & A. Castro Panizza. 2003. Contributions of the marine
protected areas for the conservation and management of the marine environment. Revista RA´E GA, Curitiba, 7: 55-62. Francini-Filho, R. B. & R. L. Moura. 2008. Dynamics of fish
assemblages on coral reefs subjected to different management regi-mes in the Abrolhos Bank, eastern Brazil. Aquatic Conservation: Marine and Freshwater Ecosystems, 18: 1166-1179.
Francini-Filho, R. B., R. L. Moura, C. M. Ferreira & E. O. C. Coni. 2008. Live coral predation by parrotfishes (Perciformes: Scaridae) in the Abrolhos Bank, eastern Brazil, with comments on the classification of species into functional groups. Neotropical Ichthyology, 6: 191-200.
Furtado, V. V. 1995. Sedimentação quaternária no Canal de São Sebastião. Publicação Especial do Instituto Oceanográfico, São Paulo, 11: 27-35.
Gibran, F. Z. 2004. Biologia e ecomorfologia da ictiofauna marinha em um trecho da margem continental do Canal de São Sebastião, São Paulo. Unpublished Ph.D. Dissertation, Universidade de São Paulo, Ribeirão Preto, 112p.
Gibran, F. Z. 2007. Activity, habitat use, feeding behavior, and diet of four sympatric species of Serranidae (Actinopterygii: Perciformes) in southeastern Brazil. Neotropical Ichthyology, 5: 387-398.
Gibran, F. Z. 2010. Habitat partitioning, habits and convergence among coastal nektonic fish species from the São Sebastião Channel, southeastern Brazil. Neotropical Ichthyology, 8: 299-310. Gibran, F. Z. & R. M. C. Castro. 1999. Activity, feeding behaviour
and diet of Ogcocephalusvespertilio in southern west Atlantic. Journal of Fish Biology, 55: 588-595.